Outcome analysis for primary tumors
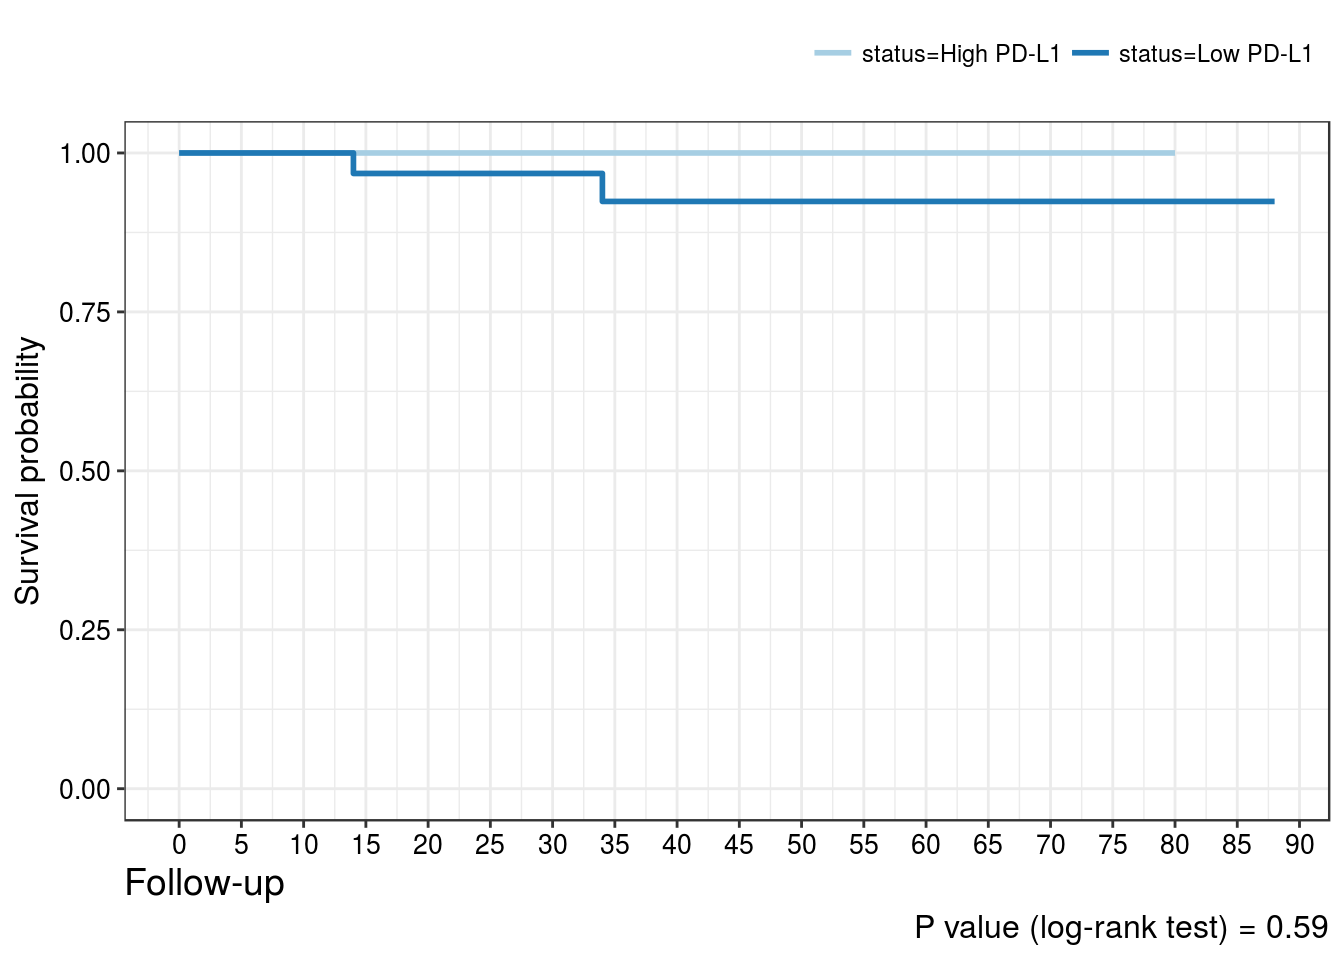
PD-L1 expression
Tumor progression
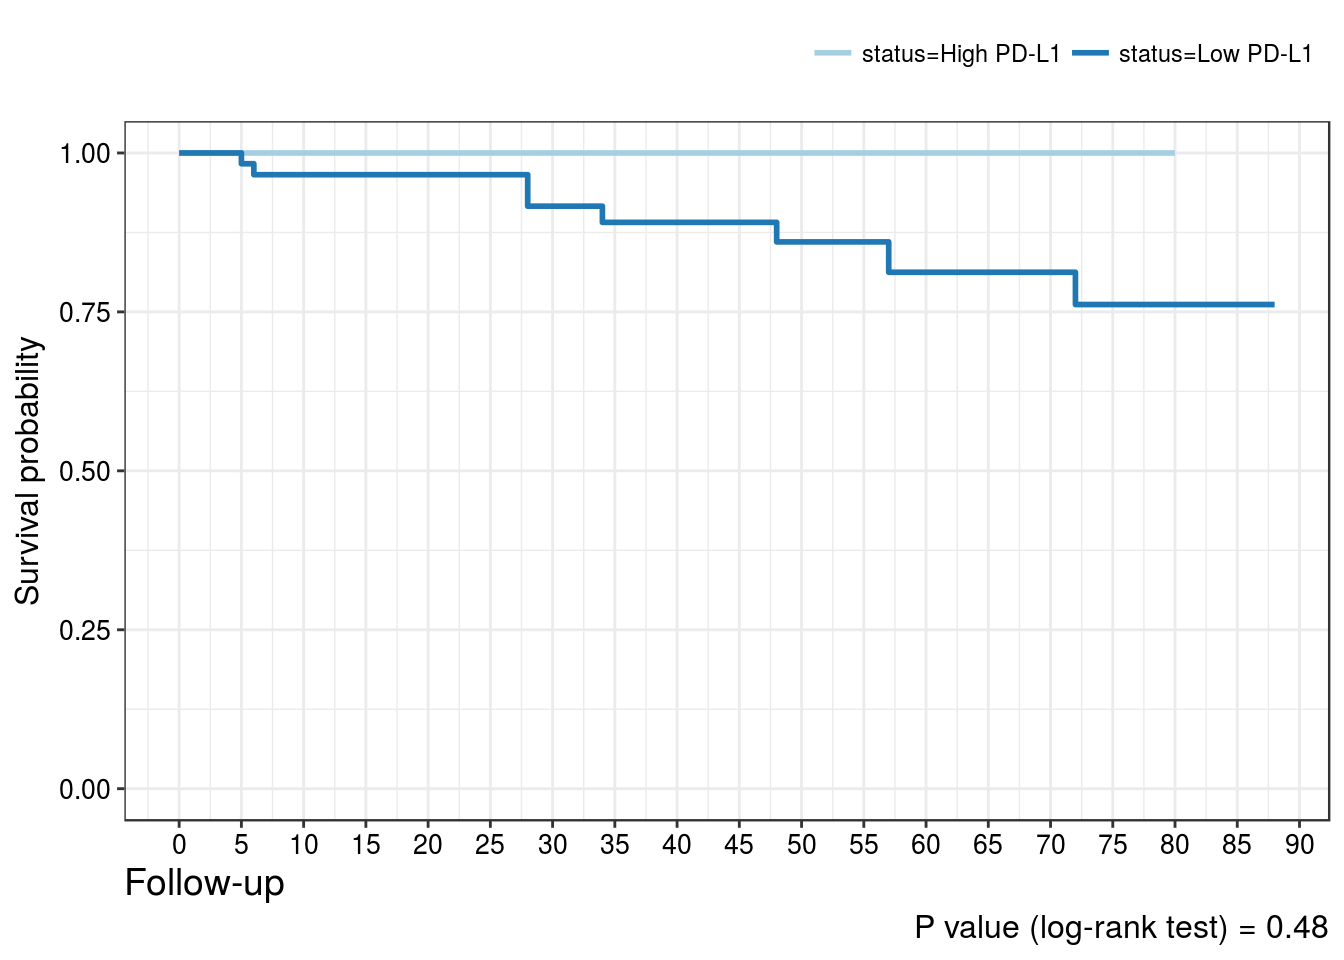
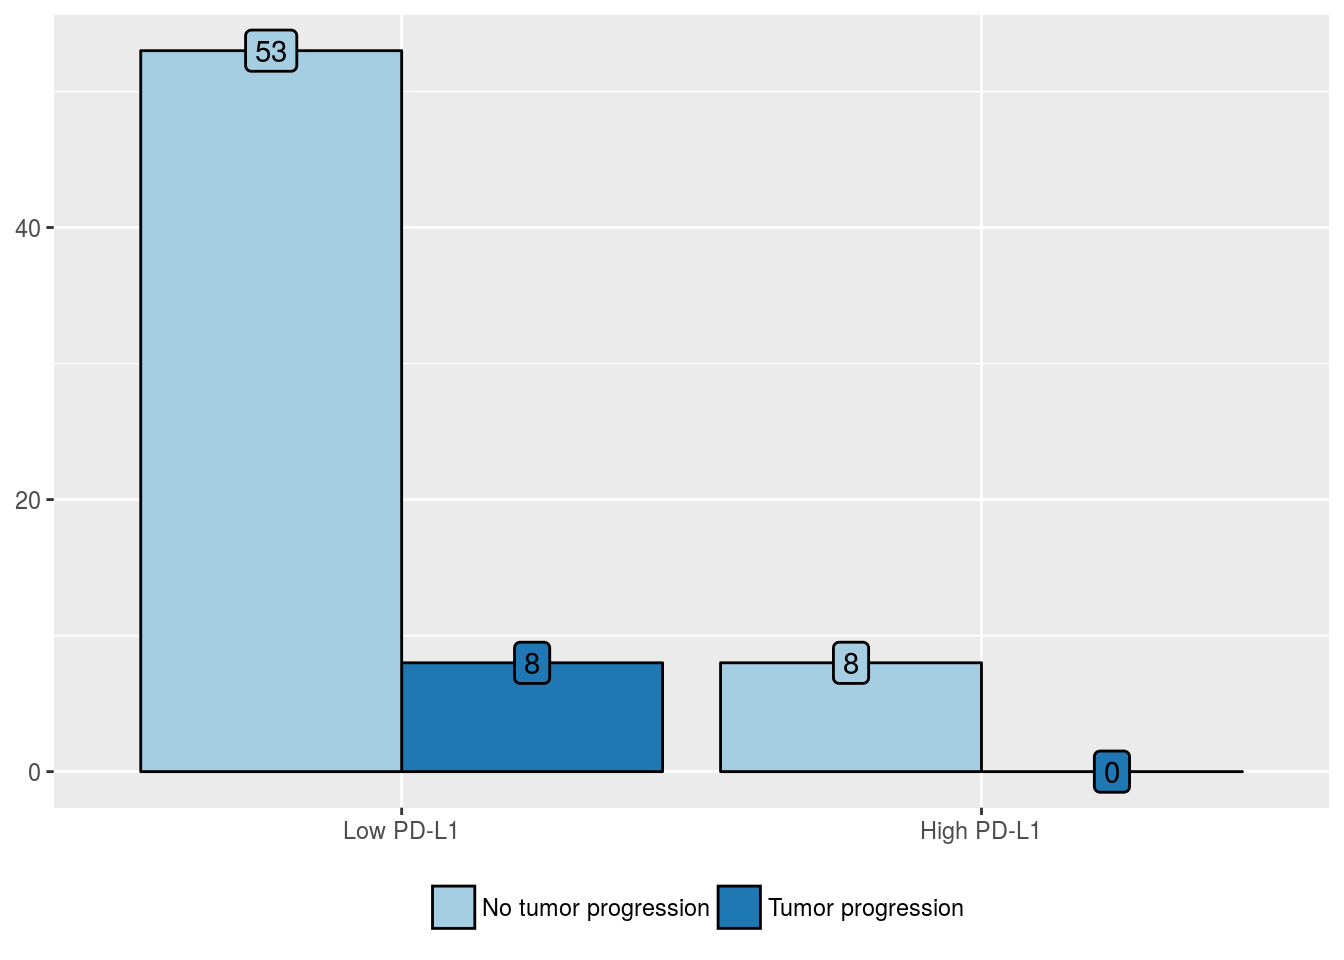
PD-L1 positivity in tumor cells
| No tumor progression (%) | Tumor progression (%) | |
|---|---|---|
| Low PD-L1 | 53 (86.9) | 8 (100) |
| High PD-L1 | 8 (13.1) | 0 (0) |

| Predictors | Odds Ratio (95% CI) | P value | Hazard Ratio (95% CI) | P value |
|---|---|---|---|---|
| High PDL1 positivity in tumor cells | 5.7e-08 (NA, 5.4e+61) | 0.99 | 1.3e-08 (0.00, Inf) | 0.32 |
PD-L1 H-score in tumor cells
| No tumor progression (%) | Tumor progression (%) | |
|---|---|---|
| Low PD-L1 | 53 (86.9) | 8 (100) |
| High PD-L1 | 8 (13.1) | 0 (0) |
| Predictors | Odds Ratio (95% CI) | P value | Hazard Ratio (95% CI) | P value |
|---|---|---|---|---|
| High PDL1 H-score in tumor cells | 5.7e-08 (NA, 5.4e+61) | 0.99 | 1.3e-08 (0.00, Inf) | 0.32 |

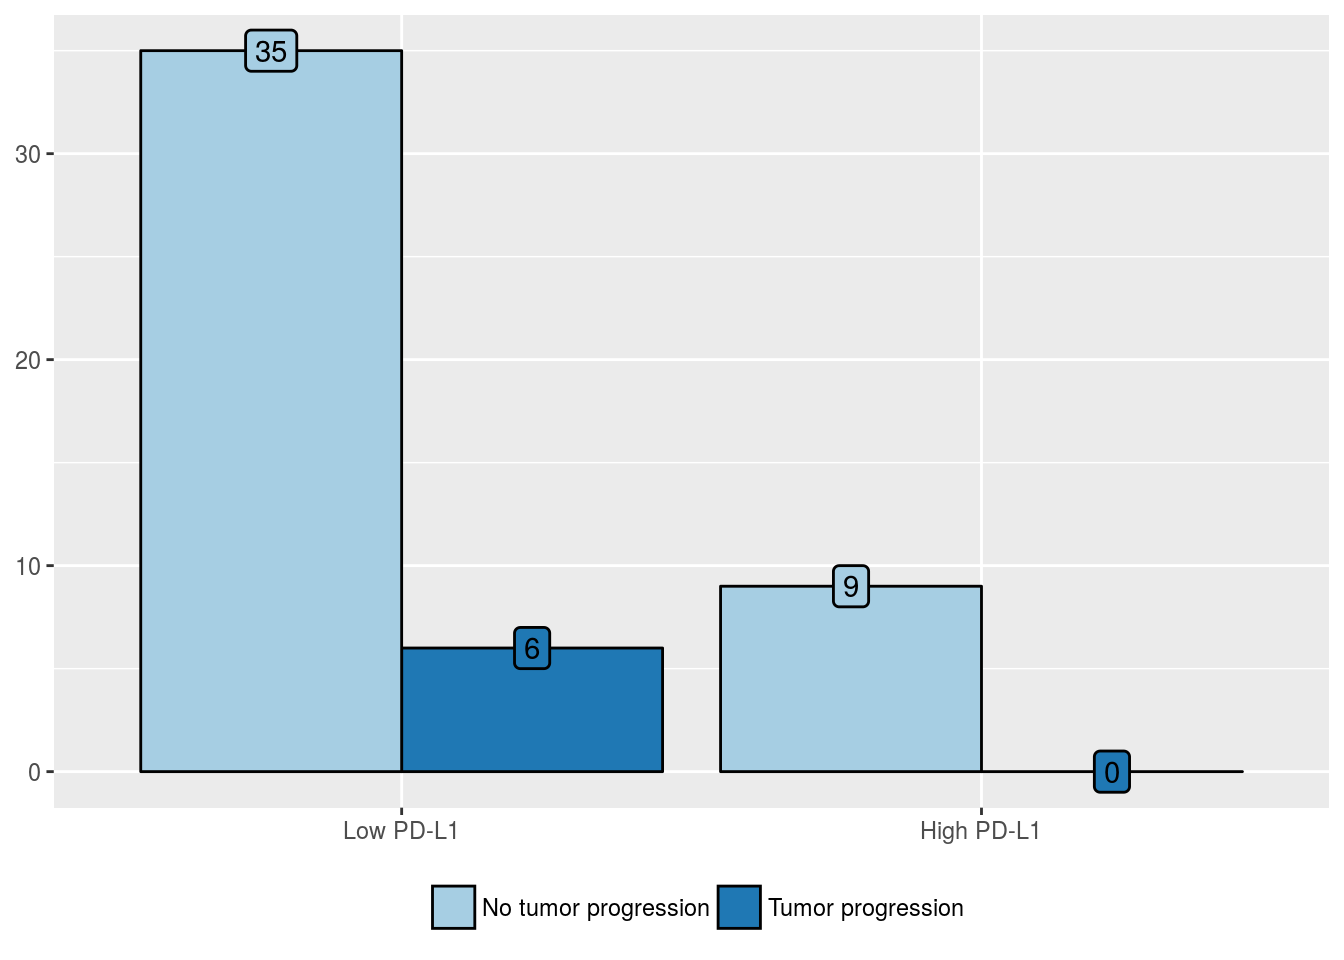
PD-L1 positivity in stromal cells
| No tumor progression (%) | Tumor progression (%) | |
|---|---|---|
| Low PD-L1 | 35 (79.5) | 6 (100) |
| High PD-L1 | 9 (20.5) | 0 (0) |
| Predictors | Odds Ratio (95% CI) | P value | Hazard Ratio (95% CI) | P value |
|---|---|---|---|---|
| High PDL1 positivity in stromal cells | 5e-08 (NA, 3.9e+86) | 0.99 | 1.2e-08 (0.00, Inf) | 0.24 |
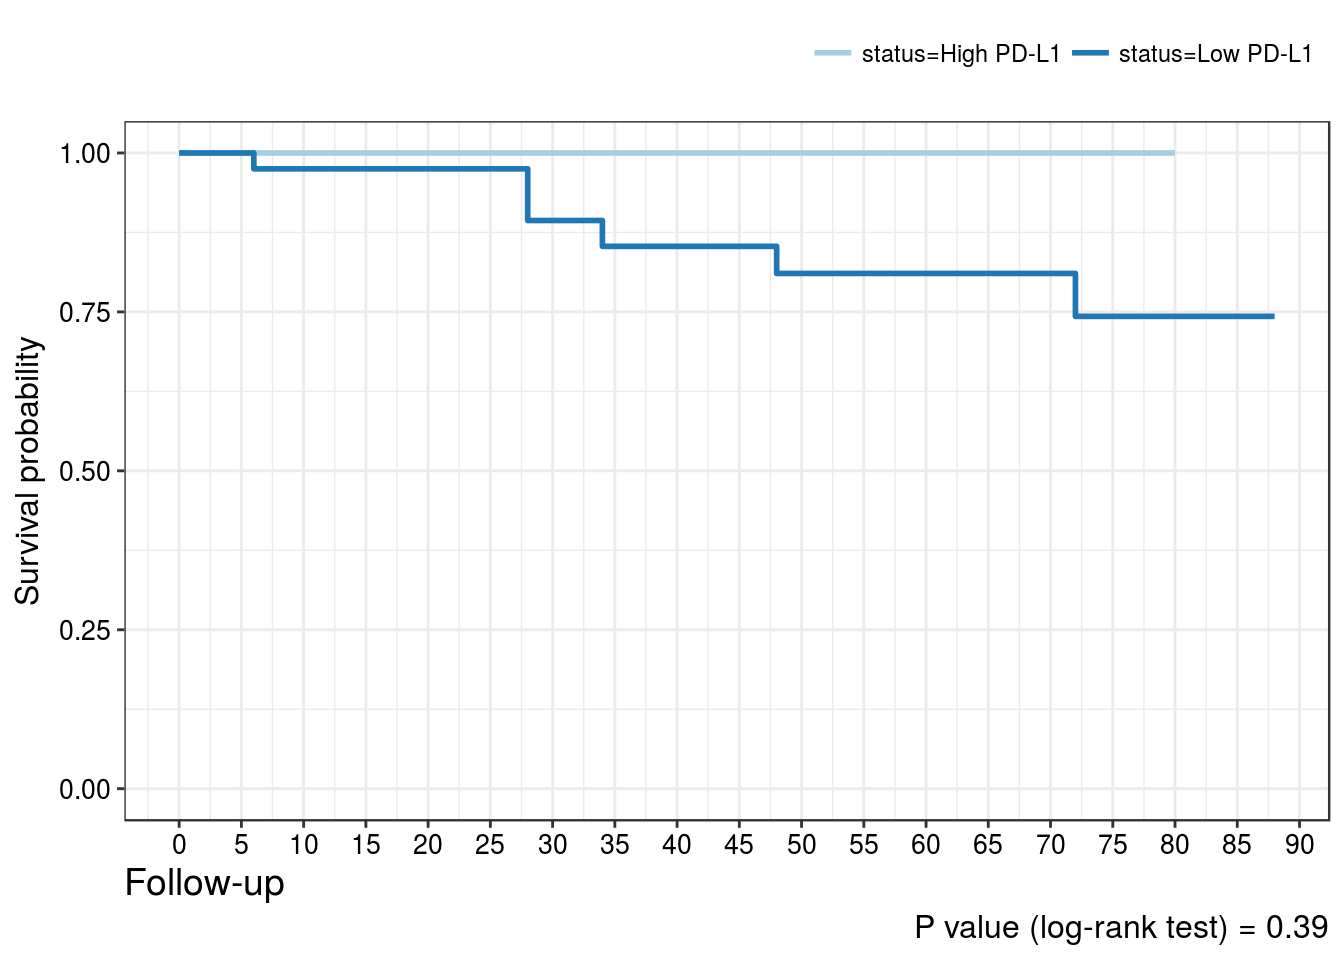
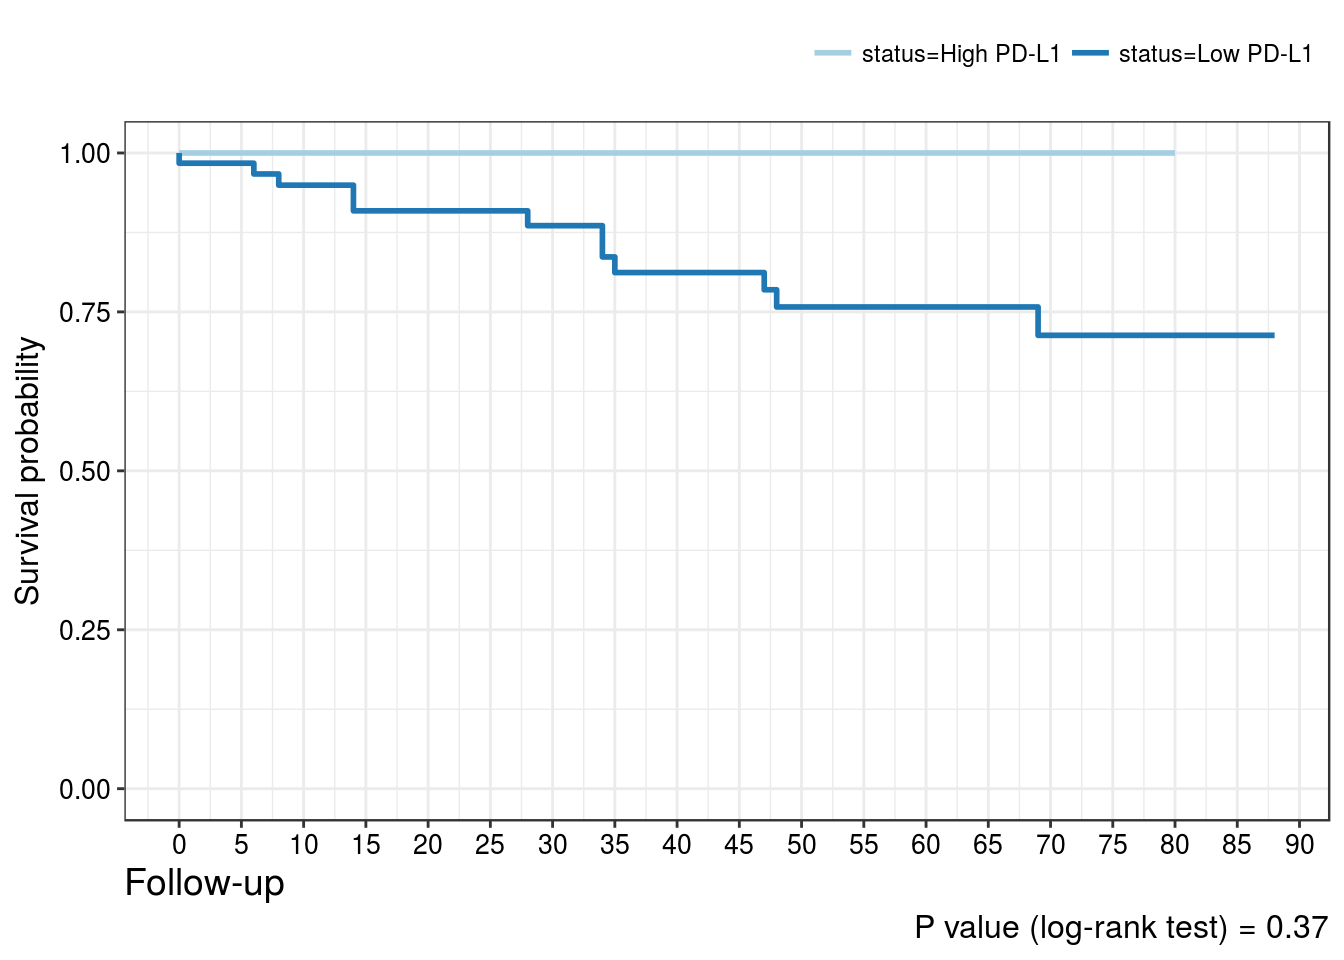
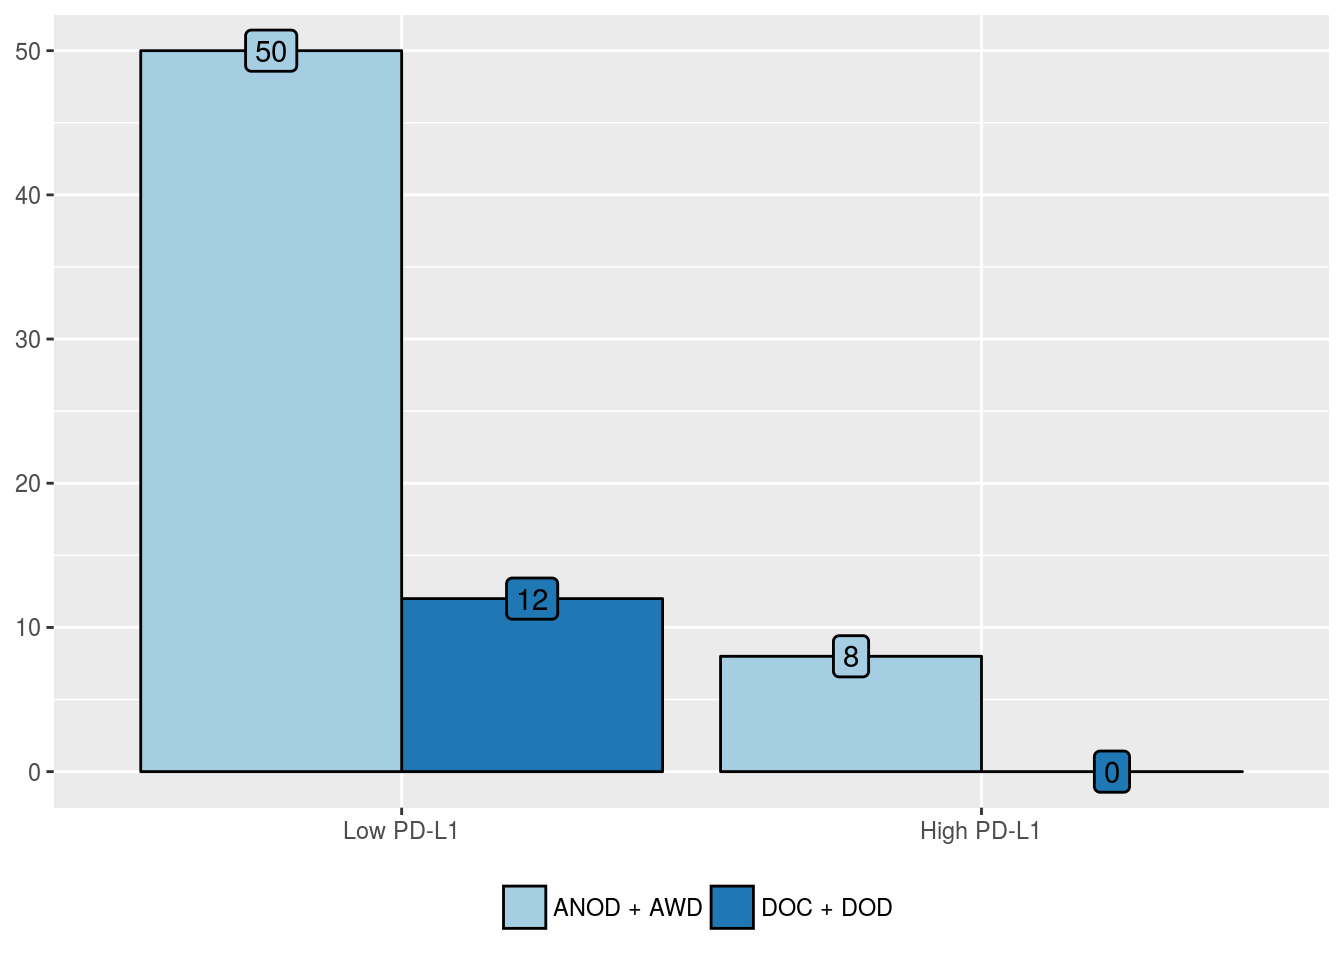
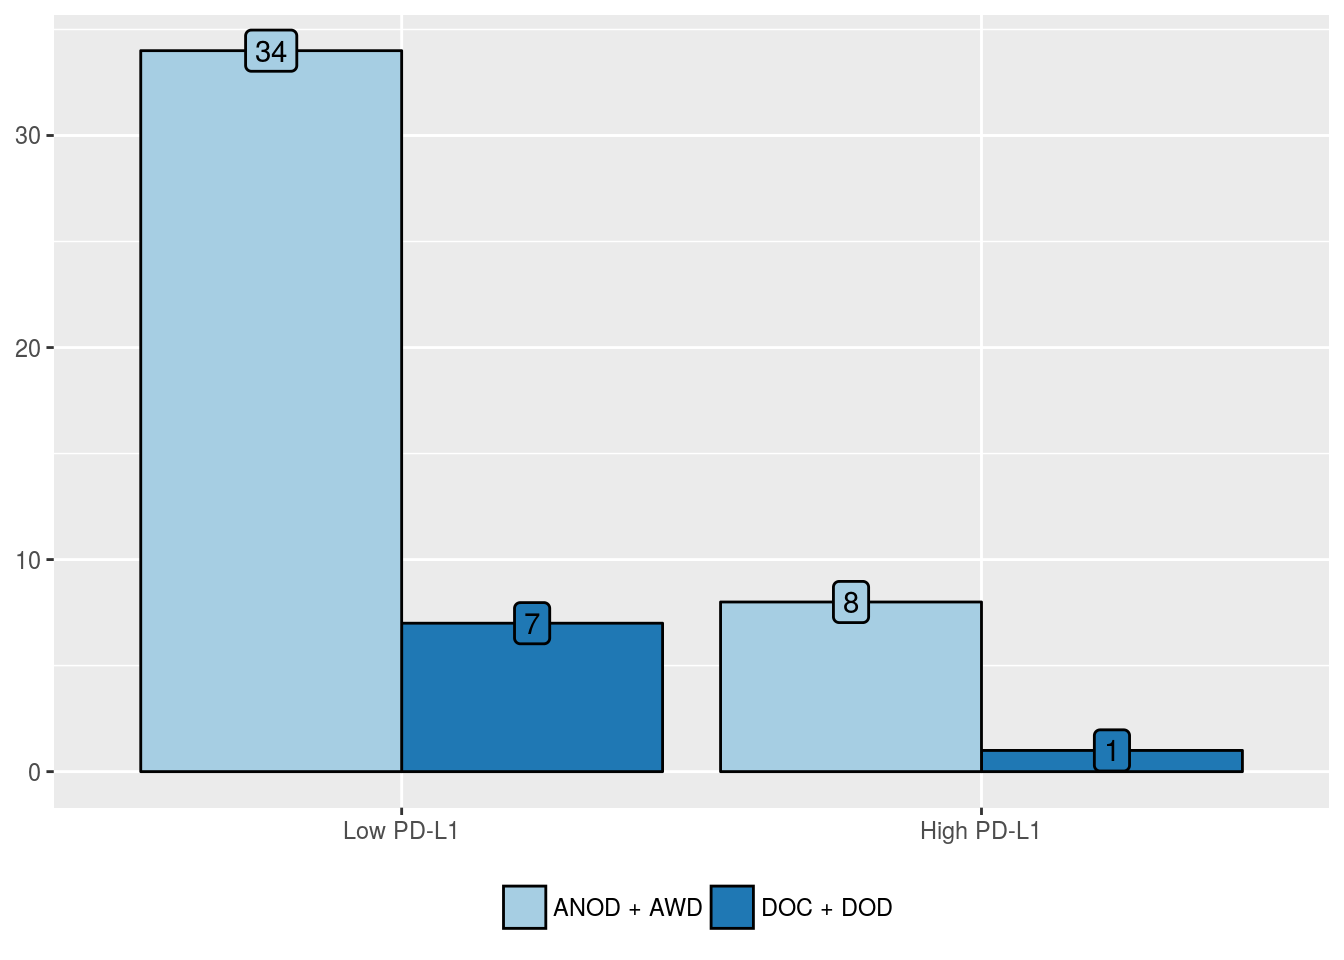
Overall mortality
PD-L1 positivity in tumor cells
| ANOD + AWD (%) | DOC + DOD (%) | |
|---|---|---|
| Low PD-L1 | 50 (86.2) | 12 (100) |
| High PD-L1 | 8 (13.8) | 0 (0) |

| Predictors | Odds Ratio (95% CI) | P value | Hazard Ratio (95% CI) | P value |
|---|---|---|---|---|
| High PDL1 positivity in tumor cells | 3.6e-08 (NA, 5.2e+76) | 0.99 | 1.3e-08 (0.00, Inf) | 0.22 |
PD-L1 H-score in tumor cells
| ANOD + AWD (%) | DOC + DOD (%) | |
|---|---|---|
| Low PD-L1 | 50 (86.2) | 12 (100) |
| High PD-L1 | 8 (13.8) | 0 (0) |
| Predictors | Odds Ratio (95% CI) | P value | Hazard Ratio (95% CI) | P value |
|---|---|---|---|---|
| High PDL1 H-score in tumor cells | 3.6e-08 (NA, 5.2e+76) | 0.99 | 1.3e-08 (0.00, Inf) | 0.22 |

PD-L1 positivity in stromal cells
| ANOD + AWD (%) | DOC + DOD (%) | |
|---|---|---|
| Low PD-L1 | 34 (81) | 7 (87.5) |
| High PD-L1 | 8 (19) | 1 (12.5) |
| Predictors | Odds Ratio (95% CI) | P value | Hazard Ratio (95% CI) | P value |
|---|---|---|---|---|
| High PDL1 positivity in stromal cells | 0.61 (0.03, 4.16) | 0.66 | 1.04 (0.13, 8.57) | 0.97 |
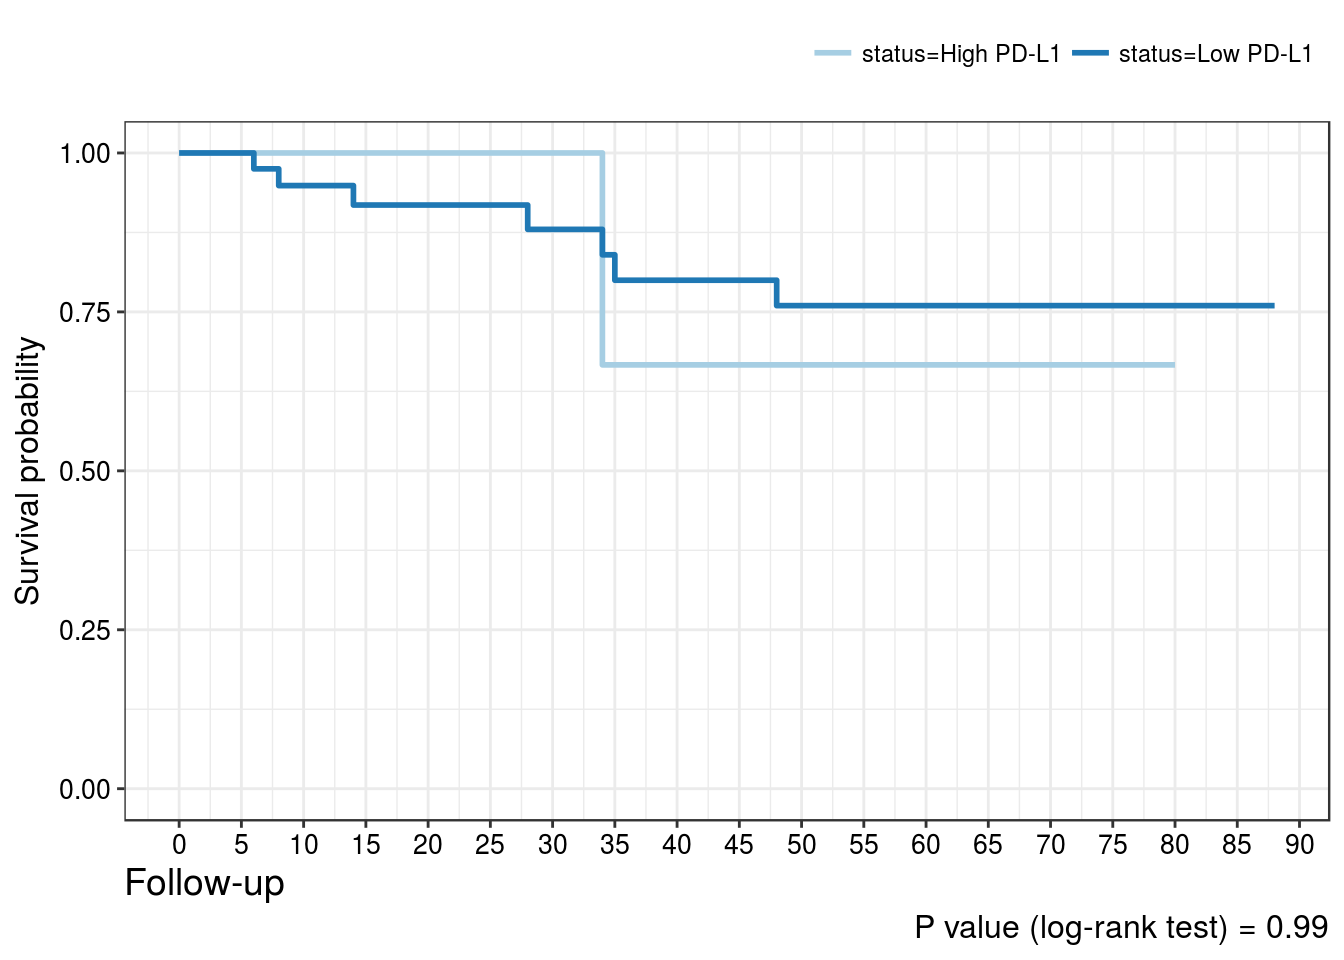
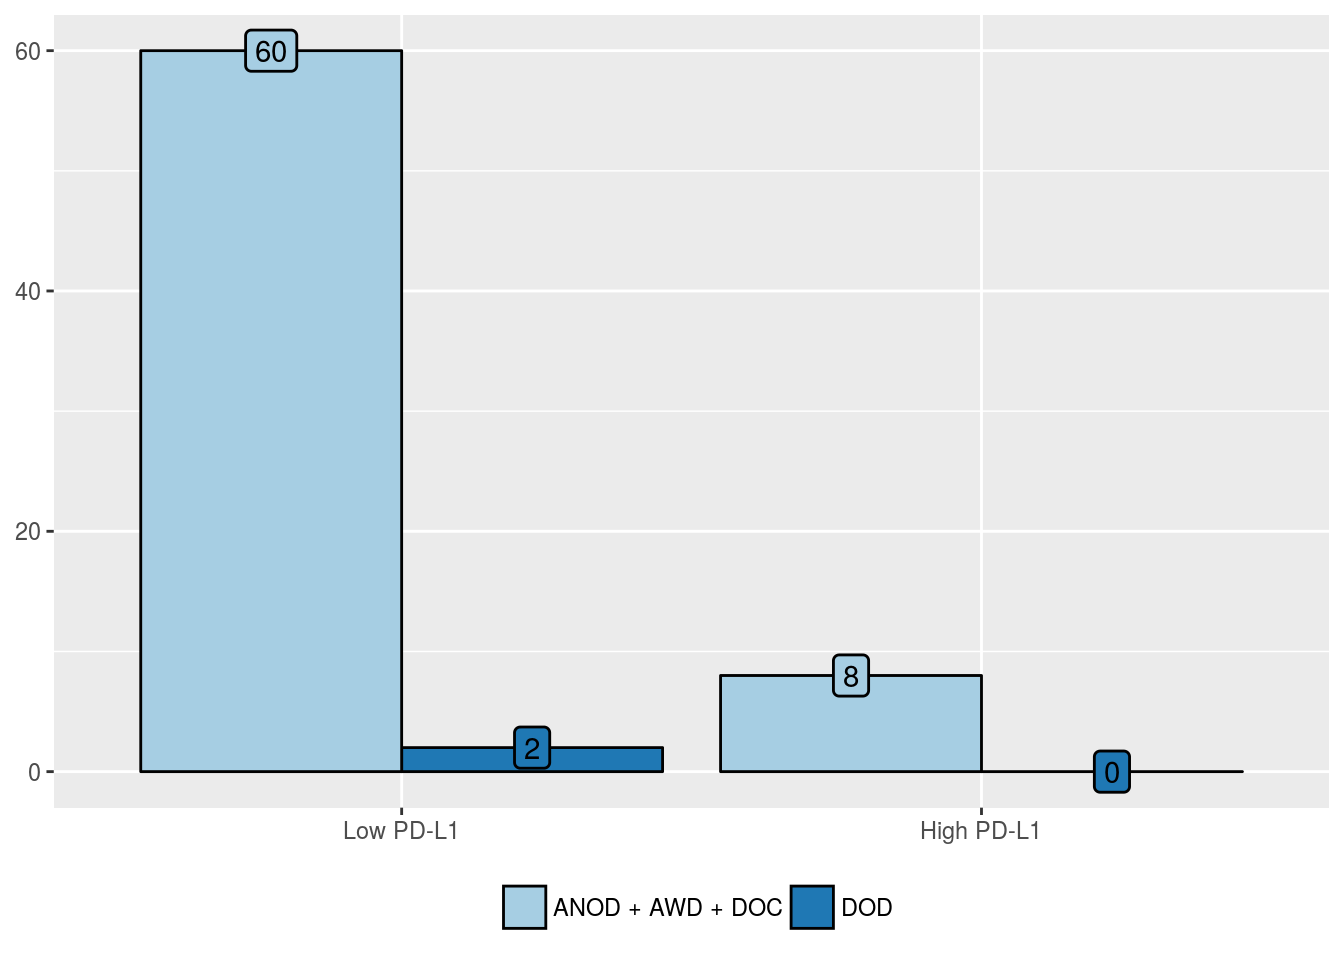
Cancer-related mortality
PD-L1 positivity in tumor cells
| ANOD + AWD + DOC (%) | DOD (%) | |
|---|---|---|
| Low PD-L1 | 60 (88.2) | 2 (100) |
| High PD-L1 | 8 (11.8) | 0 (0) |
| Predictors | Odds Ratio (95% CI) | P value | Hazard Ratio (95% CI) | P value |
|---|---|---|---|---|
| High PDL1 positivity in tumor cells | 9.5e-08 (NA, 2.4e+268) | 1 | 3.7e-08 (0.00, Inf) | 0.64 |
PD-L1 H-score in tumor cells
| ANOD + AWD + DOC (%) | DOD (%) | |
|---|---|---|
| Low PD-L1 | 60 (88.2) | 2 (100) |
| High PD-L1 | 8 (11.8) | 0 (0) |

| Predictors | Odds Ratio (95% CI) | P value | Hazard Ratio (95% CI) | P value |
|---|---|---|---|---|
| High PDL1 H-score in tumor cells | 9.5e-08 (NA, 2.4e+268) | 1 | 3.7e-08 (0.00, Inf) | 0.64 |

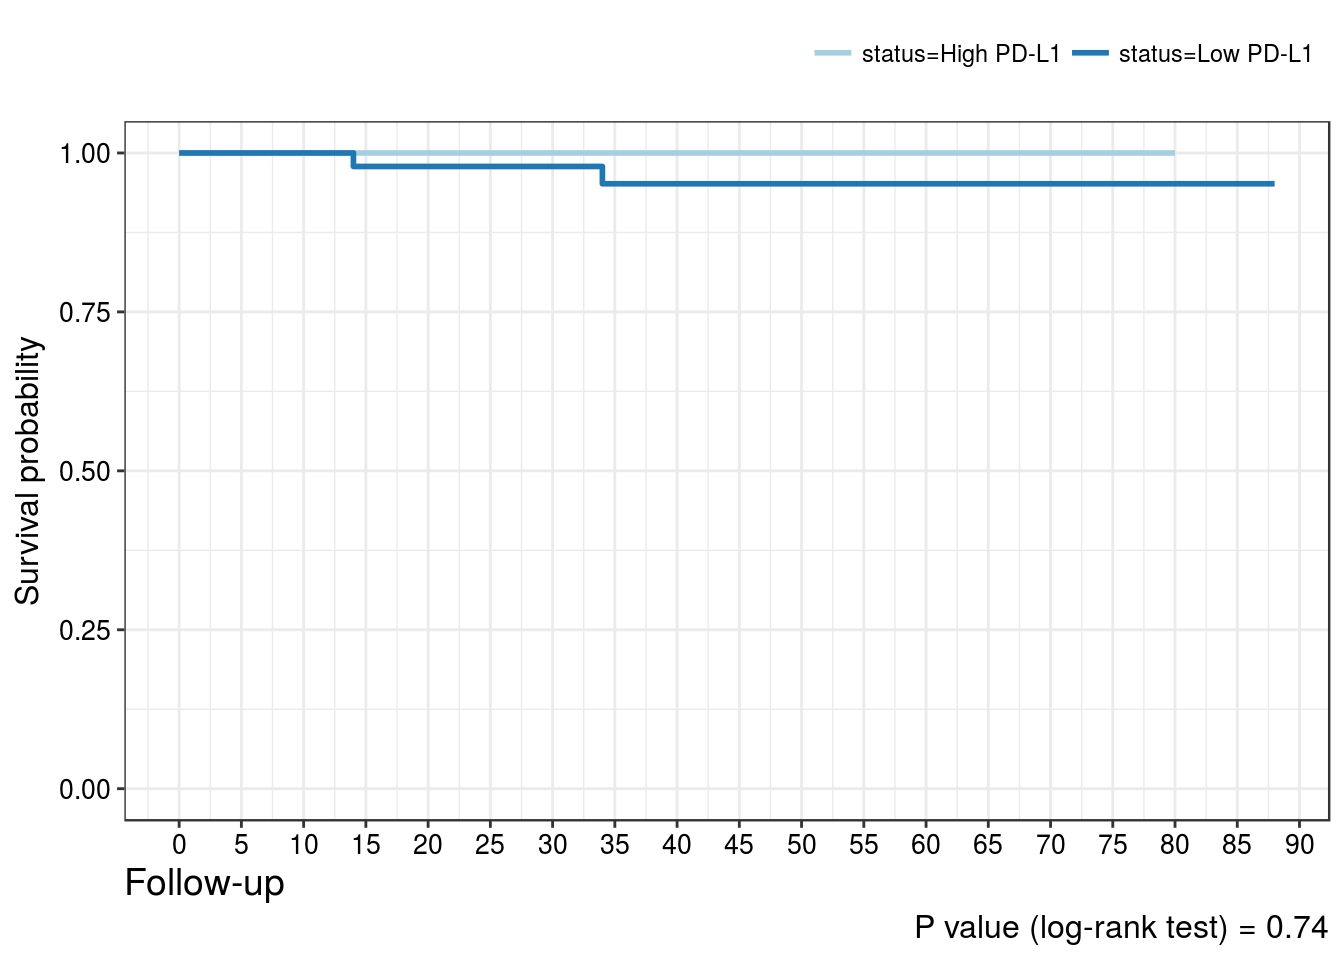
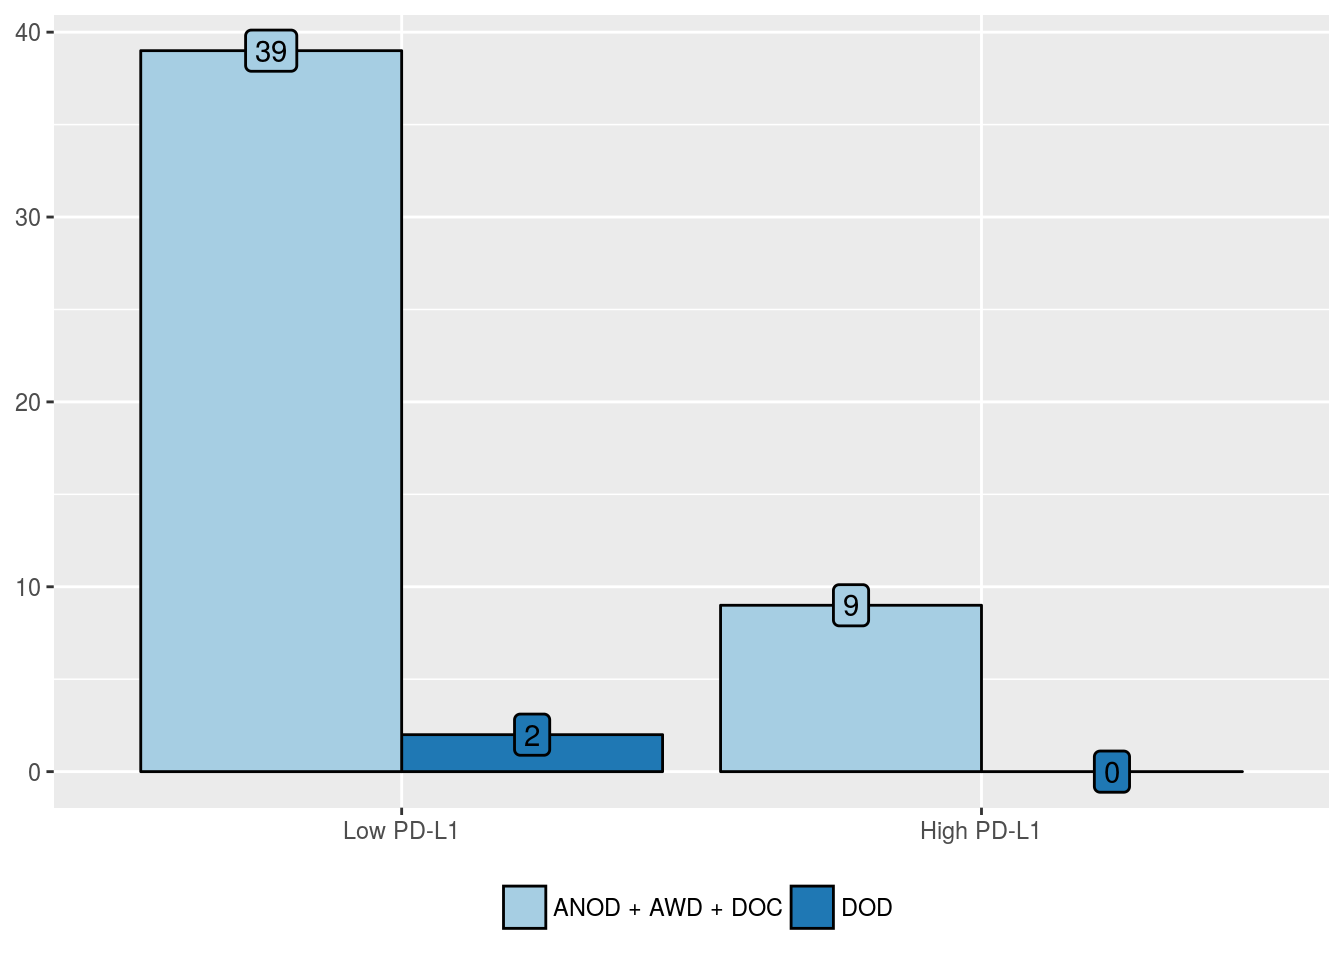
PD-L1 positivity in stromal cells
| ANOD + AWD + DOC (%) | DOD (%) | |
|---|---|---|
| Low PD-L1 | 39 (81.2) | 2 (100) |
| High PD-L1 | 9 (18.8) | 0 (0) |
| Predictors | Odds Ratio (95% CI) | P value | Hazard Ratio (95% CI) | P value |
|---|---|---|---|---|
| High PDL1 positivity in stromal cells | 6.2e-08 (NA, 7e+250) | 1 | 1.2e-08 (0.00, Inf) | 0.46 |
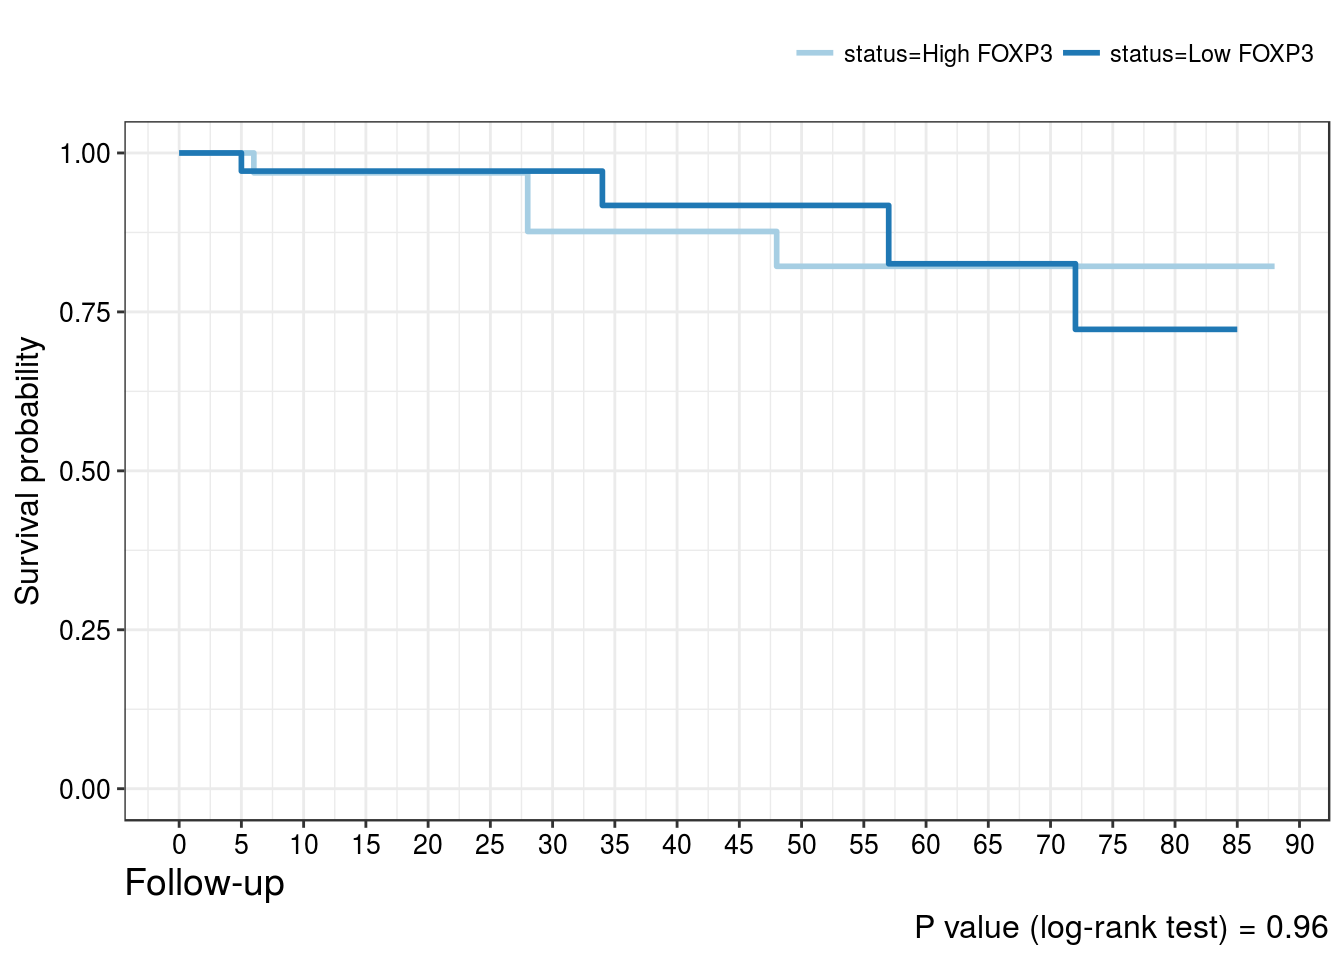
FOXP3 expression
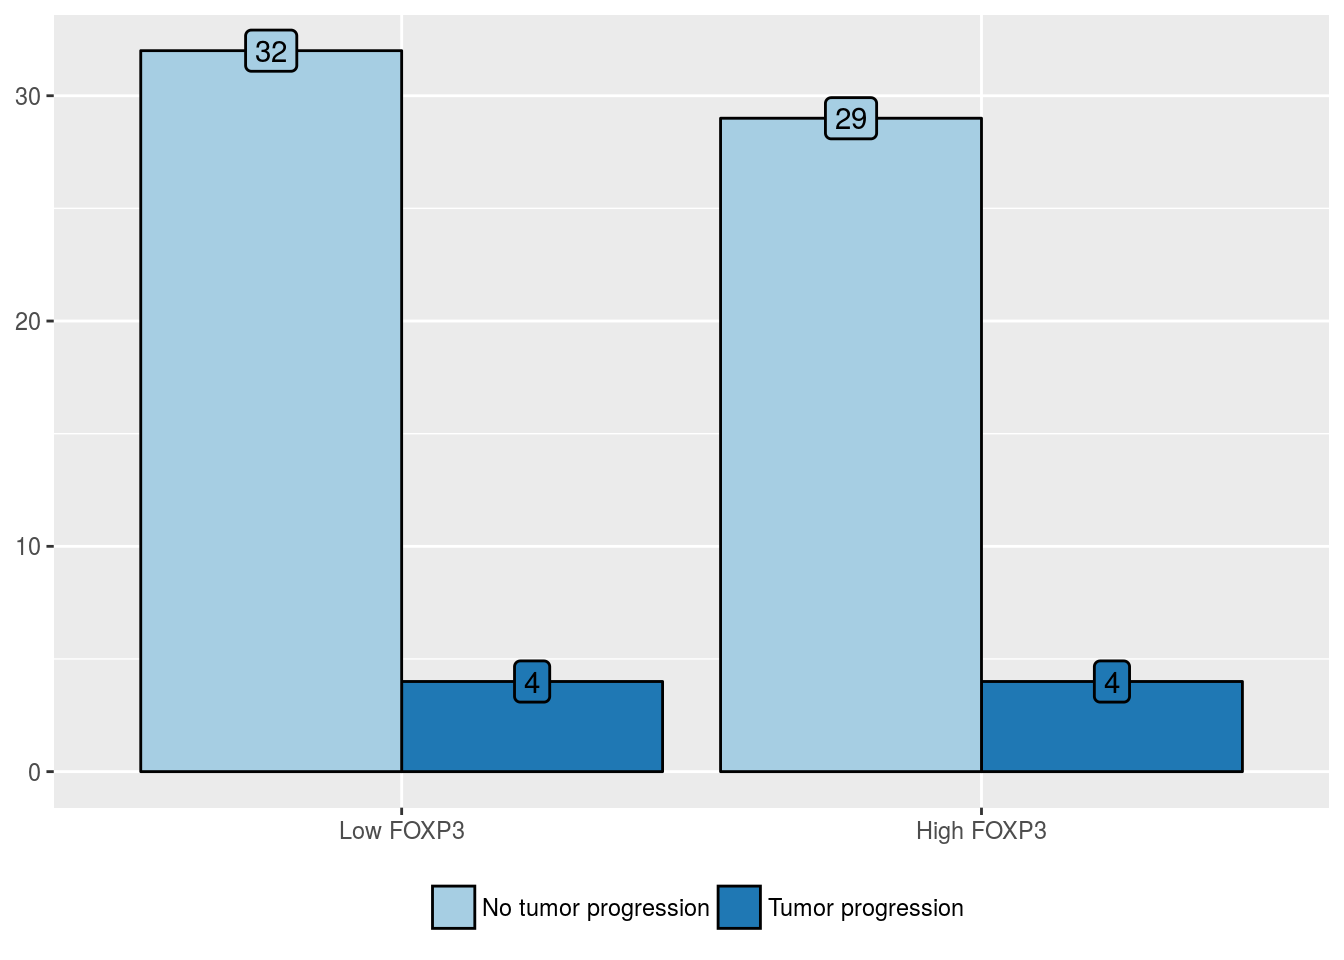
Tumor progression
FOXP3 positivity in intratumoral lymphocytes
| No tumor progression (%) | Tumor progression (%) | |
|---|---|---|
| Low FOXP3 | 32 (52.5) | 4 (50) |
| High FOXP3 | 29 (47.5) | 4 (50) |
| Predictors | Odds Ratio (95% CI) | P value | Hazard Ratio (95% CI) | P value |
|---|---|---|---|---|
| High FOXP3 positivity in intratumoral lymphocytes | 1.10 (0.24, 5.05) | 0.9 | 0.97 (0.24, 3.89) | 0.97 |
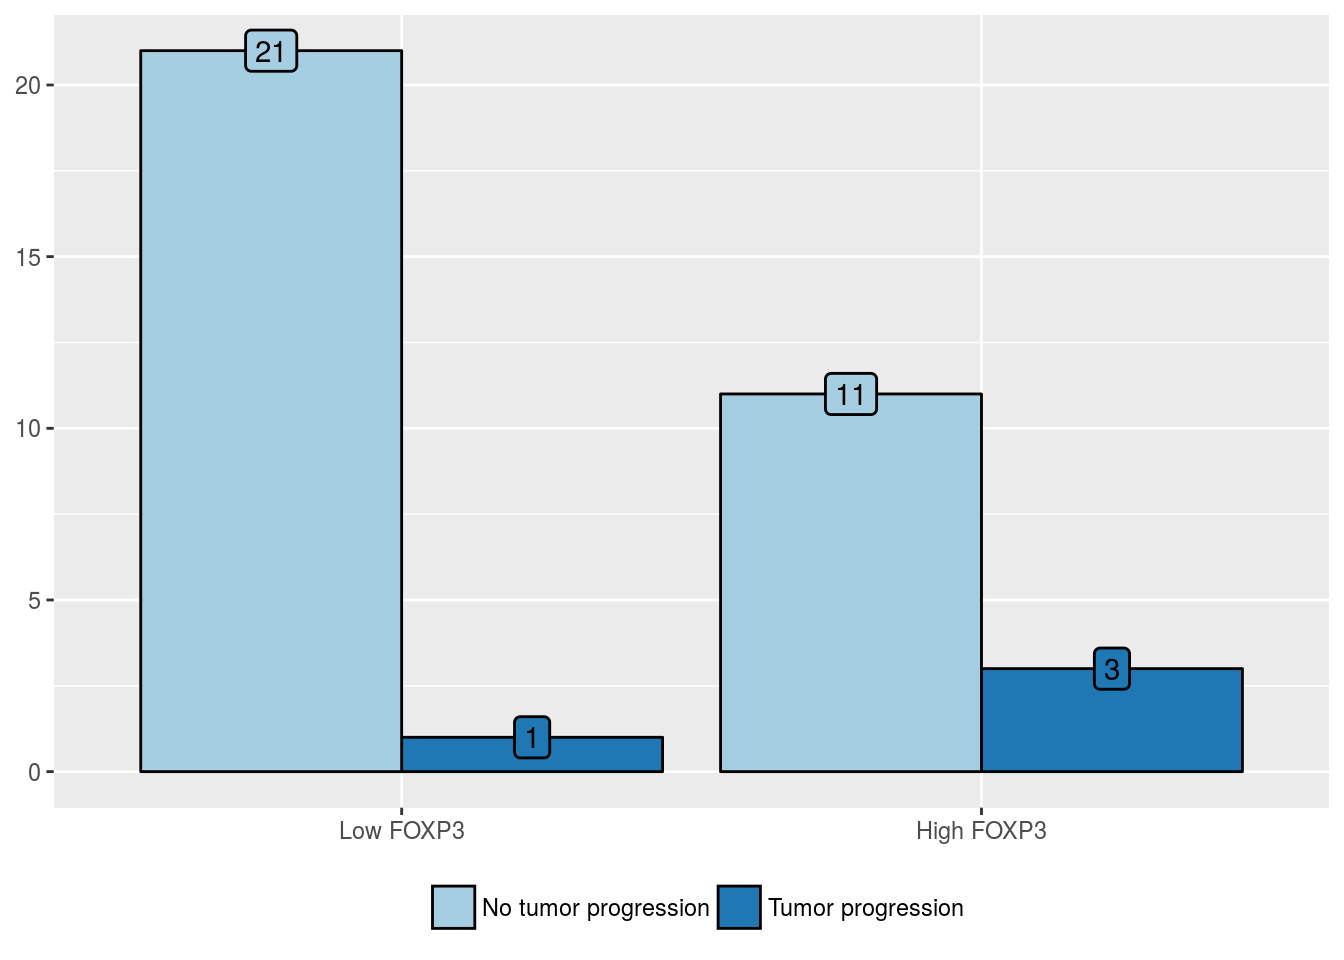
FOXP3 positivity in stromal lymphocytes
| No tumor progression (%) | Tumor progression (%) | |
|---|---|---|
| Low FOXP3 | 21 (65.6) | 1 (25) |
| High FOXP3 | 11 (34.4) | 3 (75) |
| Predictors | Odds Ratio (95% CI) | P value | Hazard Ratio (95% CI) | P value |
|---|---|---|---|---|
| High FOXP3 positivity in stromal lymphocytes | 5.73 (0.65, 123.64) | 0.15 | 3.92 (0.41, 37.91) | 0.2 |
FOXP3 positivity in tumor cells
| No tumor progression (%) | Tumor progression (%) | |
|---|---|---|
| Low FOXP3 | 1 (100) | 0 (NaN) |
| High FOXP3 | 0 (0) | 0 (NaN) |
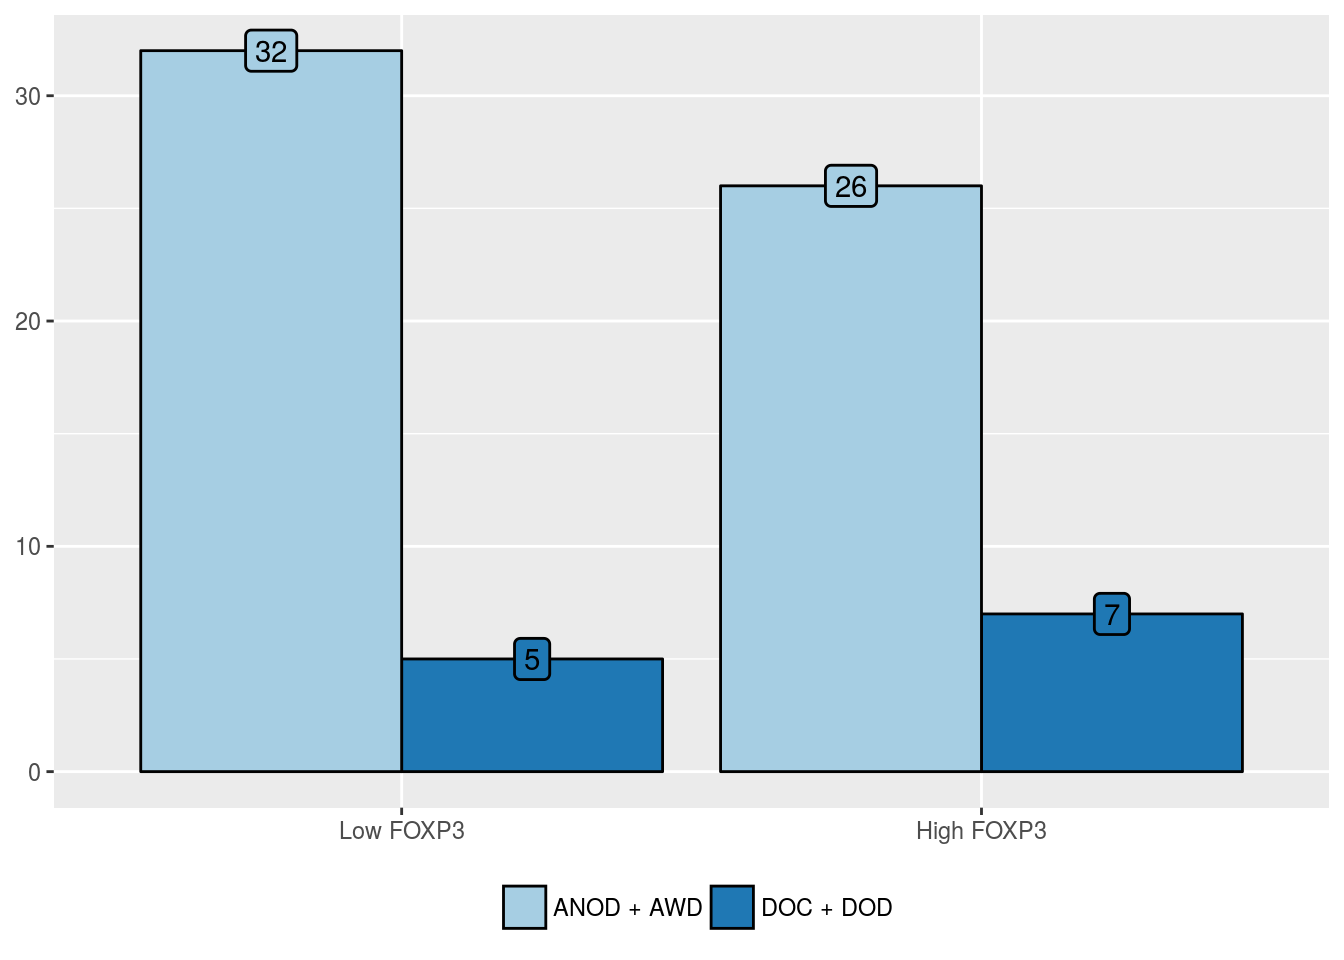
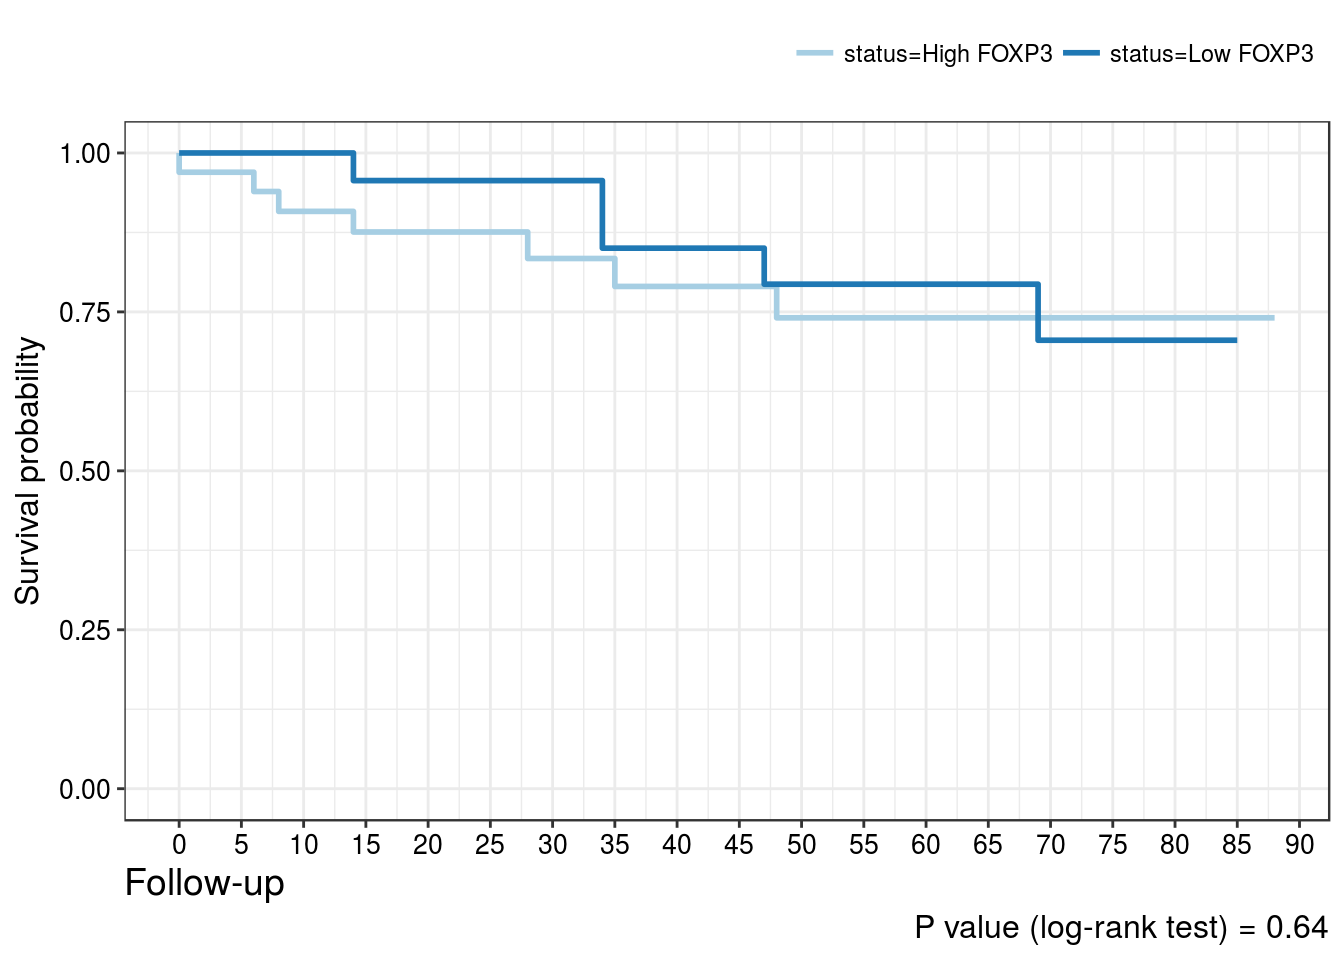
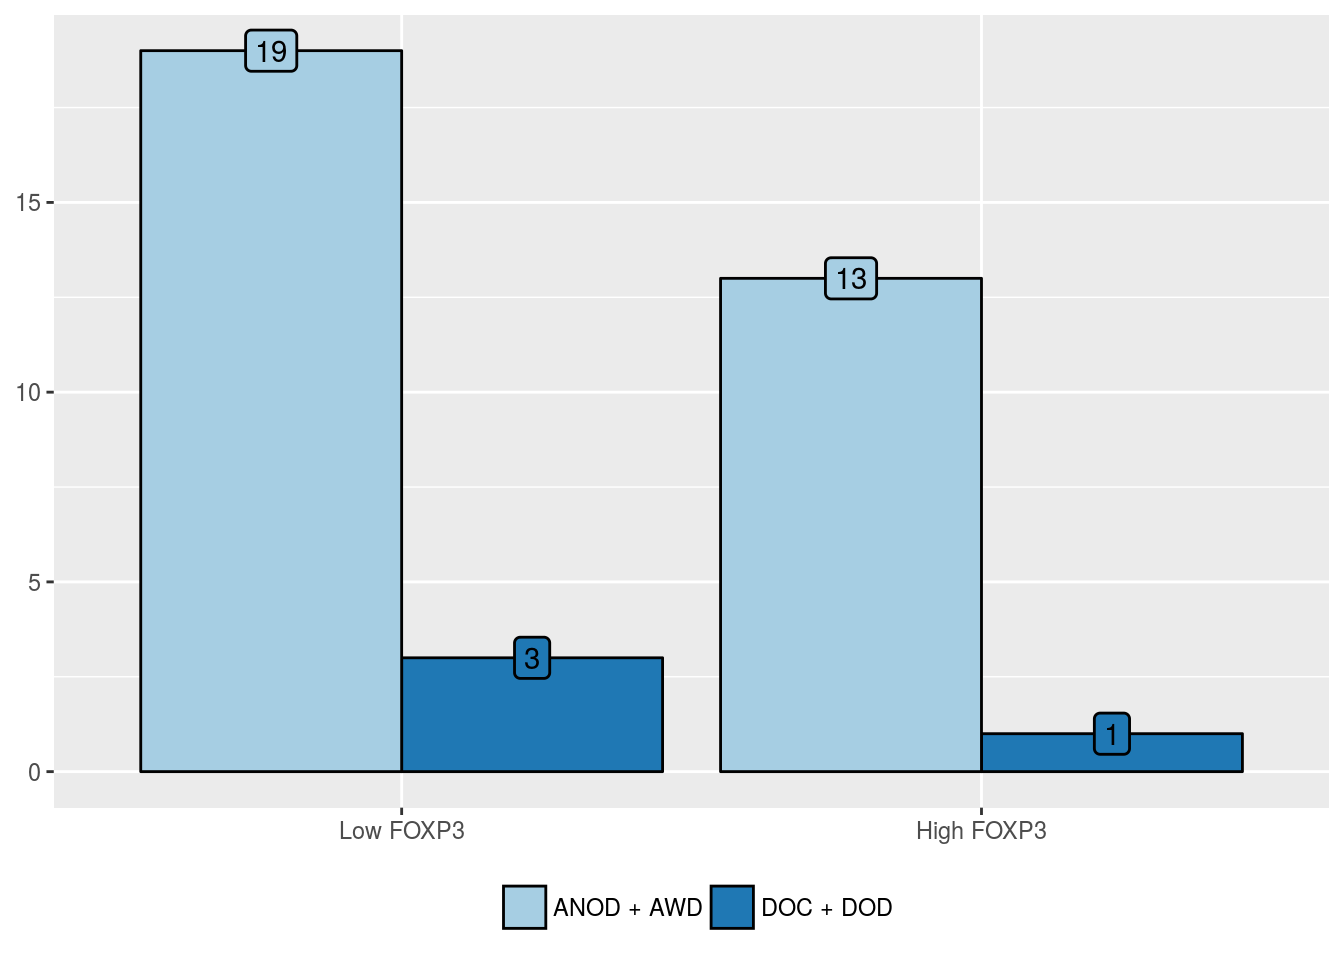
Overall mortality
FOXP3 positivity in intratumoral lymphocytes
| ANOD + AWD (%) | DOC + DOD (%) | |
|---|---|---|
| Low FOXP3 | 32 (55.2) | 5 (41.7) |
| High FOXP3 | 26 (44.8) | 7 (58.3) |
| Predictors | Odds Ratio (95% CI) | P value | Hazard Ratio (95% CI) | P value |
|---|---|---|---|---|
| High FOXP3 positivity in intratumoral lymphocytes | 1.72 (0.49, 6.43) | 0.4 | 1.31 (0.41, 4.13) | 0.64 |
FOXP3 positivity in stromal lymphocytes
| ANOD + AWD (%) | DOC + DOD (%) | |
|---|---|---|
| Low FOXP3 | 19 (59.4) | 3 (75) |
| High FOXP3 | 13 (40.6) | 1 (25) |
| Predictors | Odds Ratio (95% CI) | P value | Hazard Ratio (95% CI) | P value |
|---|---|---|---|---|
| High FOXP3 positivity in stromal lymphocytes | 0.49 (0.023, 4.30) | 0.55 | 0.42 (0.043, 4.03) | 0.42 |
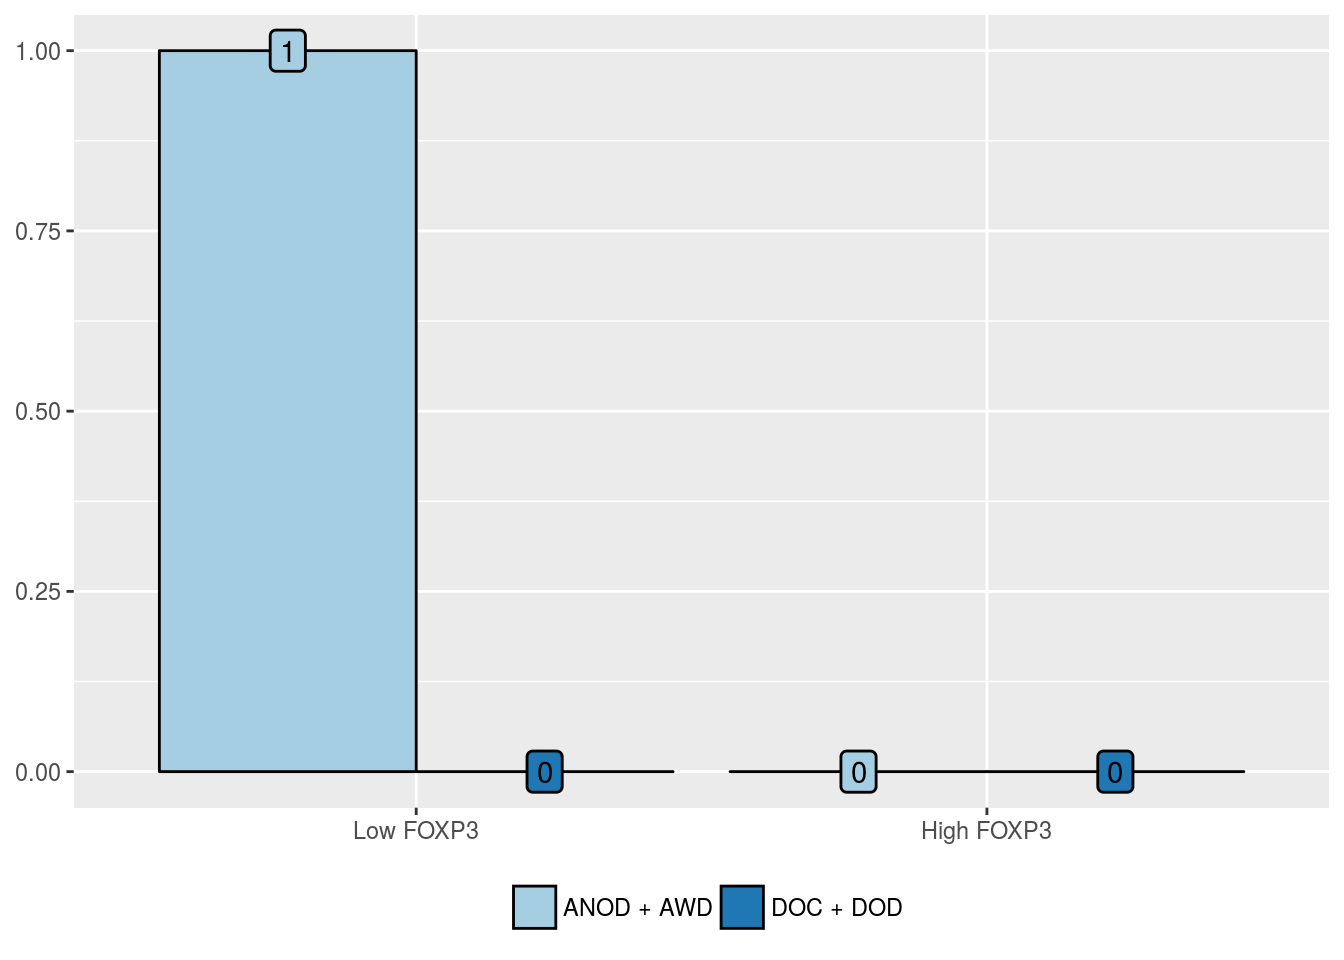
FOXP3 positivity in tumor cells
| ANOD + AWD (%) | DOC + DOD (%) | |
|---|---|---|
| Low FOXP3 | 1 (100) | 0 (NaN) |
| High FOXP3 | 0 (0) | 0 (NaN) |
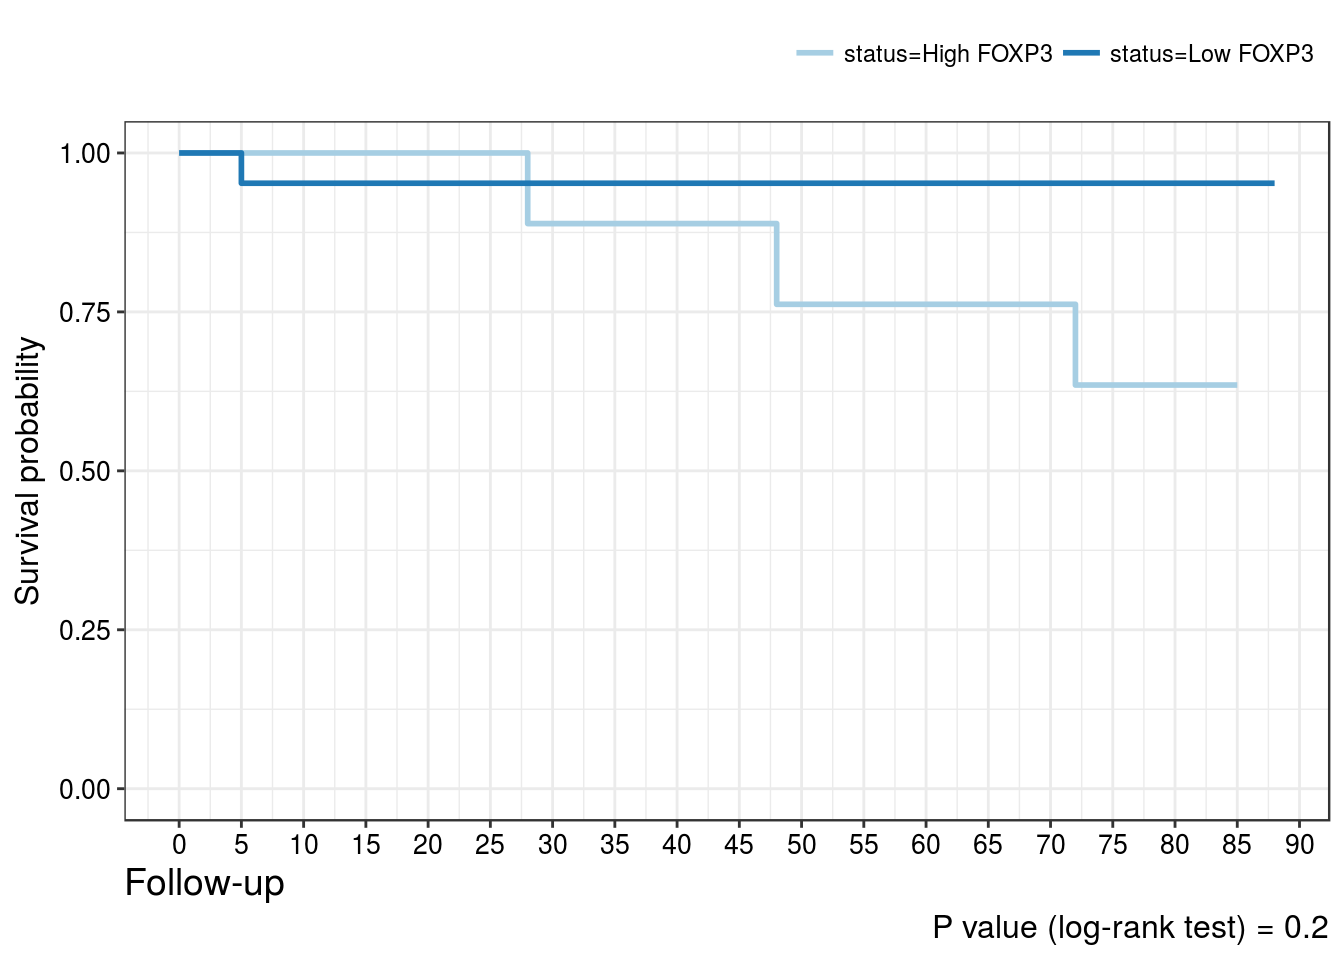
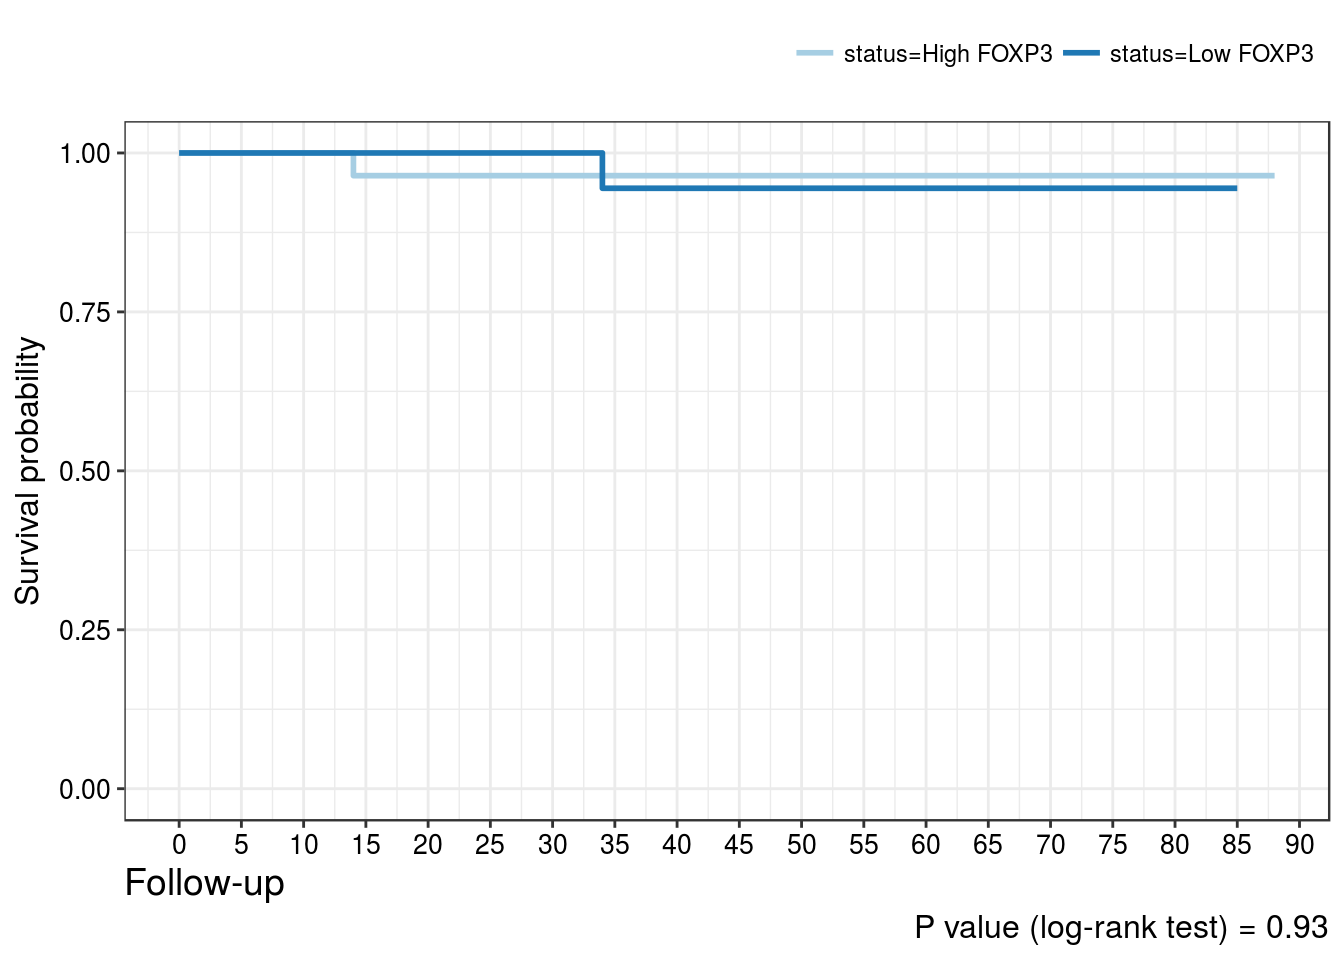
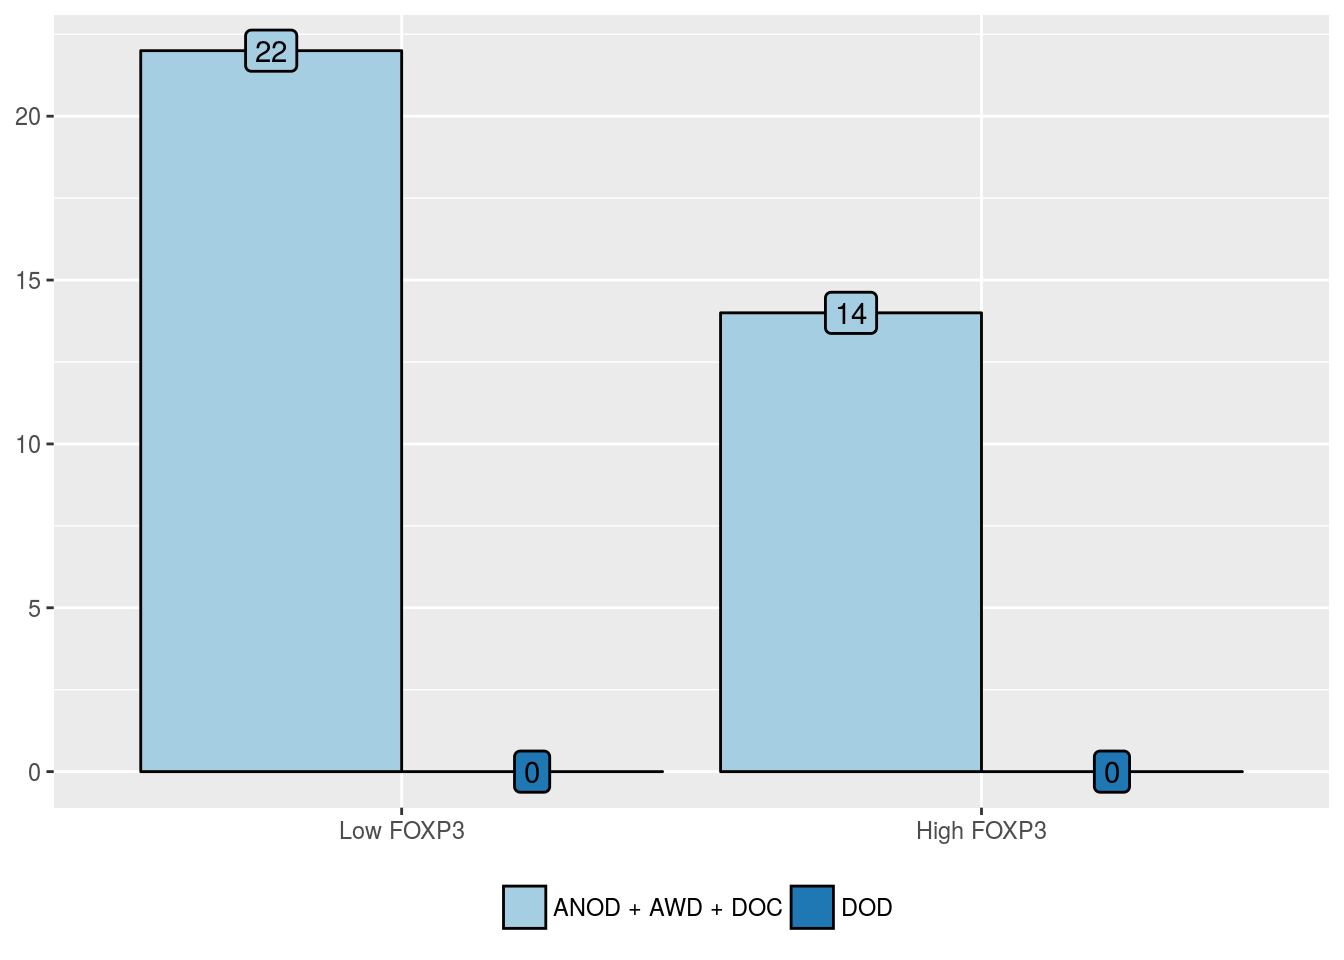
Cancer-related mortality
FOXP3 positivity in intratumoral lymphocytes
| ANOD + AWD + DOC (%) | DOD (%) | |
|---|---|---|
| Low FOXP3 | 36 (52.9) | 1 (50) |
| High FOXP3 | 32 (47.1) | 1 (50) |
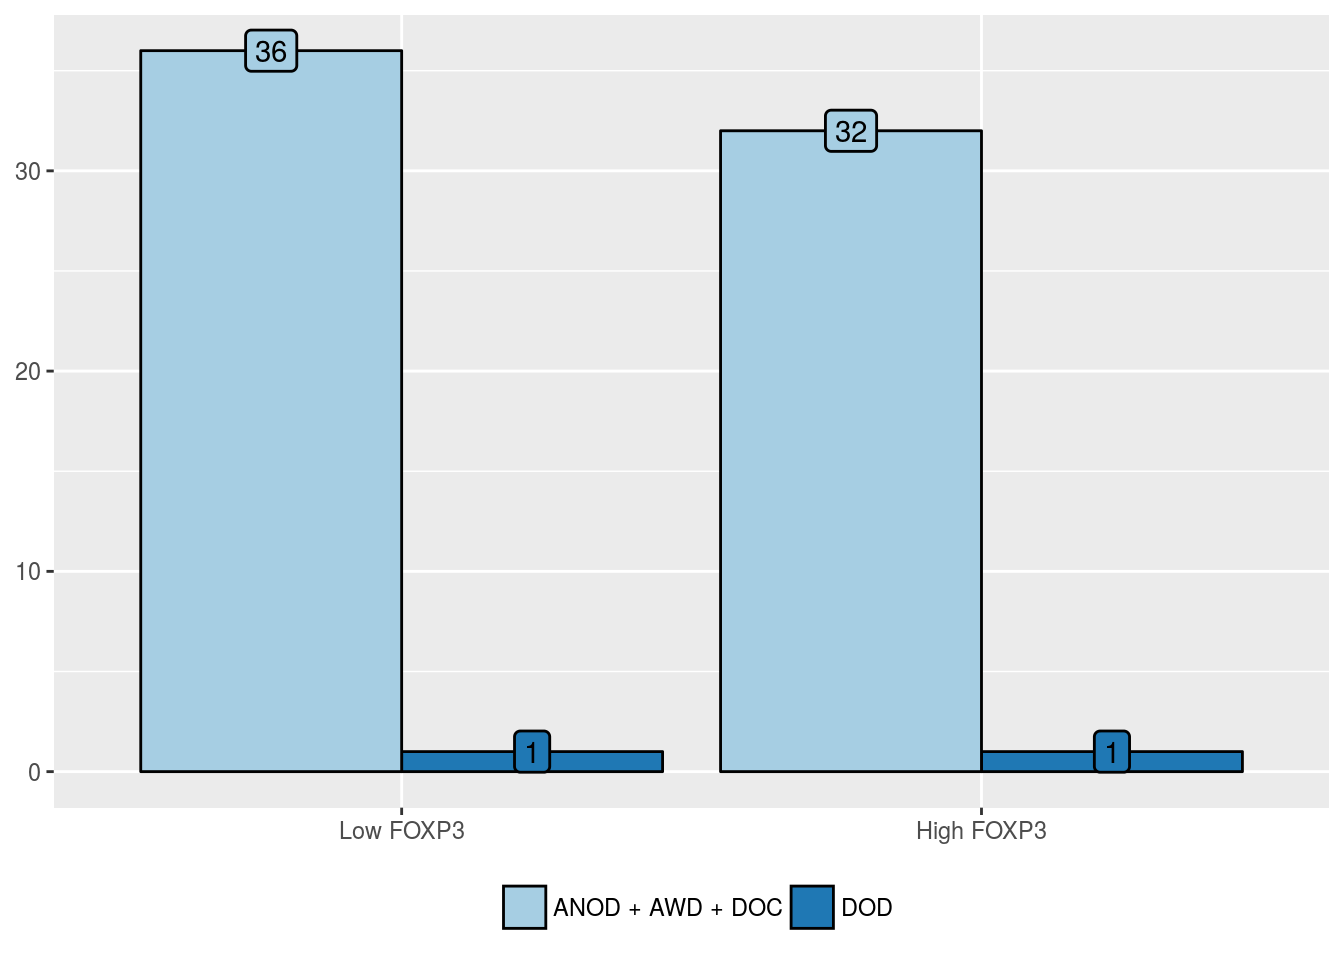
| Predictors | Odds Ratio (95% CI) | P value | Hazard Ratio (95% CI) | P value |
|---|---|---|---|---|
| High FOXP3 positivity in intratumoral lymphocytes | 1.12 (0.043, 29.23) | 0.93 | 0.88 (0.055, 14.13) | 0.93 |
FOXP3 positivity in stromal lymphocytes
| ANOD + AWD + DOC (%) | DOD (%) | |
|---|---|---|
| Low FOXP3 | 22 (61.1) | 0 (NaN) |
| High FOXP3 | 14 (38.9) | 0 (NaN) |
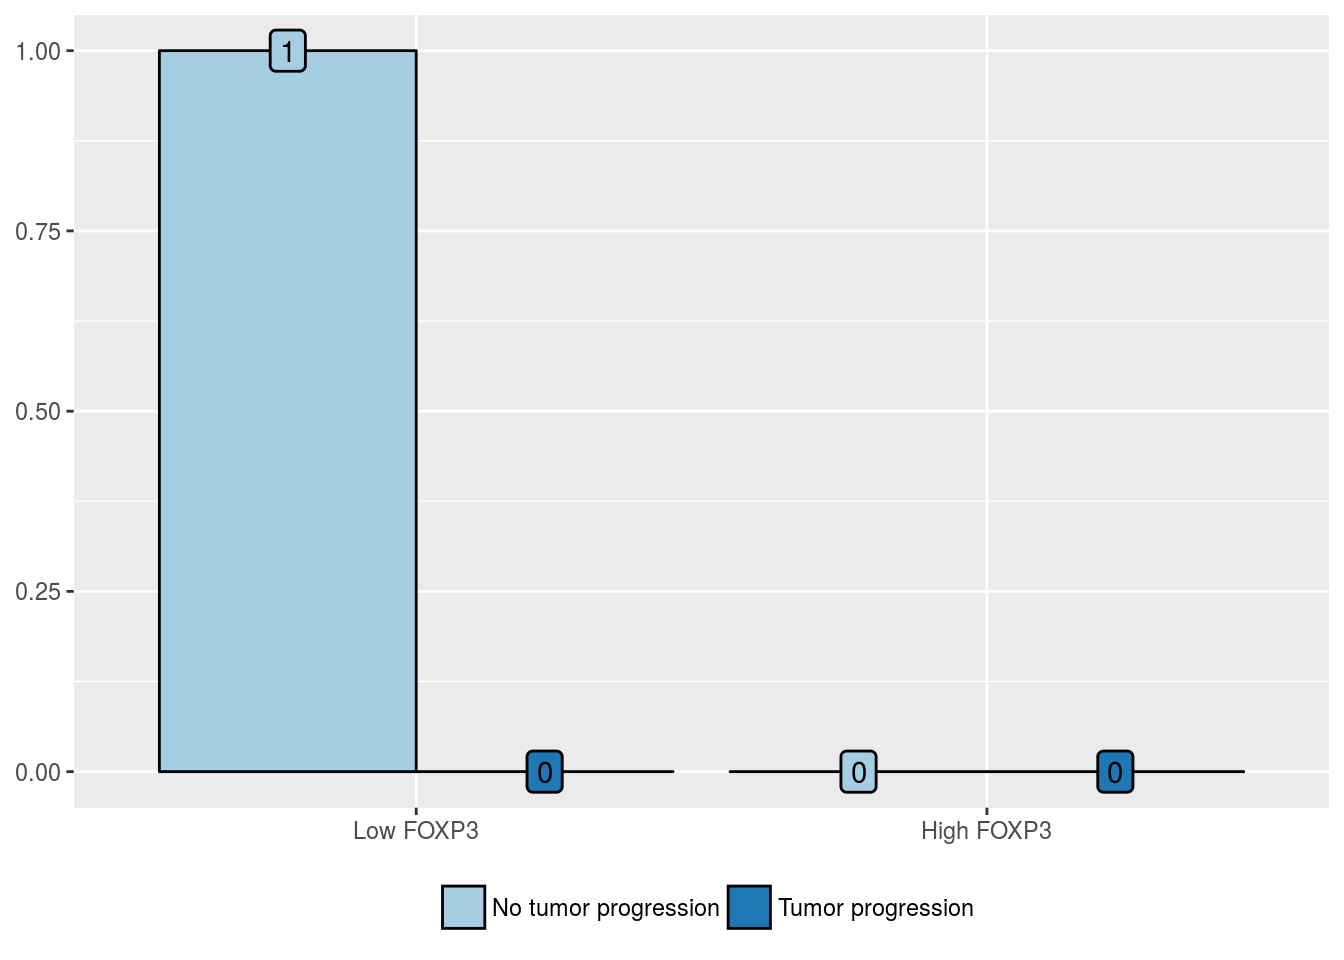
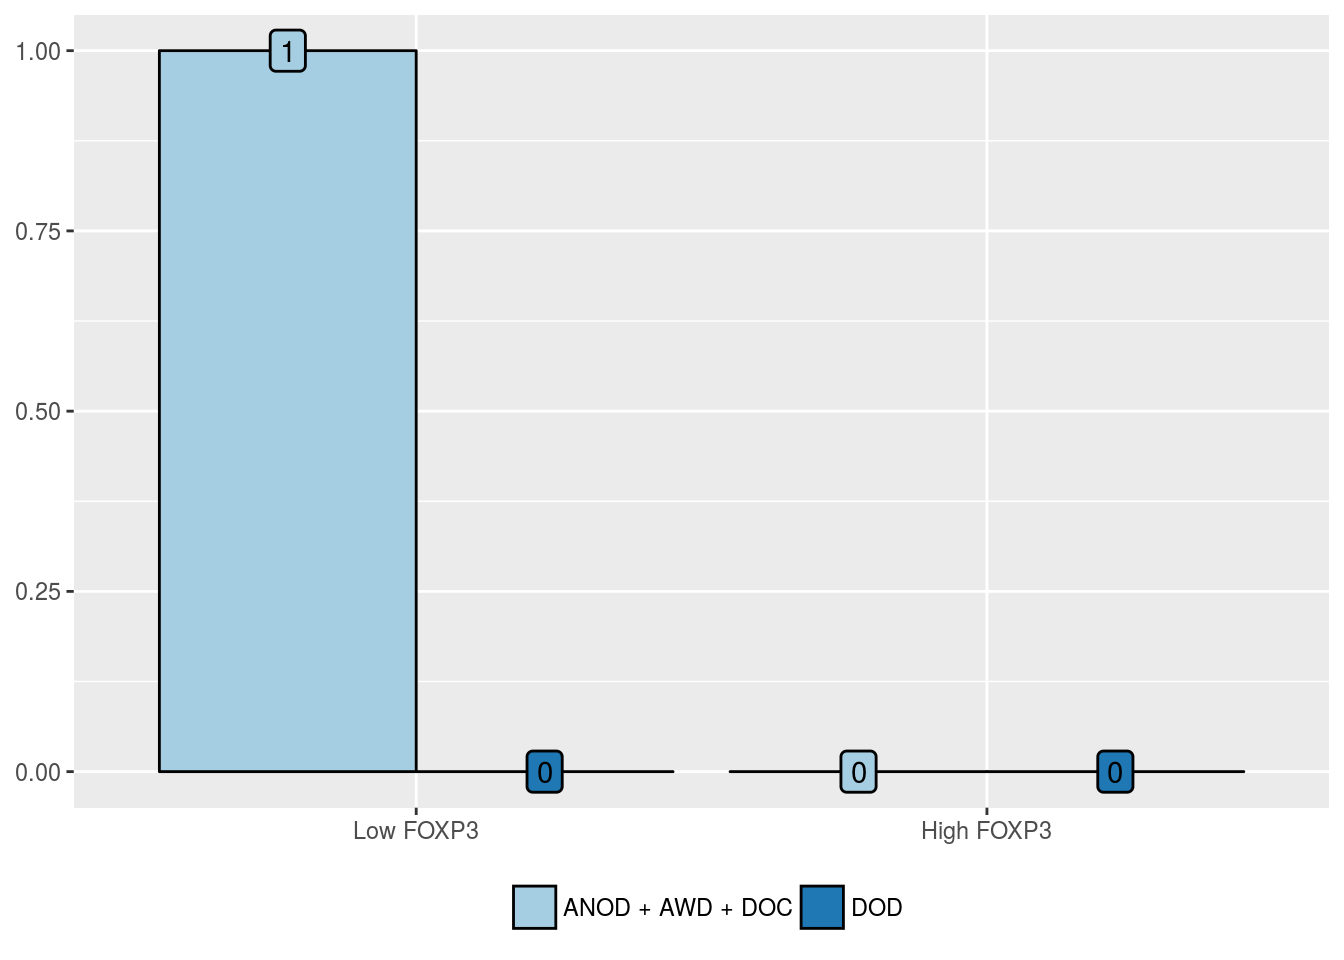
FOXP3 positivity in tumor cells
| ANOD + AWD + DOC (%) | DOD (%) | |
|---|---|---|
| Low FOXP3 | 1 (100) | 0 (NaN) |
| High FOXP3 | 0 (0) | 0 (NaN) |
CD8 and Ki67 expression
Tumor progression
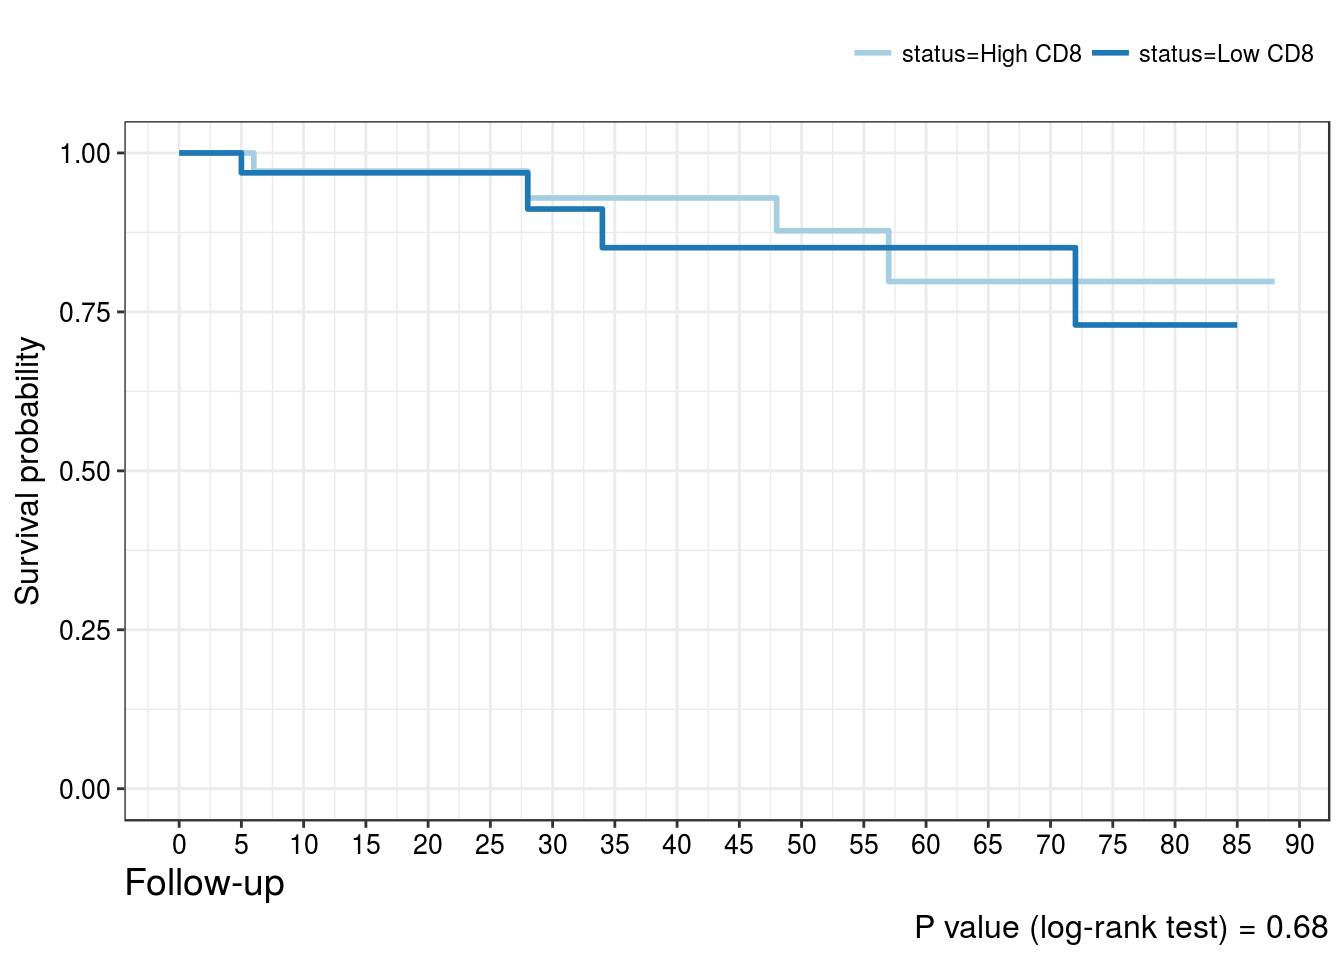
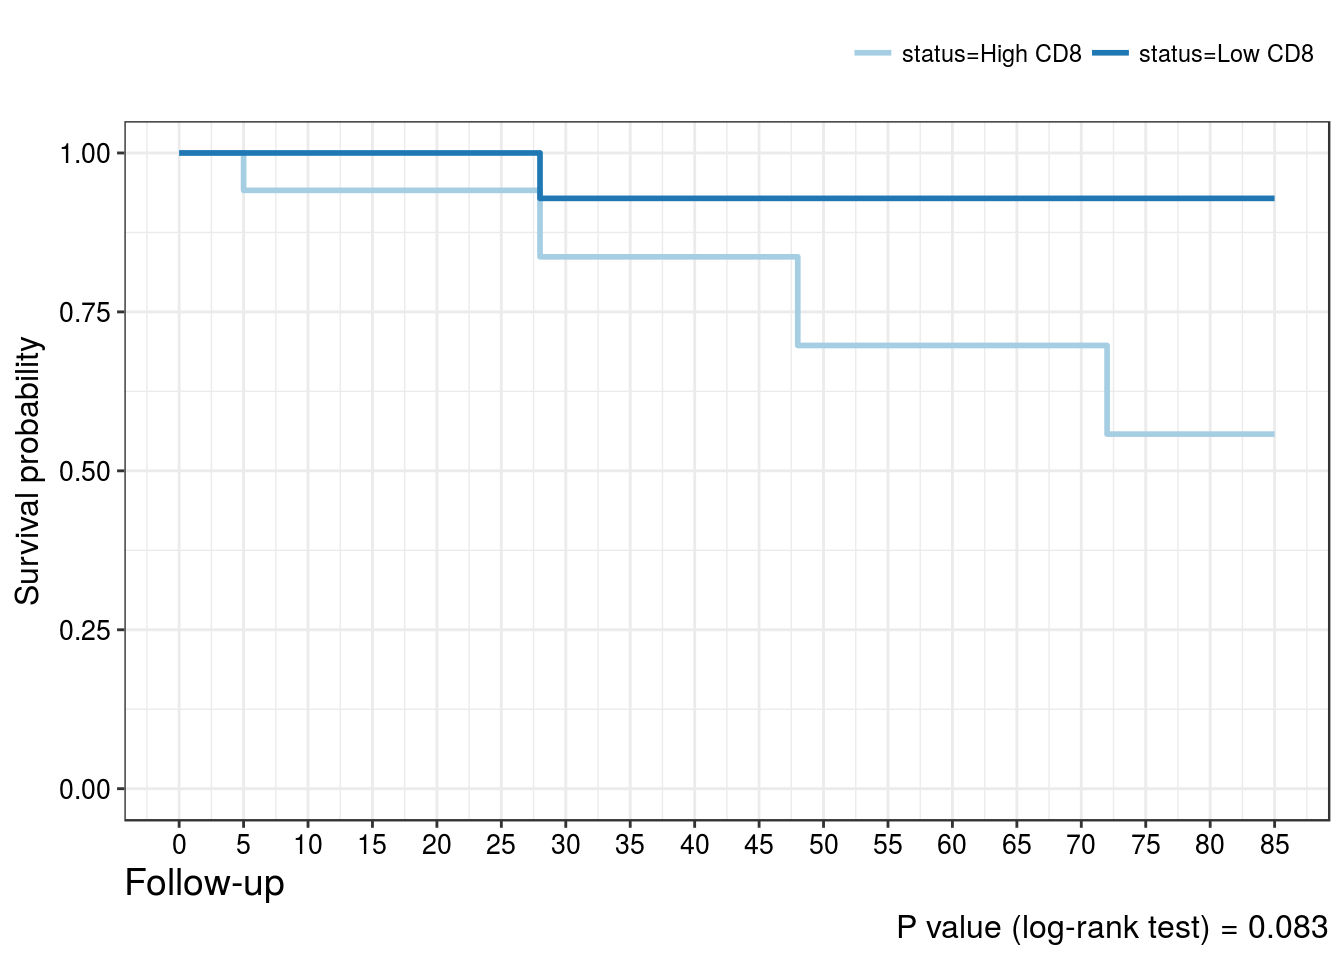
CD8 positivity in intratumoral lymphocytes
| No tumor progression (%) | Tumor progression (%) | |
|---|---|---|
| Low CD8 | 29 (47.5) | 4 (50) |
| High CD8 | 32 (52.5) | 4 (50) |
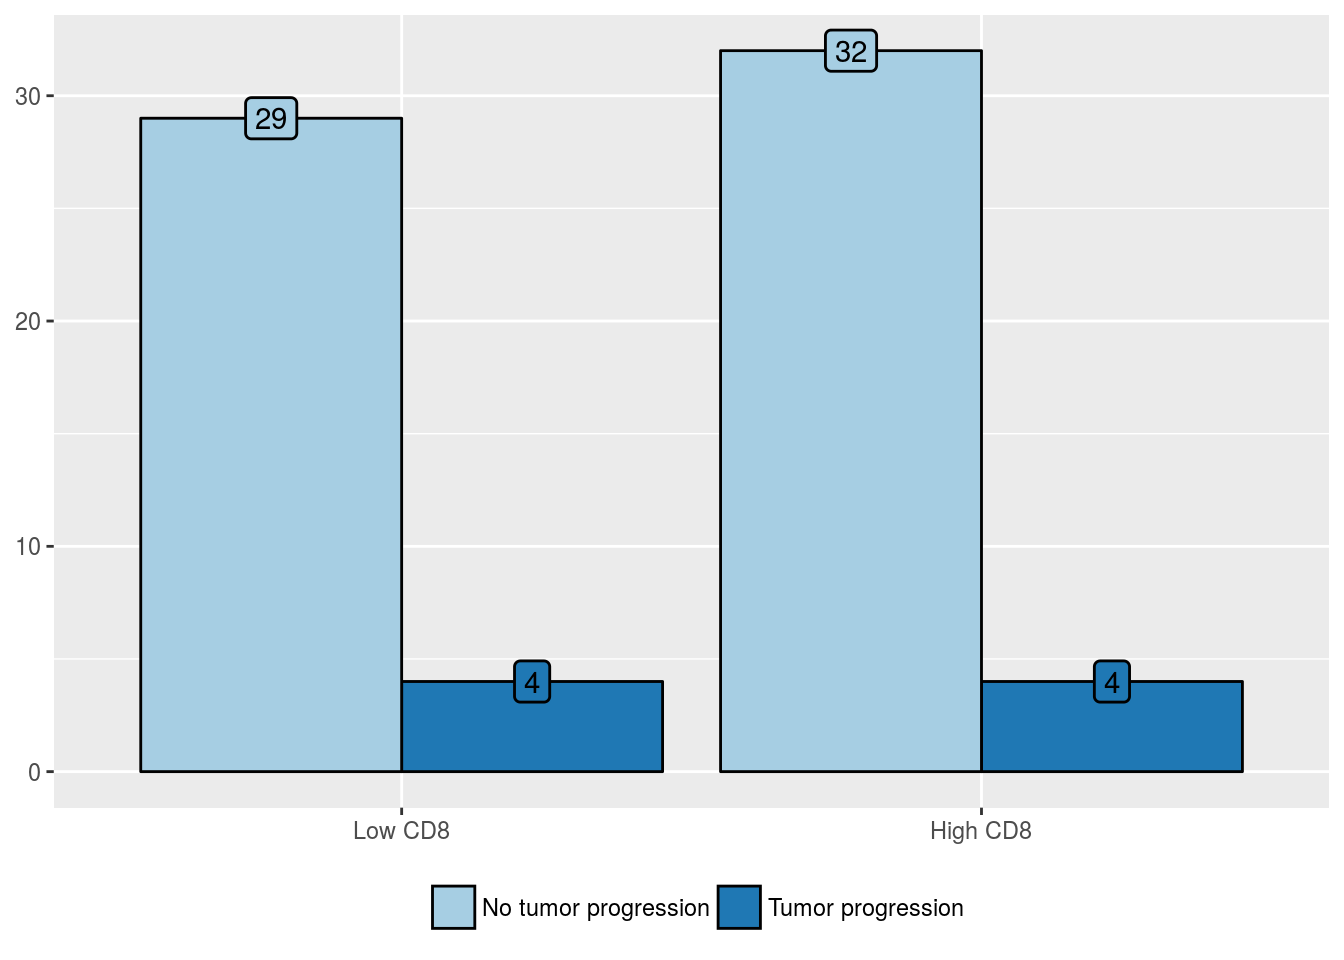
| Predictors | Odds Ratio (95% CI) | P value | Hazard Ratio (95% CI) | P value |
|---|---|---|---|---|
| High CD8 positivity in intratumoral lymphocytes | 0.91 (0.20, 4.15) | 0.9 | 0.75 (0.19, 3.00) | 0.68 |
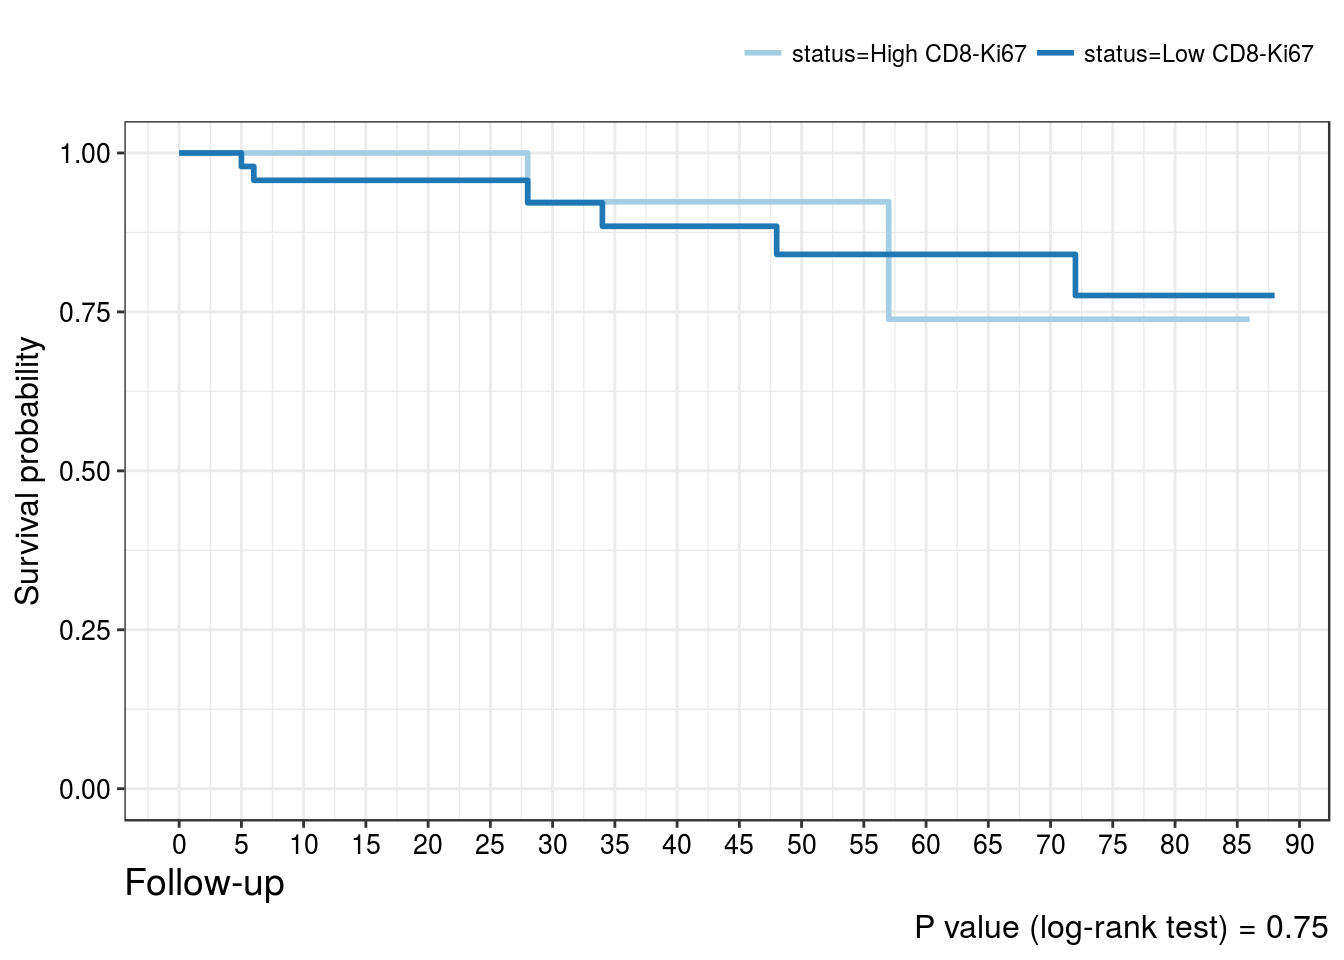
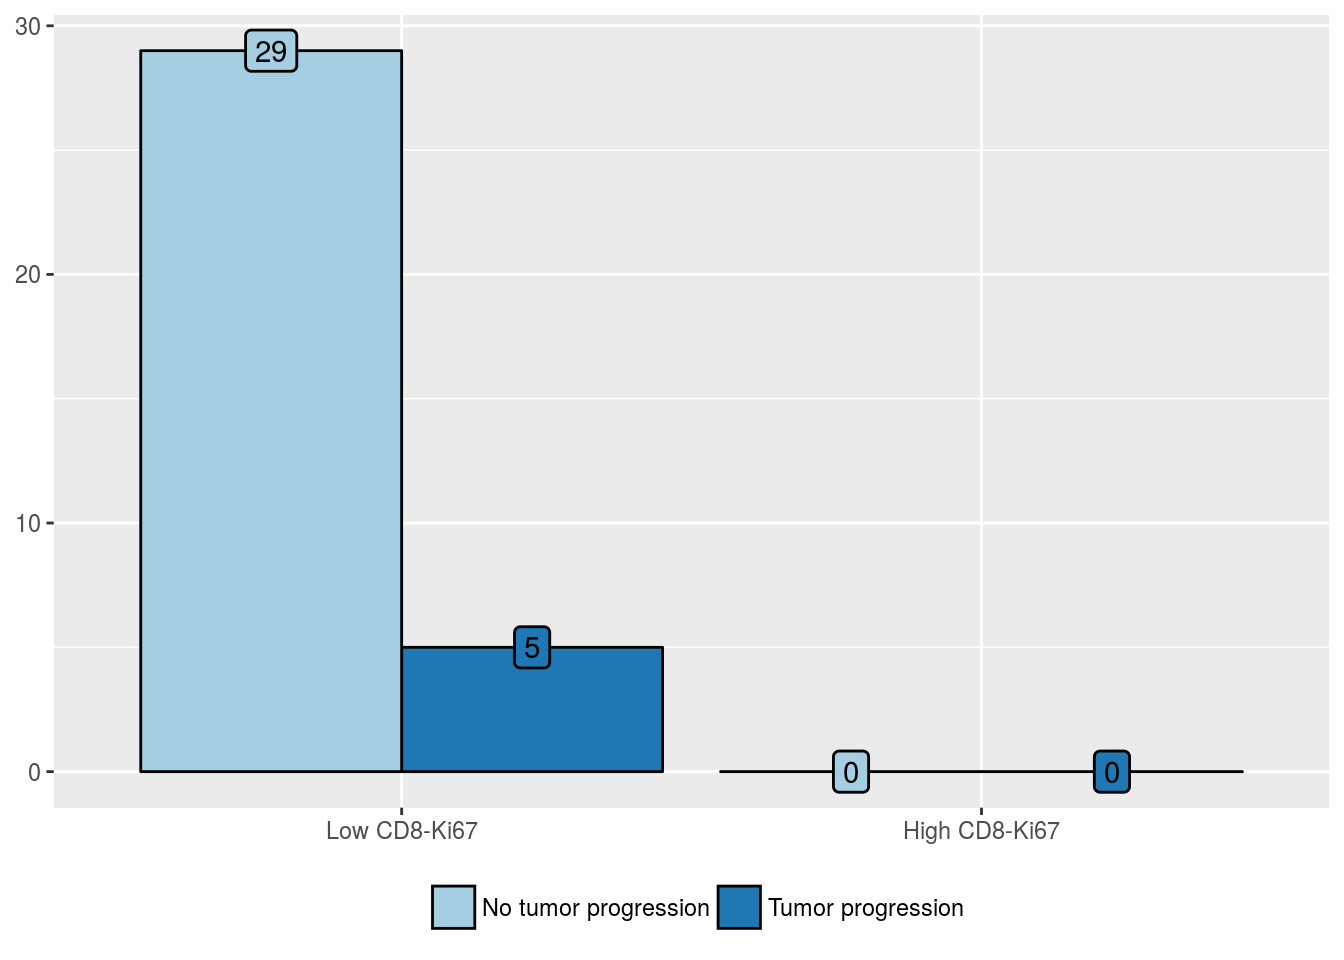
CD8-Ki67 positivity in intratumoral lymphocytes
| No tumor progression (%) | Tumor progression (%) | |
|---|---|---|
| Low CD8-Ki67 | 43 (70.5) | 6 (75) |
| High CD8-Ki67 | 18 (29.5) | 2 (25) |
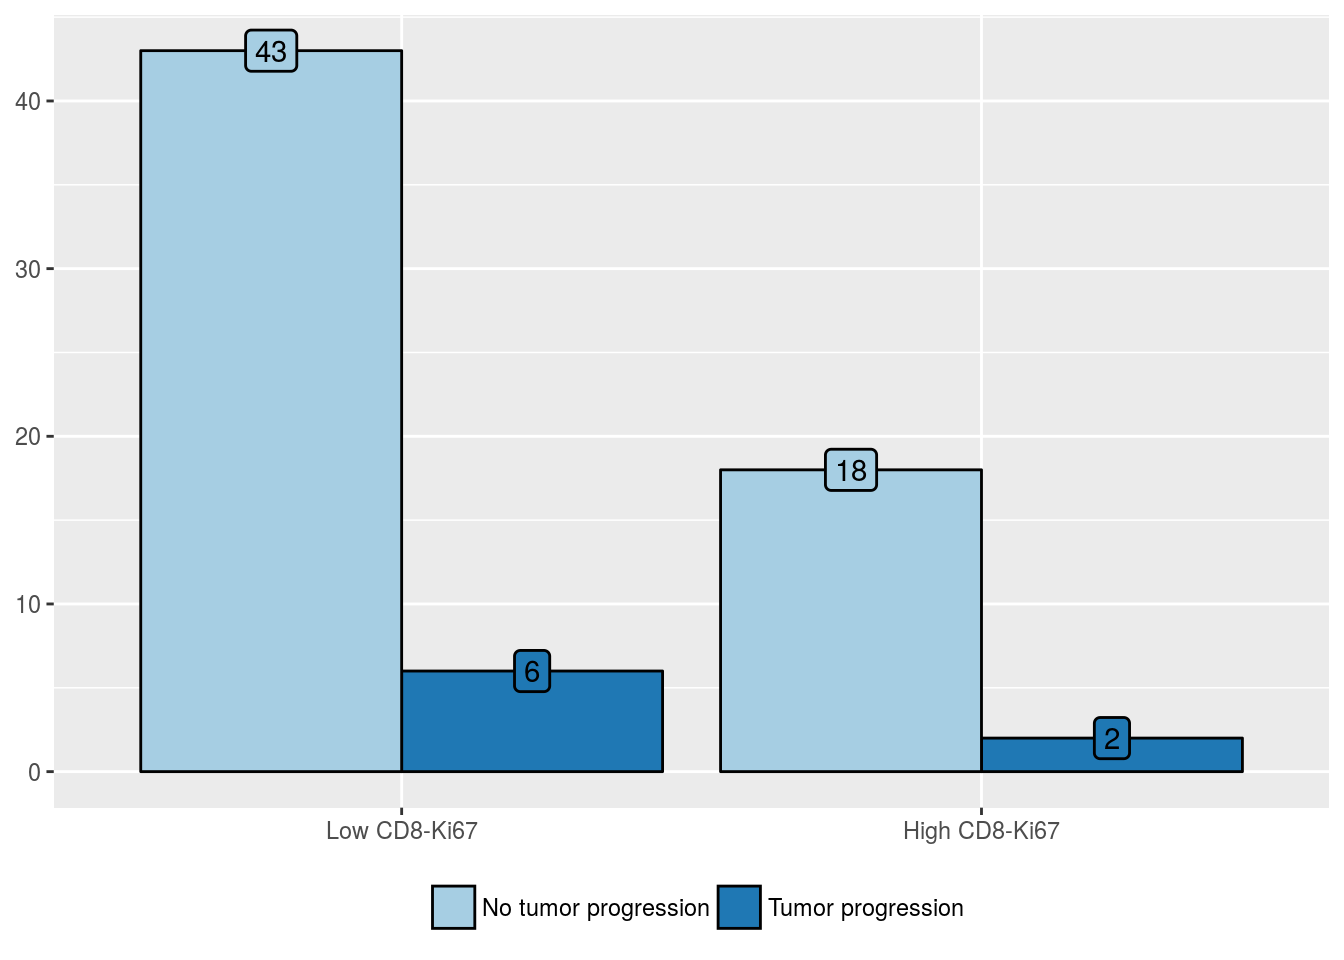
| Predictors | Odds Ratio (95% CI) | P value | Hazard Ratio (95% CI) | P value |
|---|---|---|---|---|
| High CD8-Ki67 positivity in intratumoral lymphocytes | 0.80 (0.11, 3.85) | 0.79 | 0.77 (0.16, 3.84) | 0.75 |
CD8 positivity in stromal lymphocytes
| No tumor progression (%) | Tumor progression (%) | |
|---|---|---|
| Low CD8 | 17 (56.7) | 1 (20) |
| High CD8 | 13 (43.3) | 4 (80) |
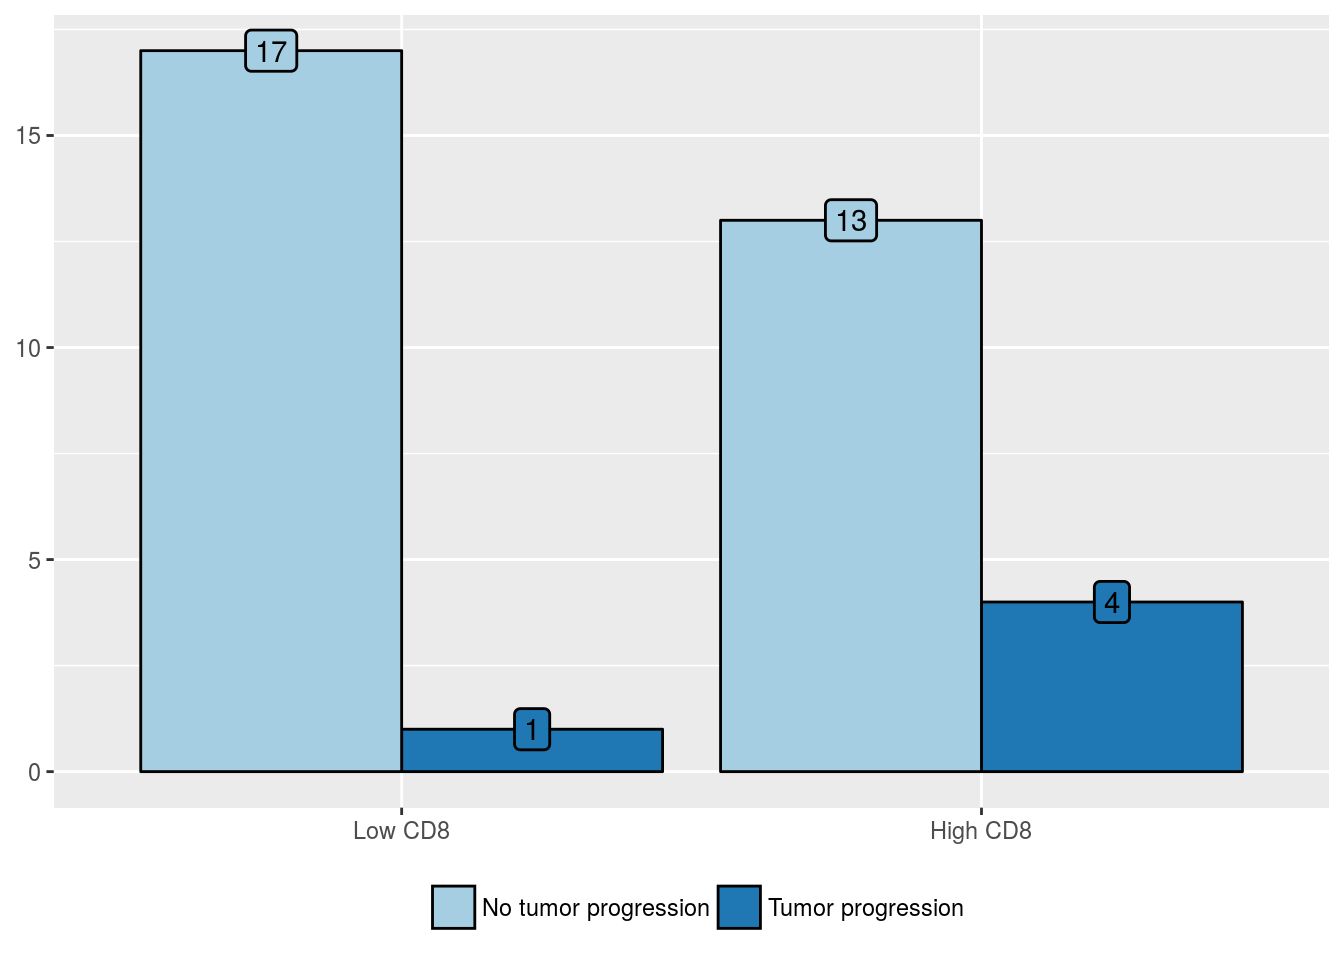
| Predictors | Odds Ratio (95% CI) | P value | Hazard Ratio (95% CI) | P value |
|---|---|---|---|---|
| High CD8 positivity in stromal lymphocytes | 5.23 (0.67, 109.01) | 0.16 | 5.57 (0.62, 50.14) | 0.082 |
CD8-Ki67 positivity in stromal lymphocytes
| No tumor progression (%) | Tumor progression (%) | |
|---|---|---|
| Low CD8-Ki67 | 29 (100) | 5 (100) |
| High CD8-Ki67 | 0 (0) | 0 (0) |
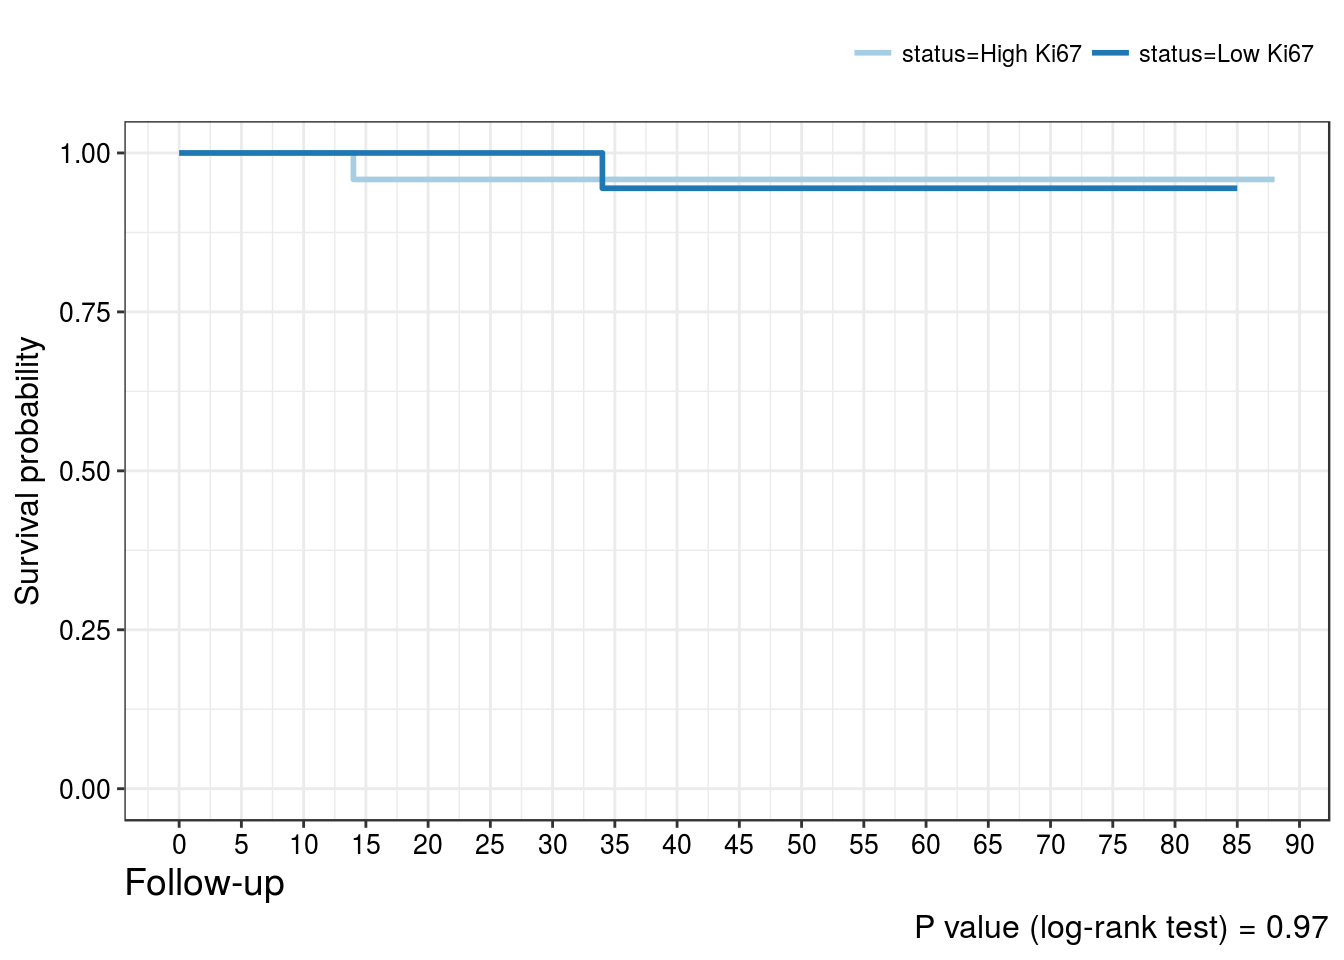
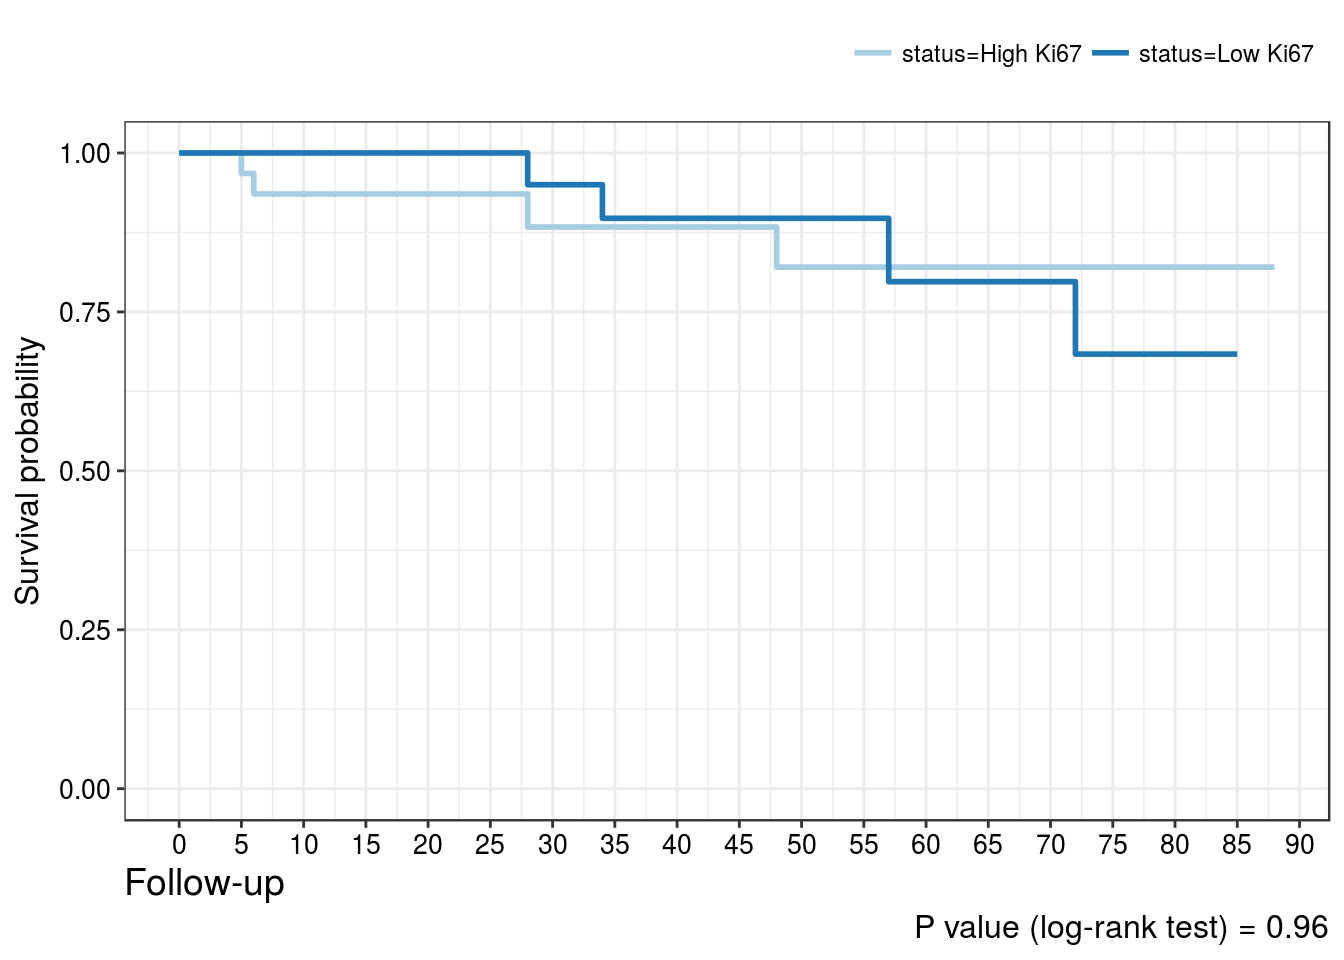
Ki67 positivity in intratumoral lymphocytes
| No tumor progression (%) | Tumor progression (%) | |
|---|---|---|
| Low Ki67 | 32 (54.2) | 4 (50) |
| High Ki67 | 27 (45.8) | 4 (50) |
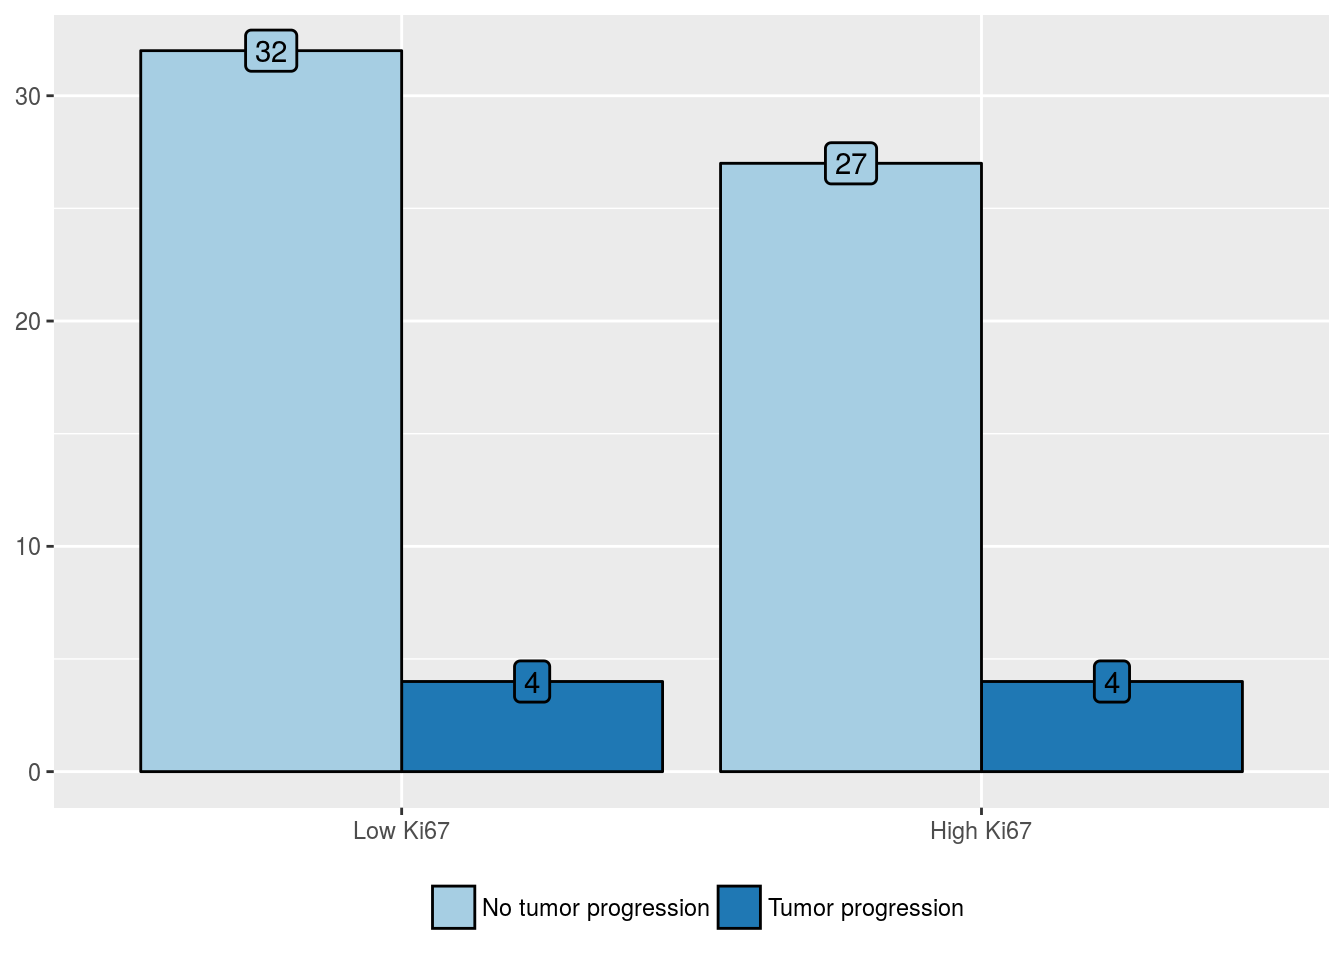
| Predictors | Odds Ratio (95% CI) | P value | Hazard Ratio (95% CI) | P value |
|---|---|---|---|---|
| High Ki67 positivity in intratumoral lymphocytes | 1.19 (0.26, 5.45) | 0.82 | 1.04 (0.26, 4.15) | 0.96 |
Overall mortality
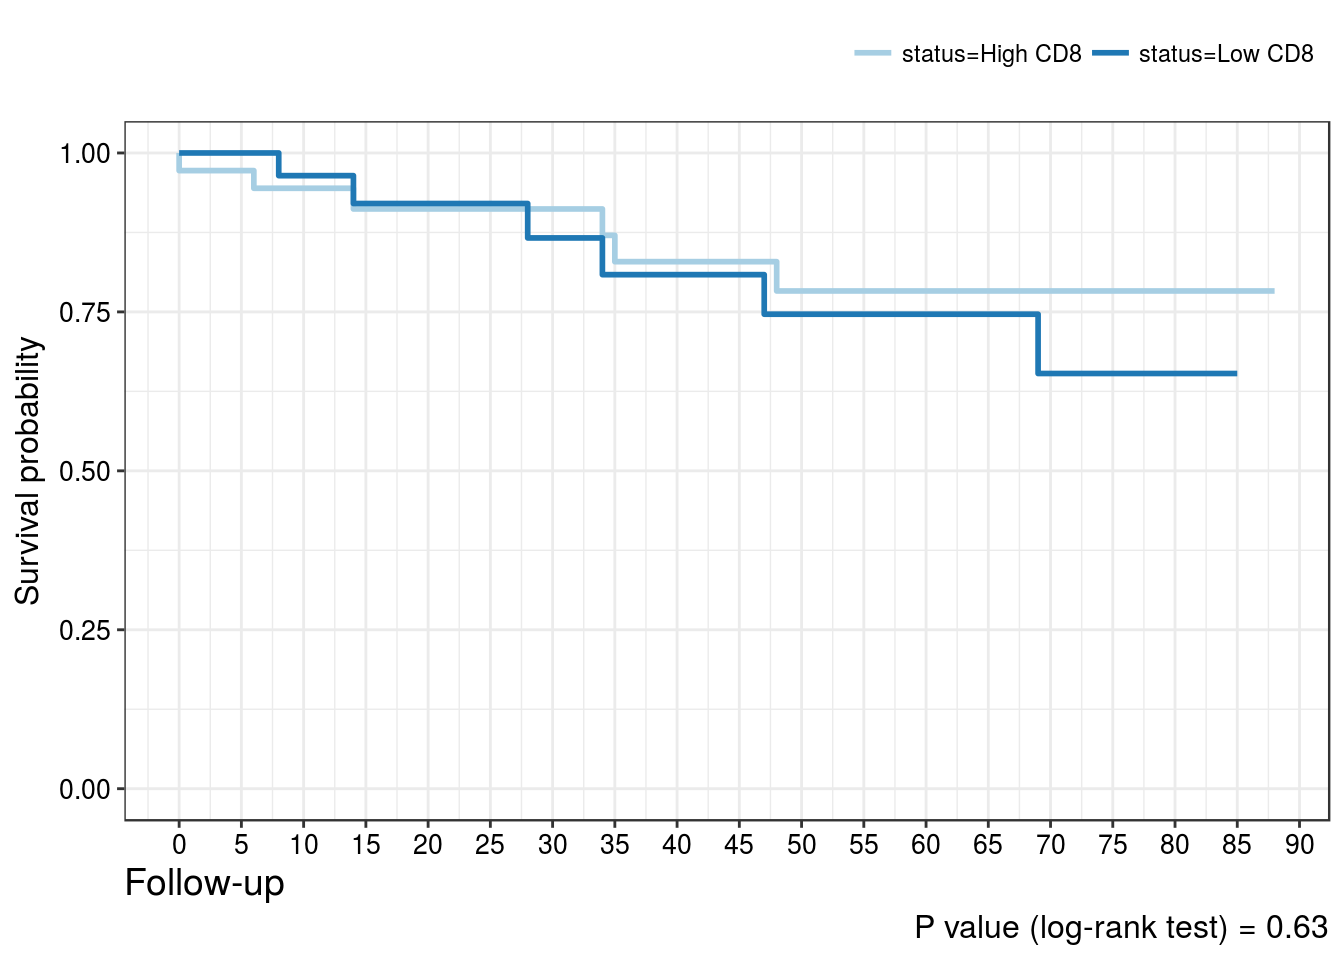
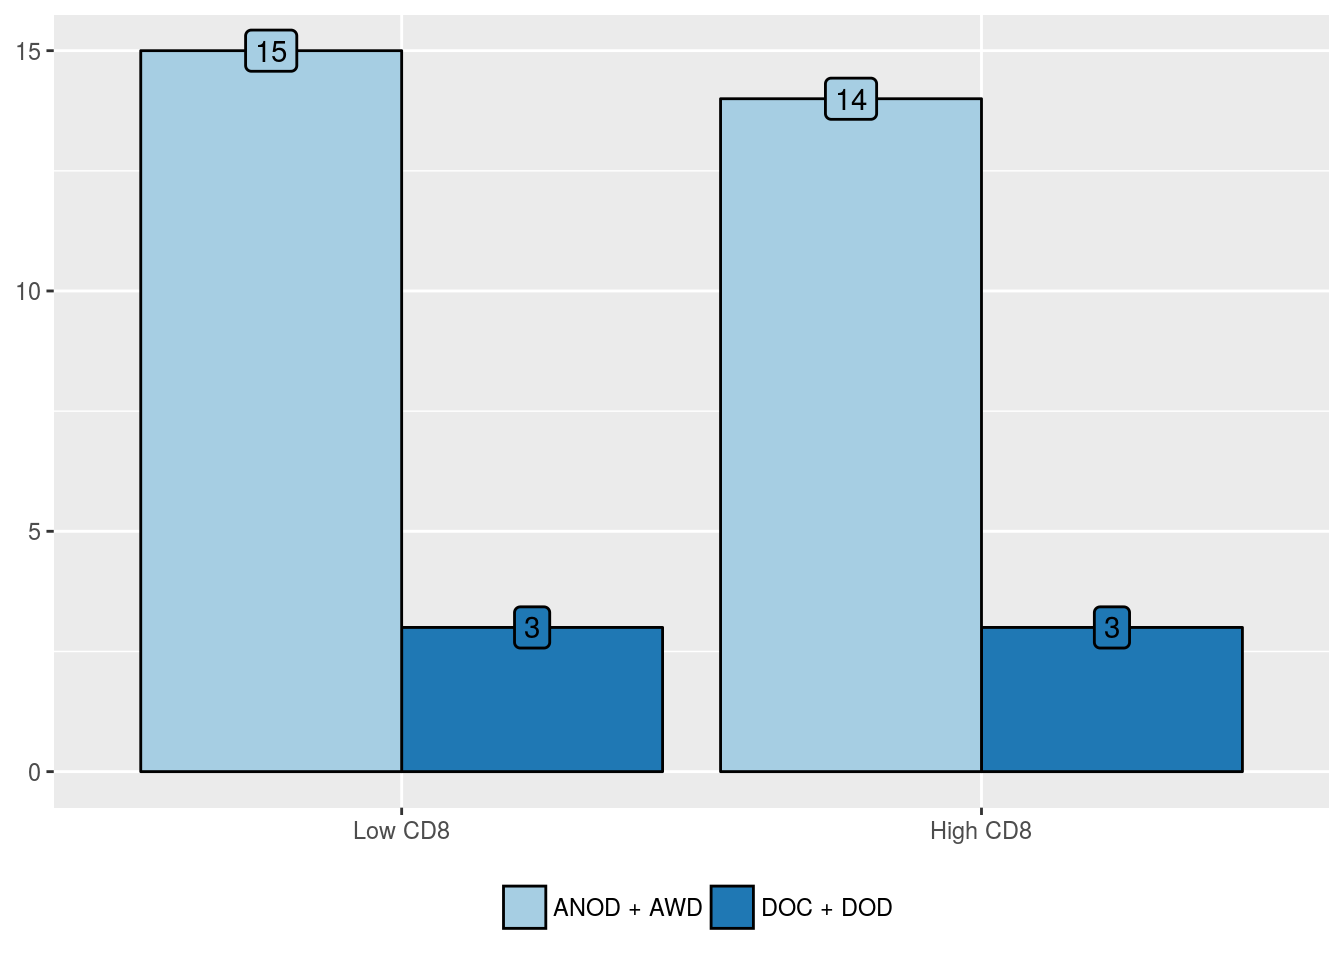
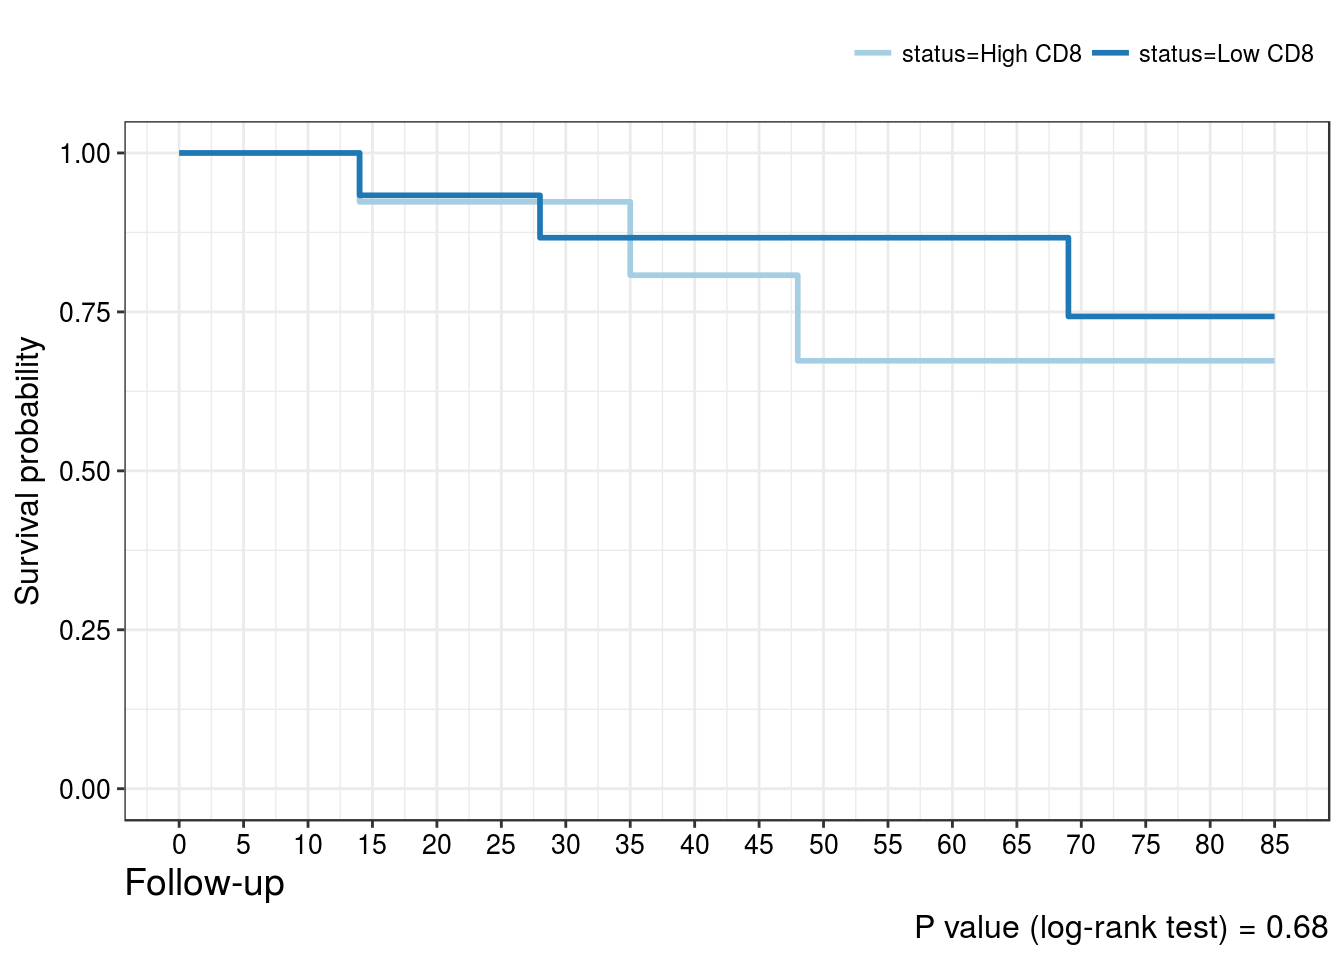
CD8 positivity in intratumoral lymphocytes
| ANOD + AWD (%) | DOC + DOD (%) | |
|---|---|---|
| Low CD8 | 28 (48.3) | 6 (50) |
| High CD8 | 30 (51.7) | 6 (50) |
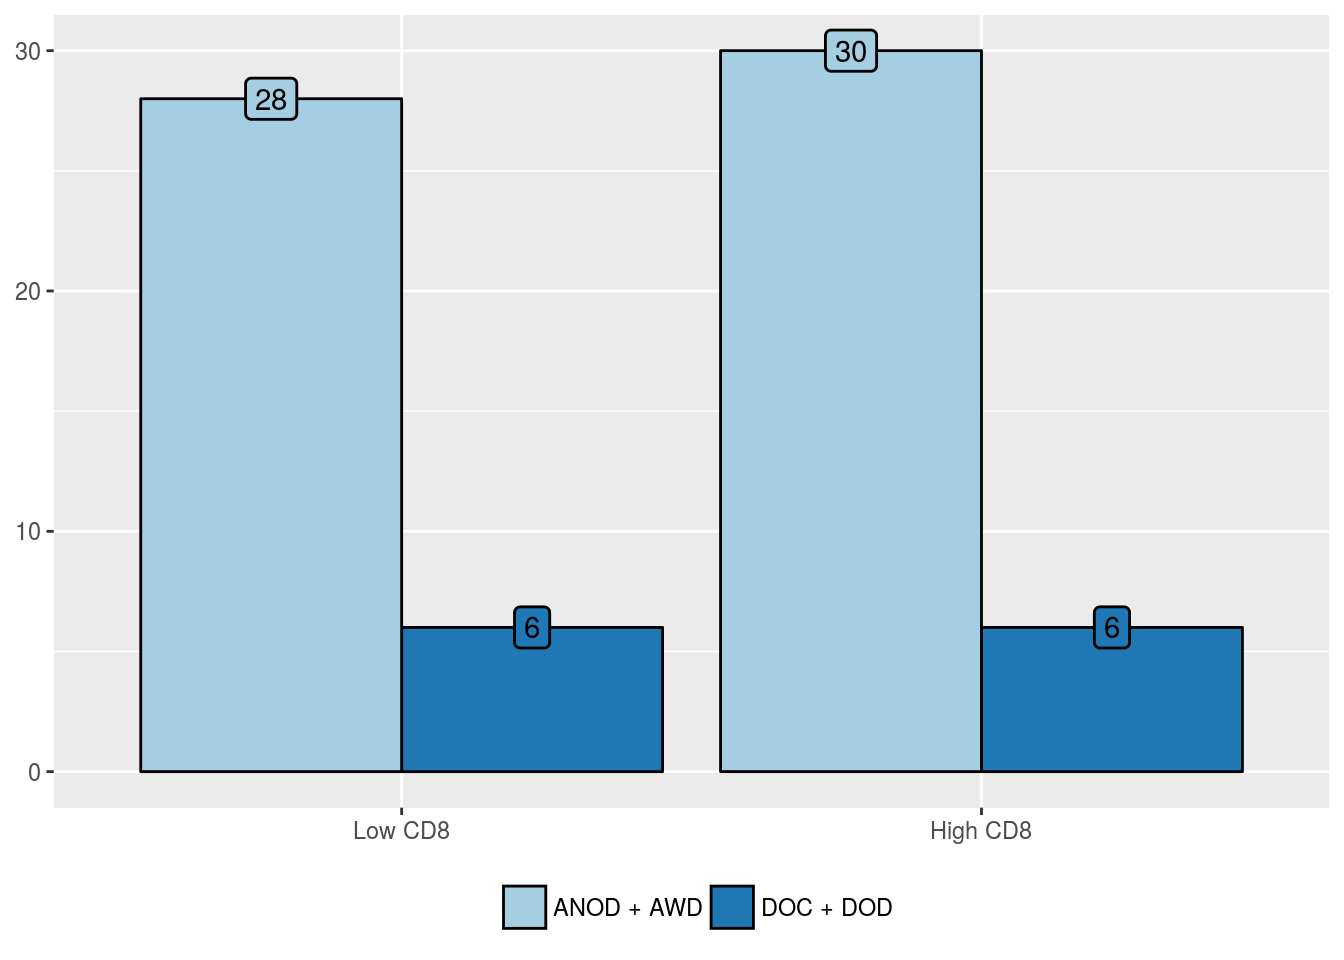
| Predictors | Odds Ratio (95% CI) | P value | Hazard Ratio (95% CI) | P value |
|---|---|---|---|---|
| High CD8 positivity in intratumoral lymphocytes | 0.93 (0.26, 3.31) | 0.91 | 0.76 (0.24, 2.35) | 0.63 |
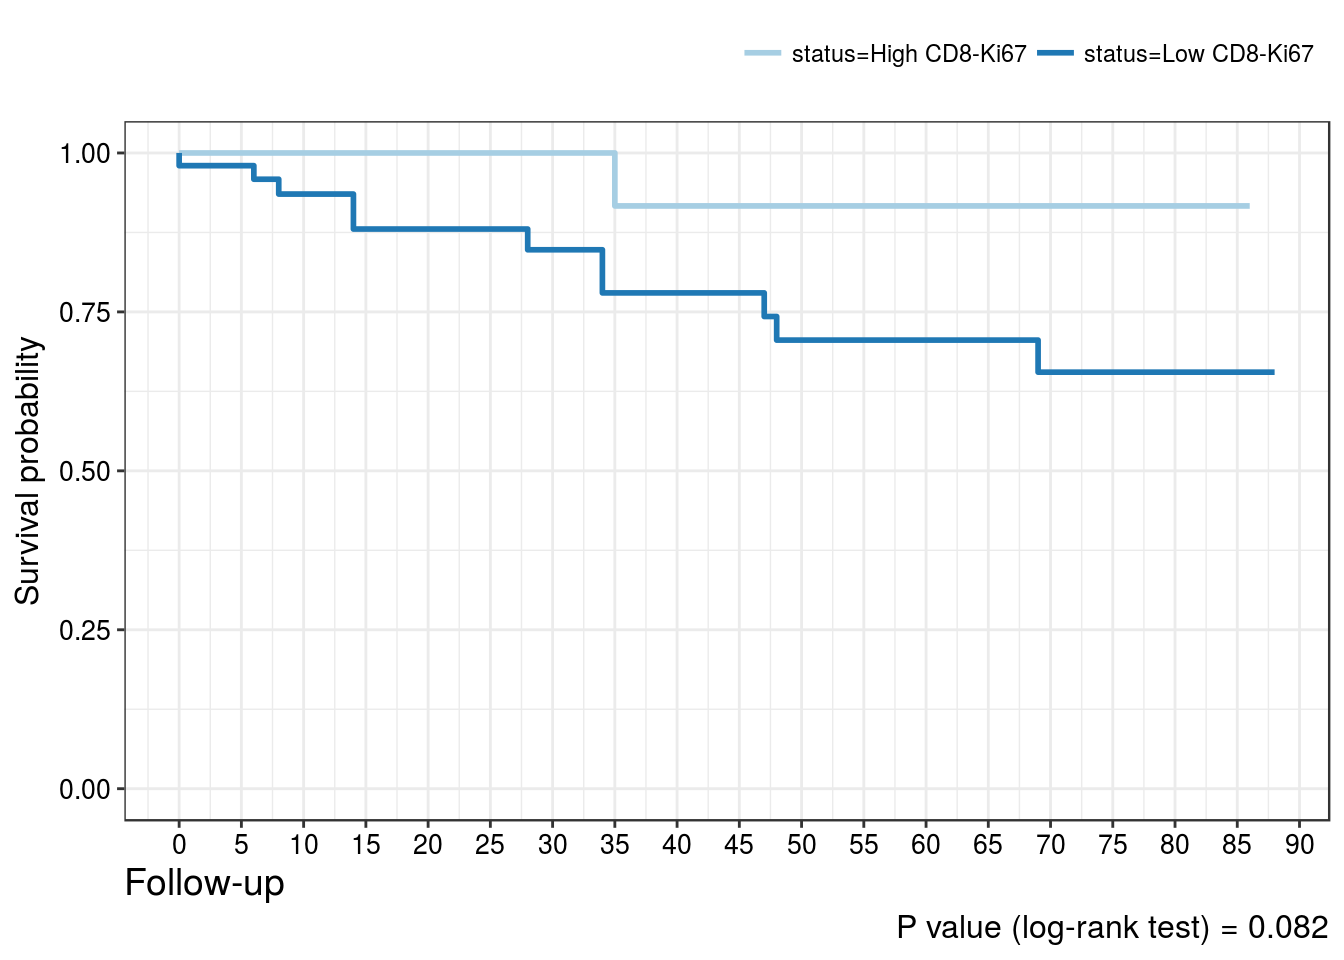
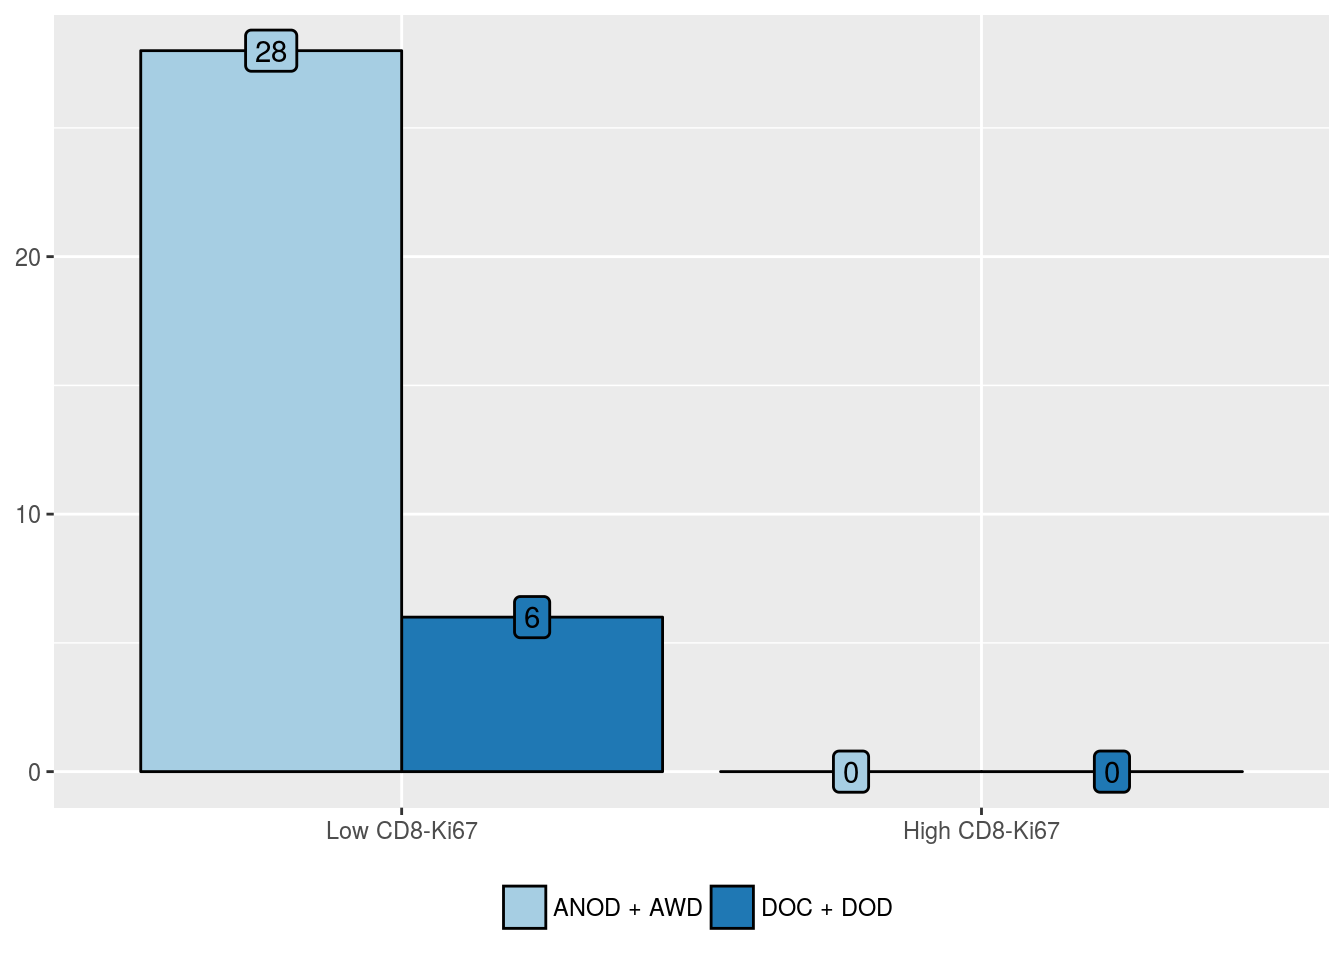
CD8-Ki67 positivity in intratumoral lymphocytes
| ANOD + AWD (%) | DOC + DOD (%) | |
|---|---|---|
| Low CD8-Ki67 | 39 (67.2) | 11 (91.7) |
| High CD8-Ki67 | 19 (32.8) | 1 (8.3) |
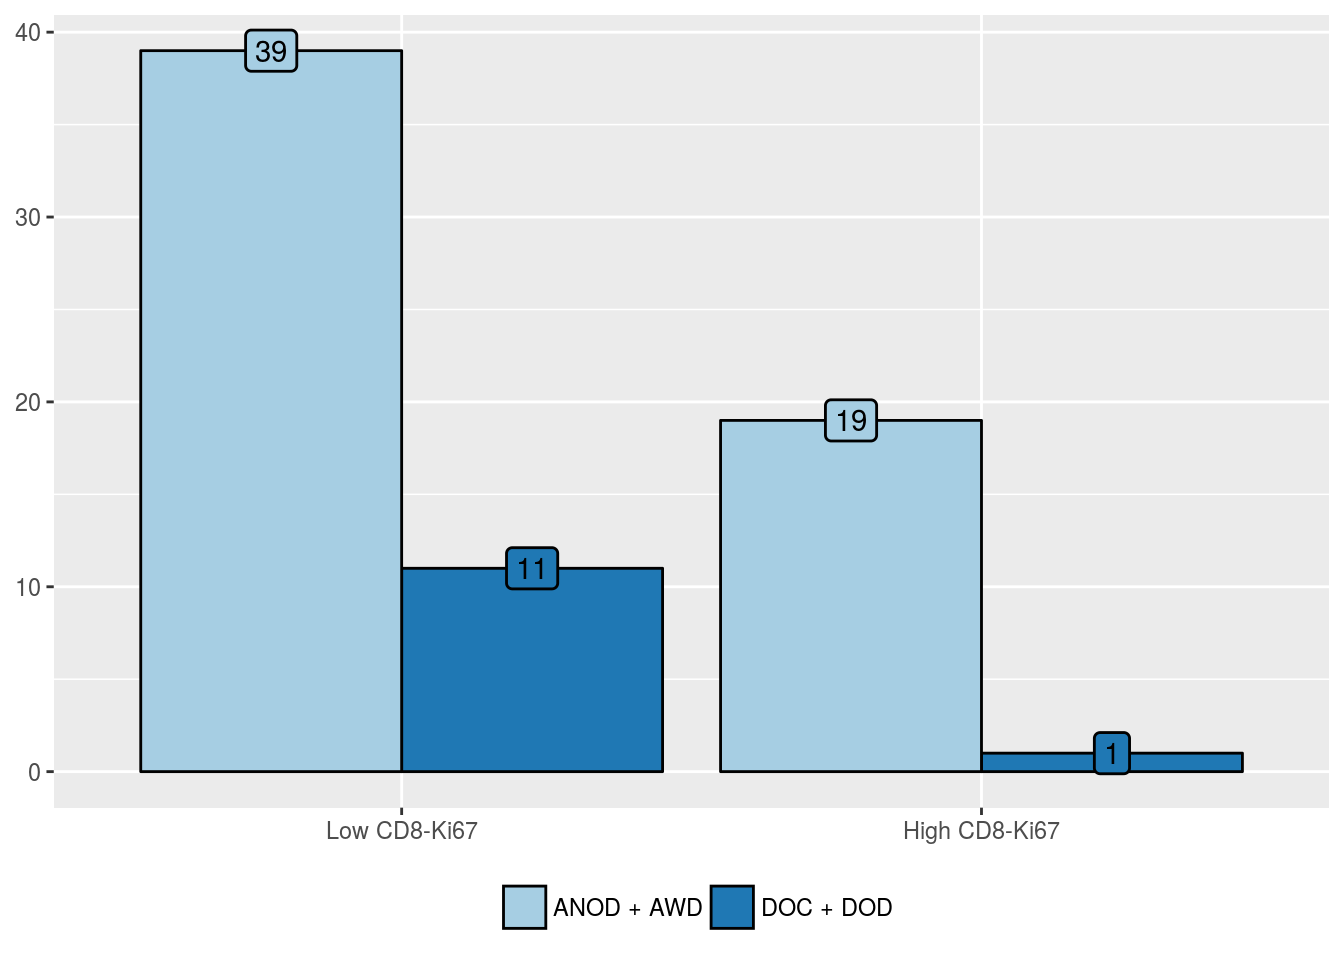
| Predictors | Odds Ratio (95% CI) | P value | Hazard Ratio (95% CI) | P value |
|---|---|---|---|---|
| High CD8-Ki67 positivity in intratumoral lymphocytes | 0.19 (0.0098, 1.07) | 0.12 | 0.20 (0.025, 1.52) | 0.051 |
CD8 positivity in stromal lymphocytes
| ANOD + AWD (%) | DOC + DOD (%) | |
|---|---|---|
| Low CD8 | 15 (51.7) | 3 (50) |
| High CD8 | 14 (48.3) | 3 (50) |
| Predictors | Odds Ratio (95% CI) | P value | Hazard Ratio (95% CI) | P value |
|---|---|---|---|---|
| High CD8 positivity in stromal lymphocytes | 1.07 (0.17, 6.66) | 0.94 | 1.39 (0.28, 6.93) | 0.69 |
CD8-Ki67 positivity in stromal lymphocytes
| ANOD + AWD (%) | DOC + DOD (%) | |
|---|---|---|
| Low CD8-Ki67 | 28 (100) | 6 (100) |
| High CD8-Ki67 | 0 (0) | 0 (0) |
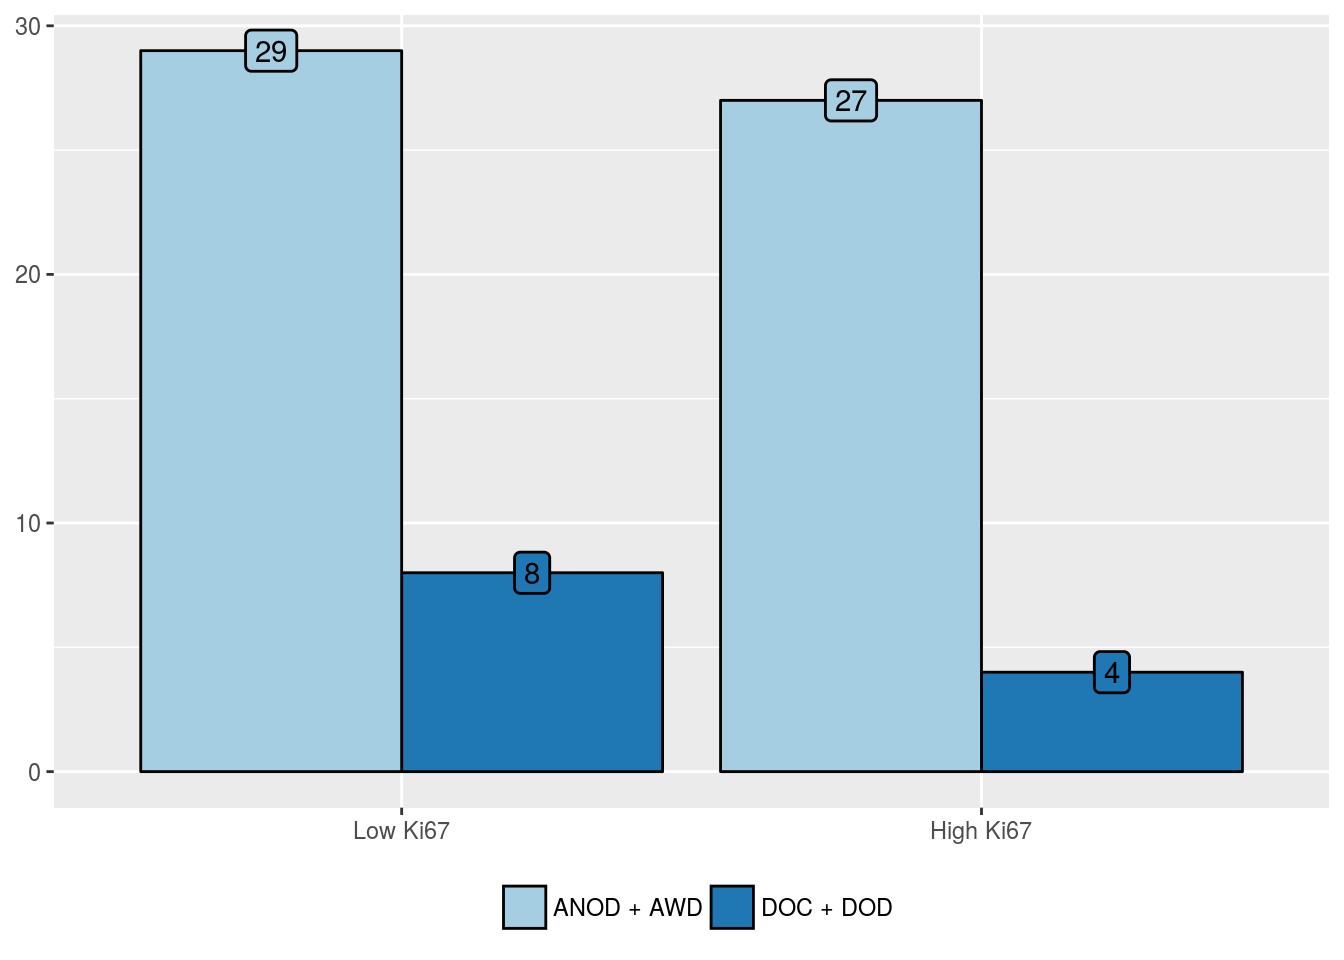
Ki67 positivity in intratumoral lymphocytes
| ANOD + AWD (%) | DOC + DOD (%) | |
|---|---|---|
| Low Ki67 | 29 (51.8) | 8 (66.7) |
| High Ki67 | 27 (48.2) | 4 (33.3) |
| Predictors | Odds Ratio (95% CI) | P value | Hazard Ratio (95% CI) | P value |
|---|---|---|---|---|
| High Ki67 positivity in intratumoral lymphocytes | 0.54 (0.13, 1.91) | 0.35 | 0.53 (0.16, 1.77) | 0.29 |
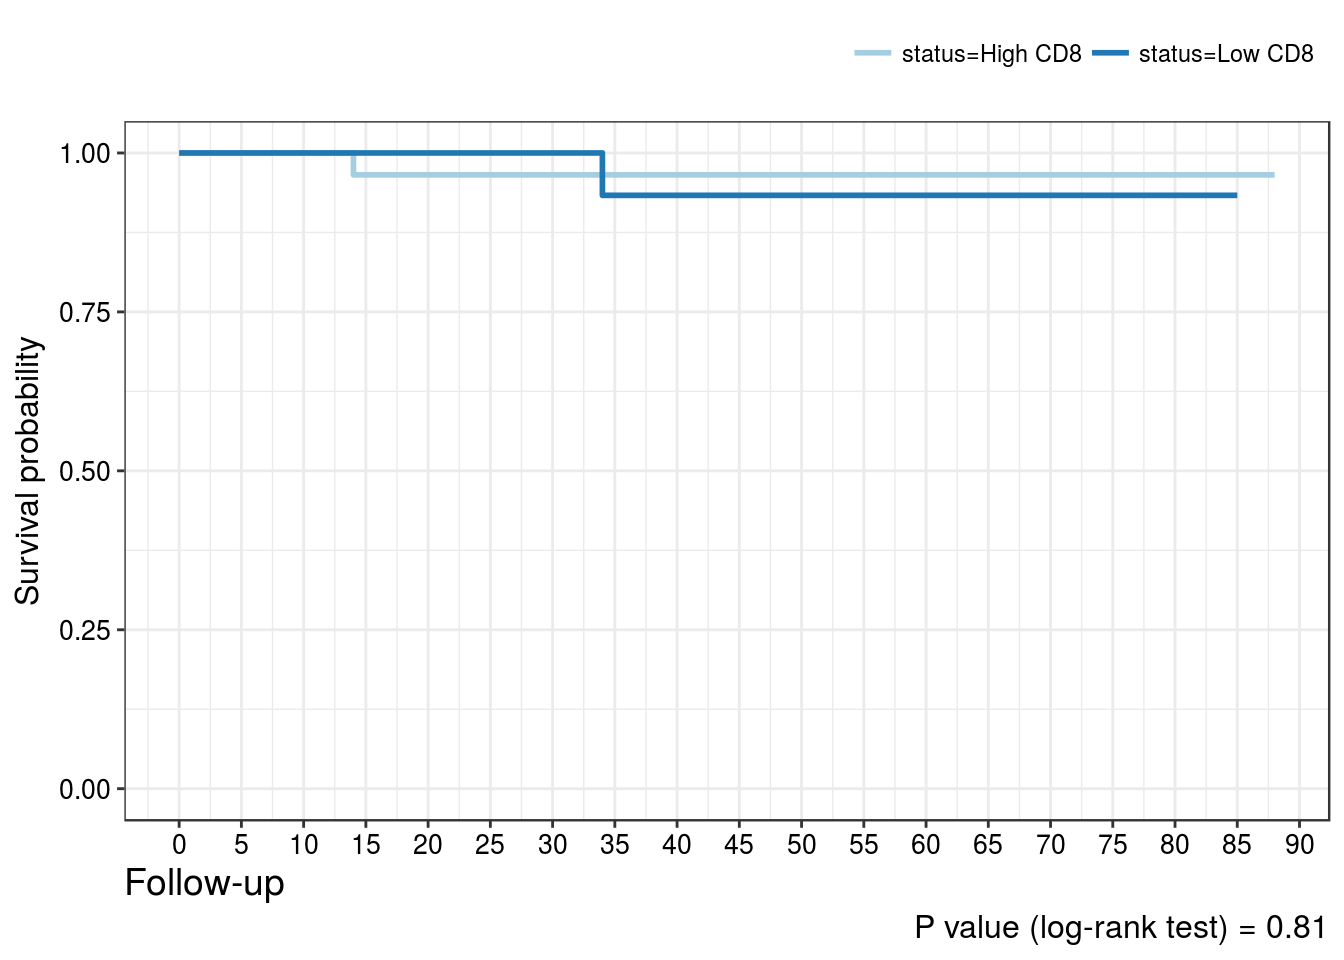
Cancer-related
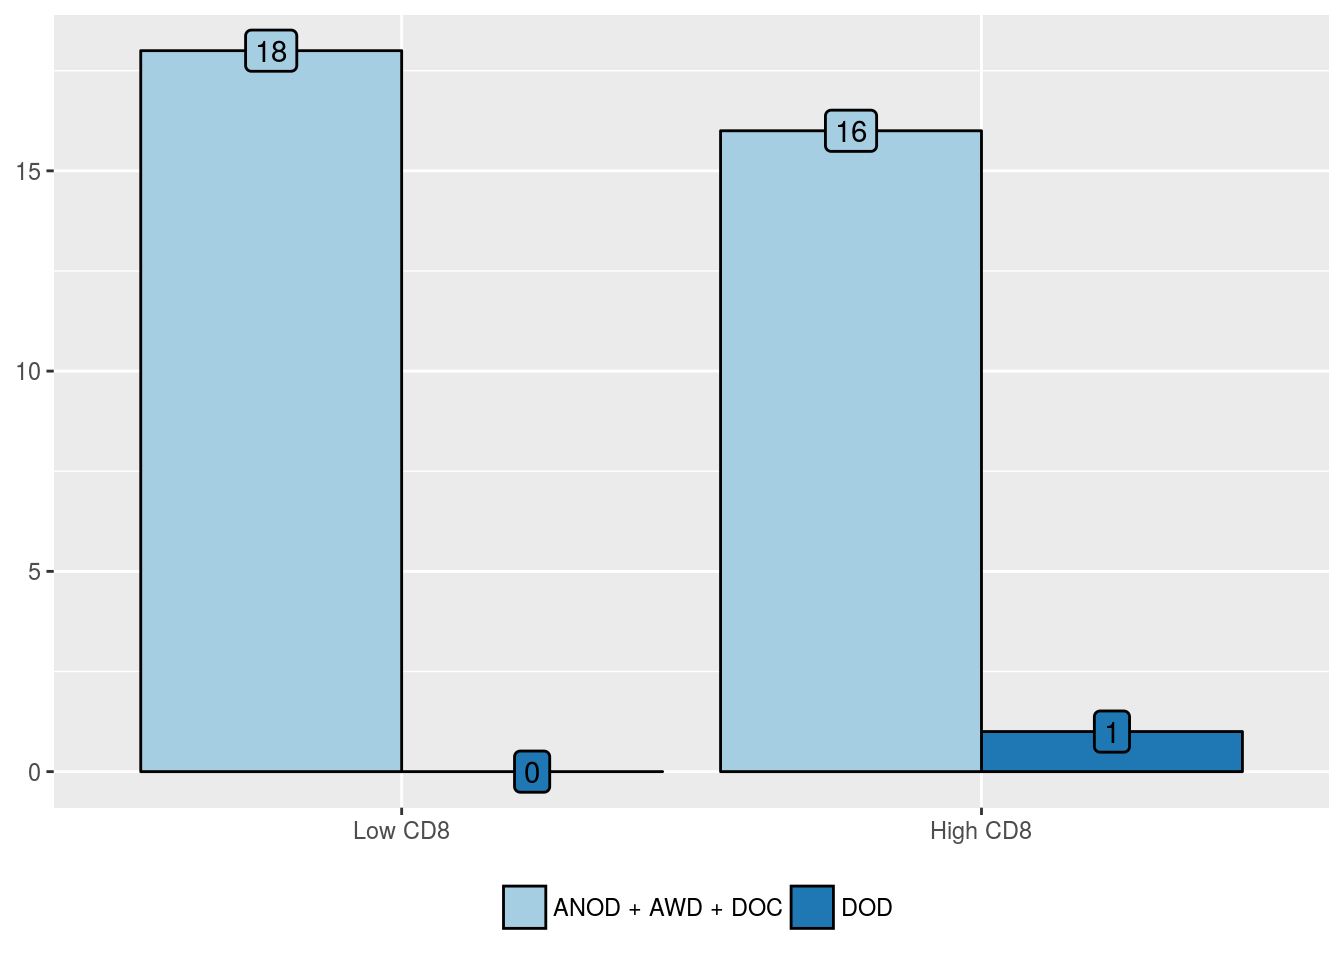
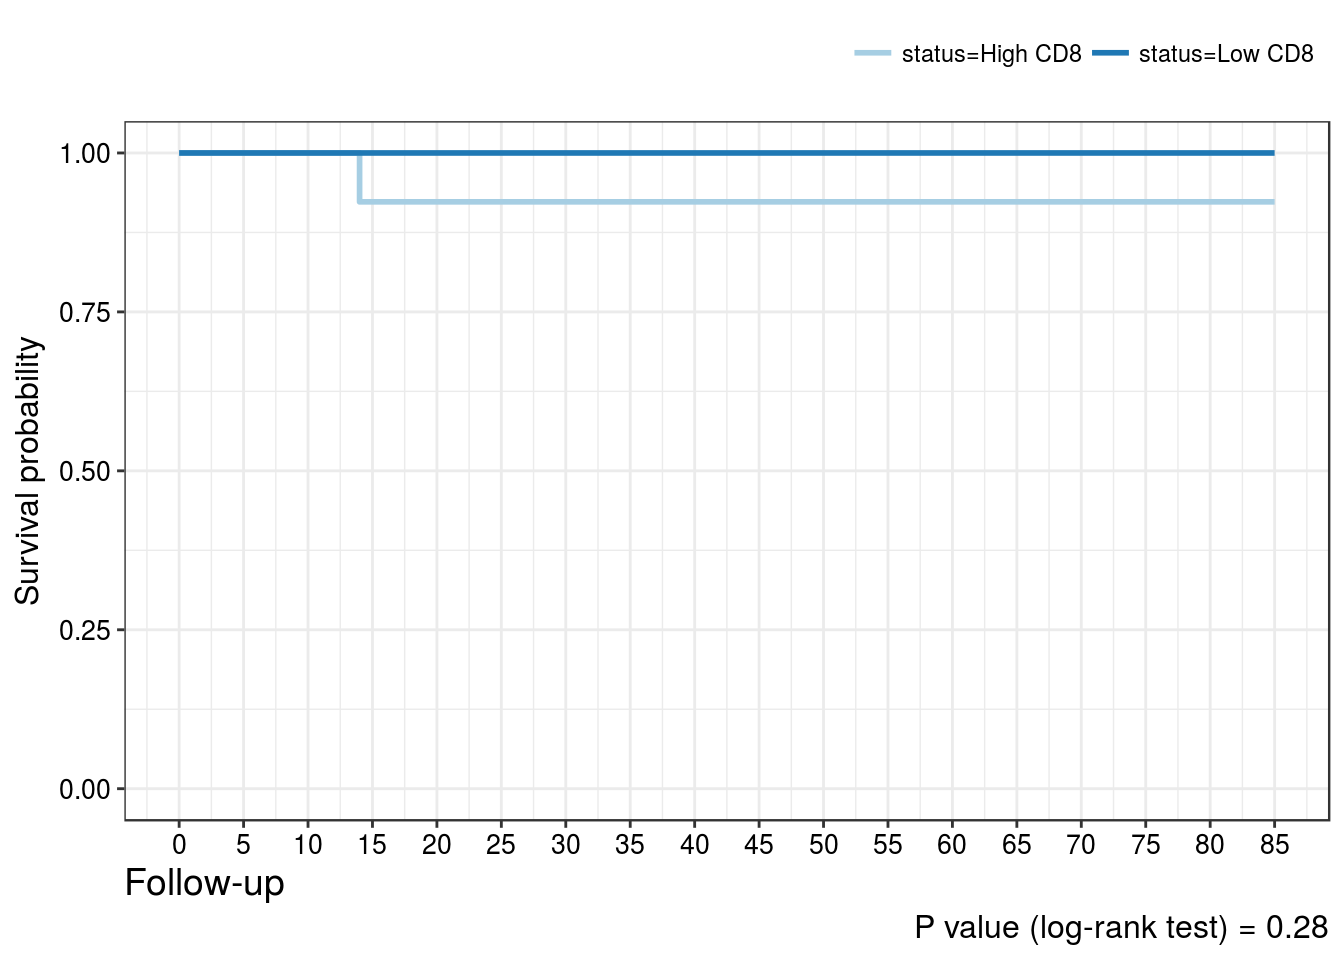
CD8 positivity in intratumoral lymphocytes
| ANOD + AWD + DOC (%) | DOD (%) | |
|---|---|---|
| Low CD8 | 33 (48.5) | 1 (50) |
| High CD8 | 35 (51.5) | 1 (50) |
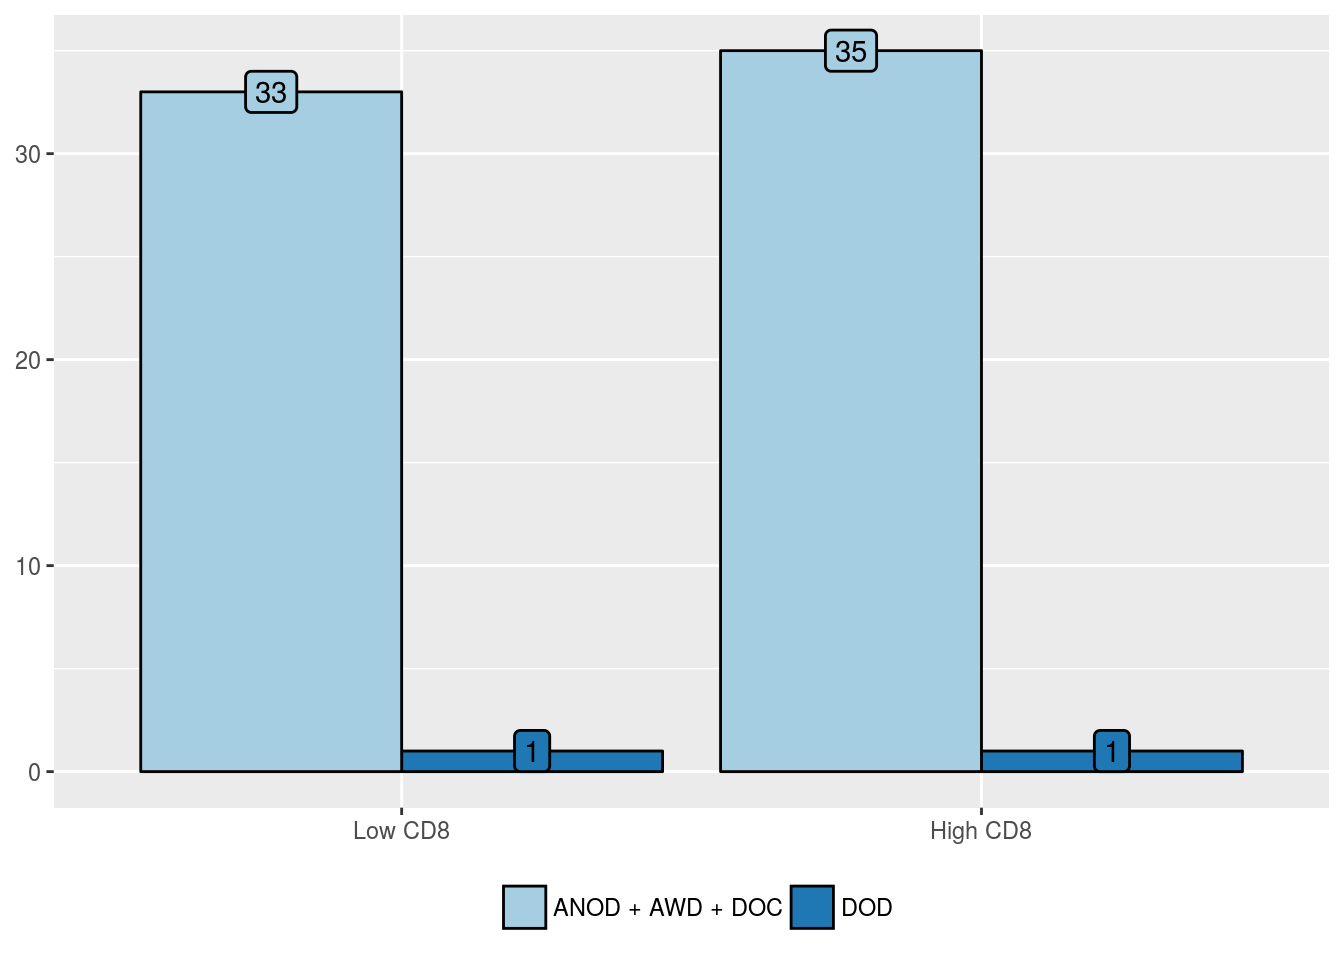
| Predictors | Odds Ratio (95% CI) | P value | Hazard Ratio (95% CI) | P value |
|---|---|---|---|---|
| High CD8 positivity in intratumoral lymphocytes | 0.94 (0.036, 24.50) | 0.97 | 0.72 (0.045, 11.51) | 0.82 |
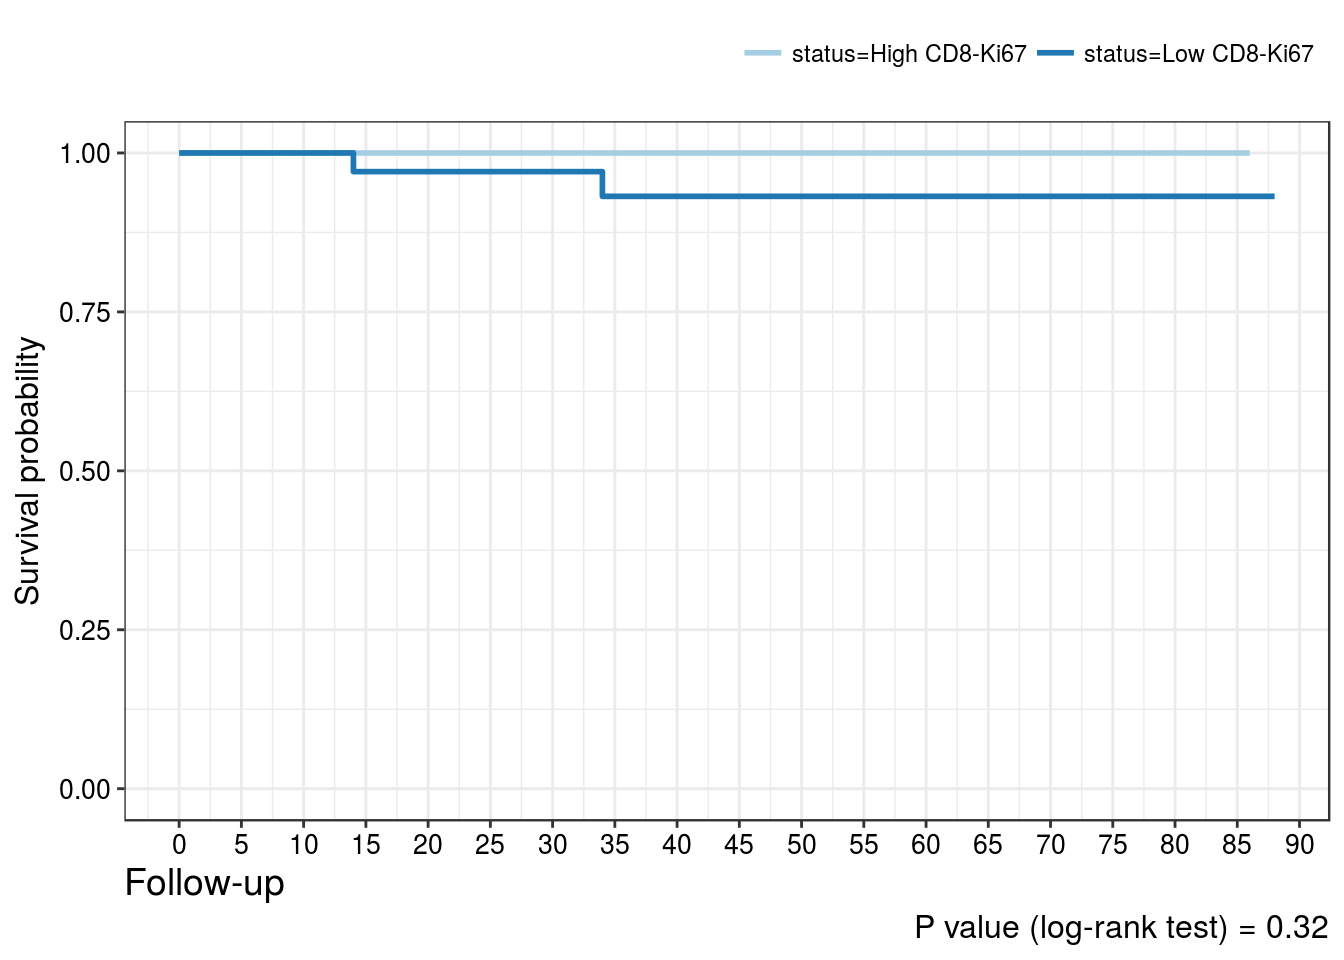
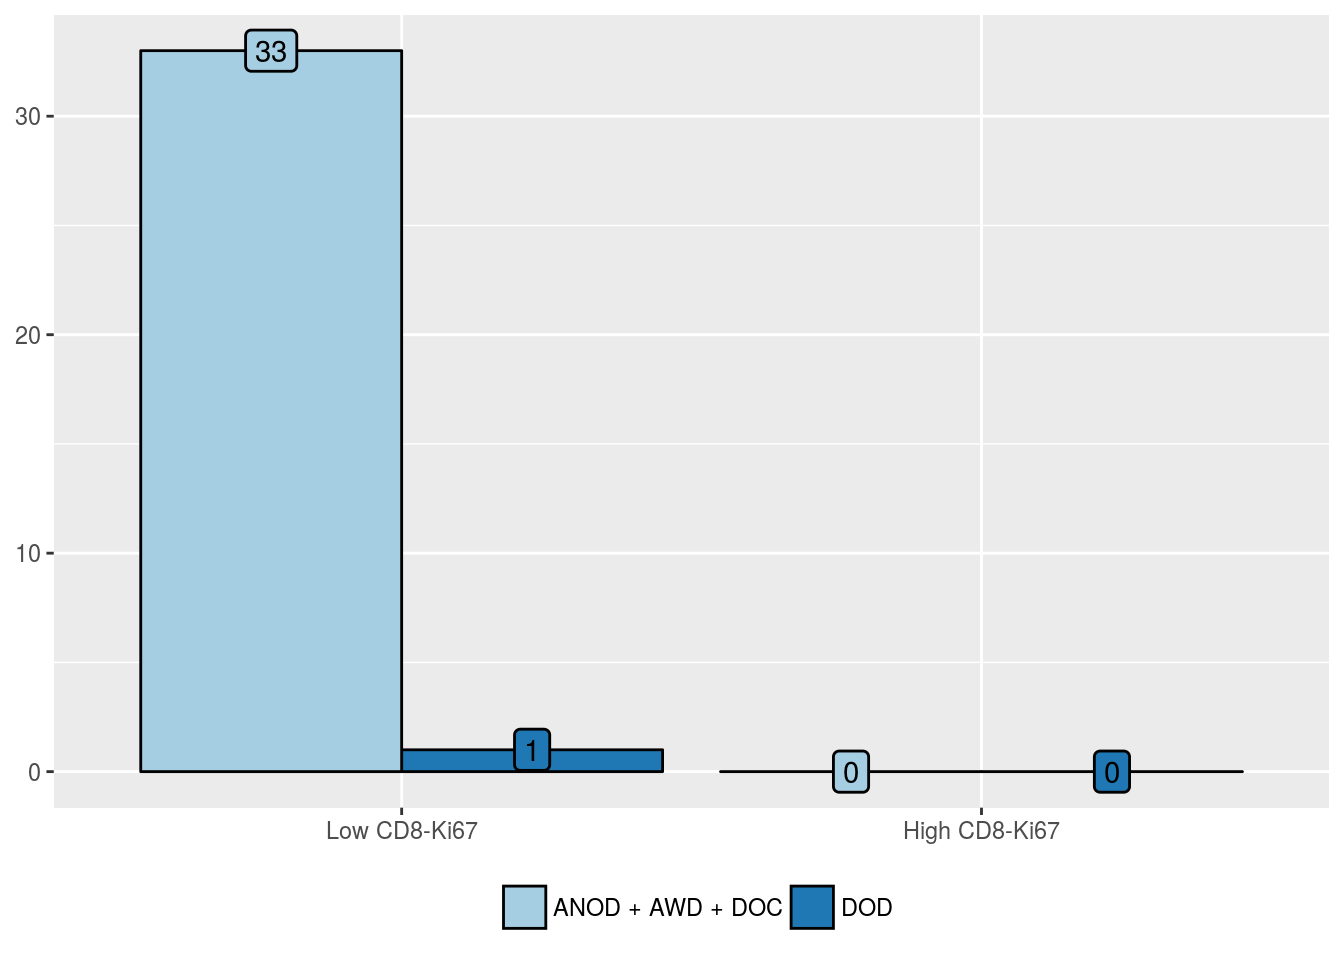
CD8-Ki67 positivity in intratumoral lymphocytes
| ANOD + AWD + DOC (%) | DOD (%) | |
|---|---|---|
| Low CD8-Ki67 | 48 (70.6) | 2 (100) |
| High CD8-Ki67 | 20 (29.4) | 0 (0) |
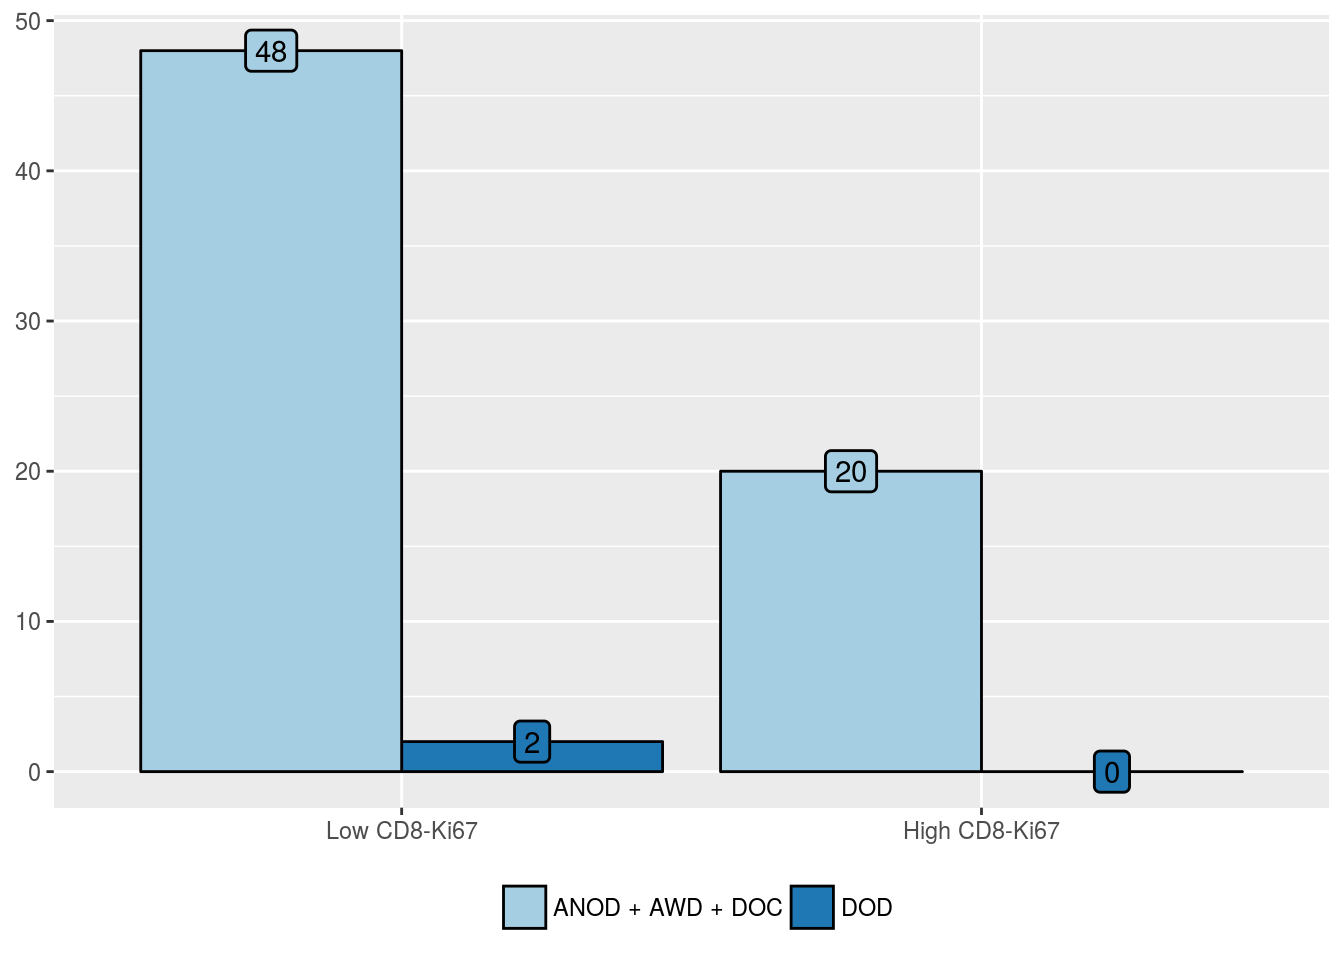
| Predictors | Odds Ratio (95% CI) | P value | Hazard Ratio (95% CI) | P value |
|---|---|---|---|---|
| High CD8-Ki67 positivity in intratumoral lymphocytes | 2.8e-08 (NA, 5e+278) | 1 | 2.9e-09 (0.00, Inf) | 0.21 |
CD8 positivity in stromal lymphocytes
| ANOD + AWD + DOC (%) | DOD (%) | |
|---|---|---|
| Low CD8 | 18 (52.9) | 0 (0) |
| High CD8 | 16 (47.1) | 1 (100) |
| Predictors | Odds Ratio (95% CI) | P value | Hazard Ratio (95% CI) | P value |
|---|---|---|---|---|
| High CD8 positivity in stromal lymphocytes | 5.3e+07 (0.00, NA) | 1 | 1.9e+09 (0.00, Inf) | 0.22 |
CD8-Ki67 positivity in stromal lymphocytes
| ANOD + AWD + DOC (%) | DOD (%) | |
|---|---|---|
| Low CD8-Ki67 | 33 (100) | 1 (100) |
| High CD8-Ki67 | 0 (0) | 0 (0) |
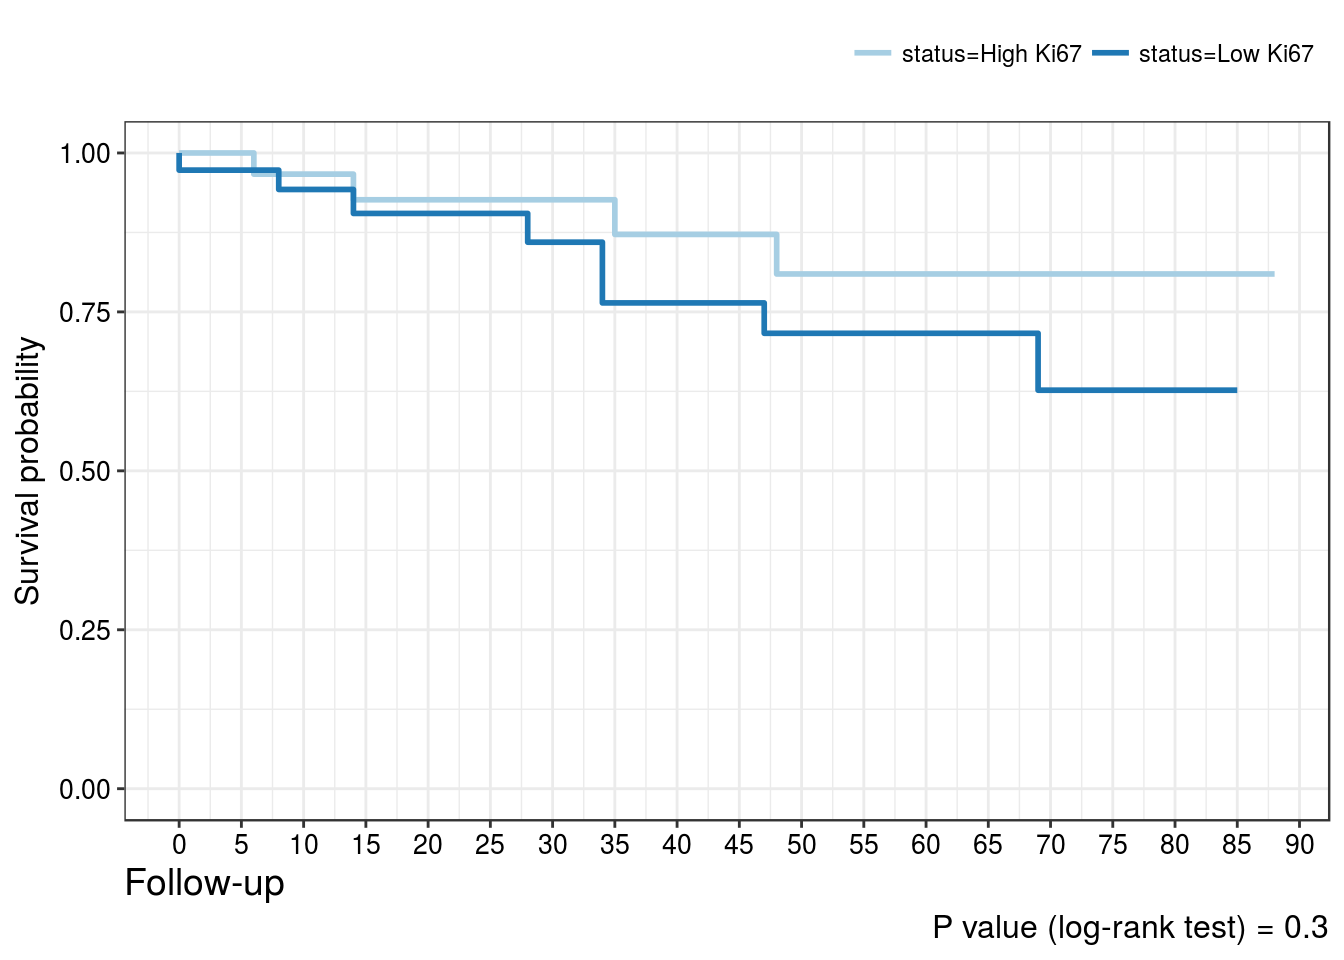
Ki67 positivity in intratumoral lymphocytes
| ANOD + AWD + DOC (%) | DOD (%) | |
|---|---|---|
| Low Ki67 | 36 (54.5) | 1 (50) |
| High Ki67 | 30 (45.5) | 1 (50) |
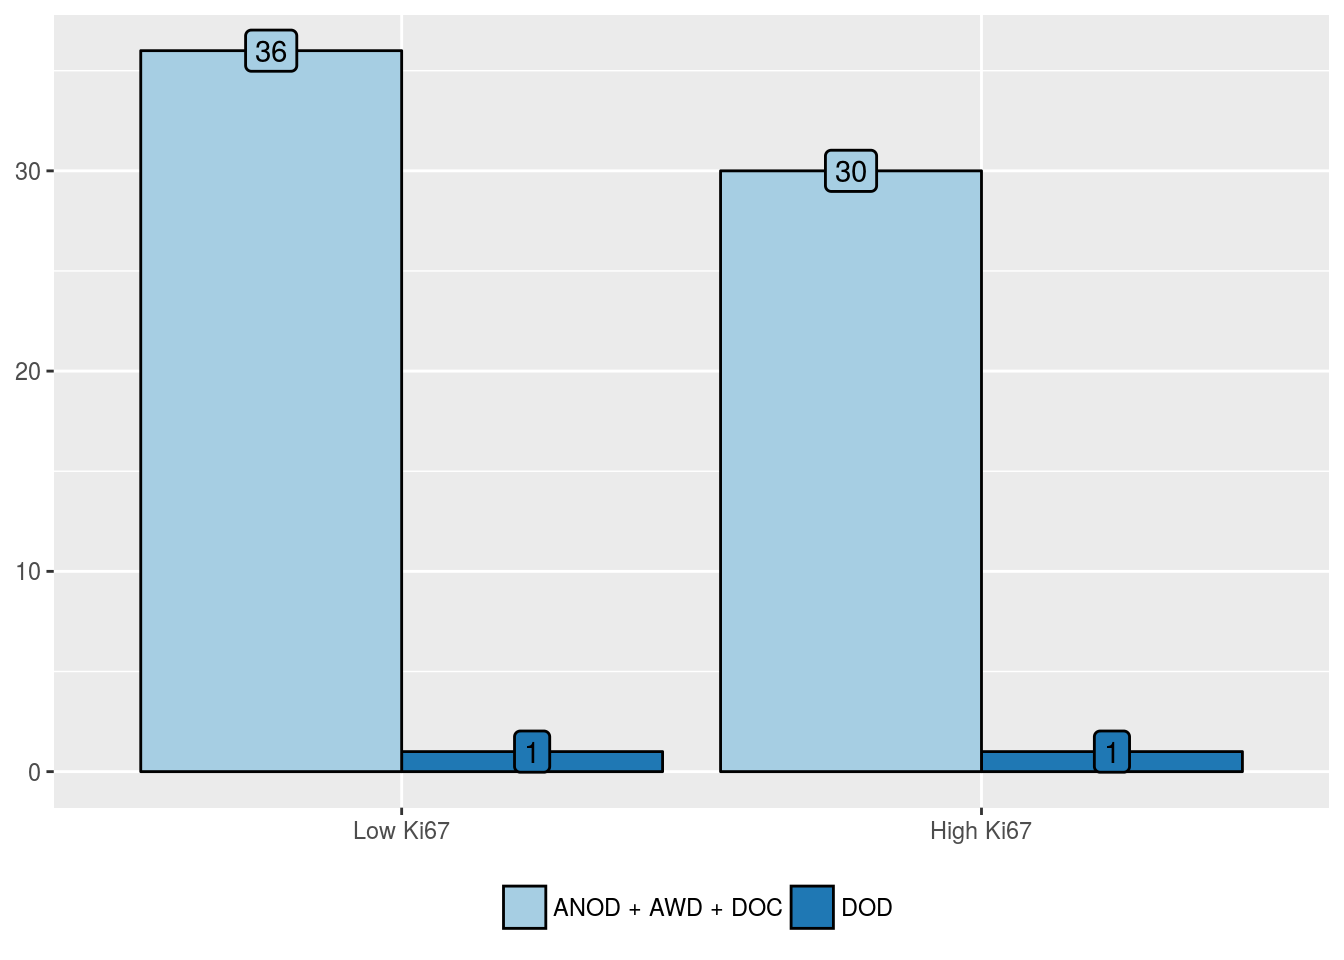
| Predictors | Odds Ratio (95% CI) | P value | Hazard Ratio (95% CI) | P value |
|---|---|---|---|---|
| High Ki67 positivity in intratumoral lymphocytes | 1.20 (0.046, 31.21) | 0.9 | 1.05 (0.066, 16.79) | 0.97 |