CD8 and Ki67 expression in metastatic tumors
CD8 positivity in intratumoral lymphocytes
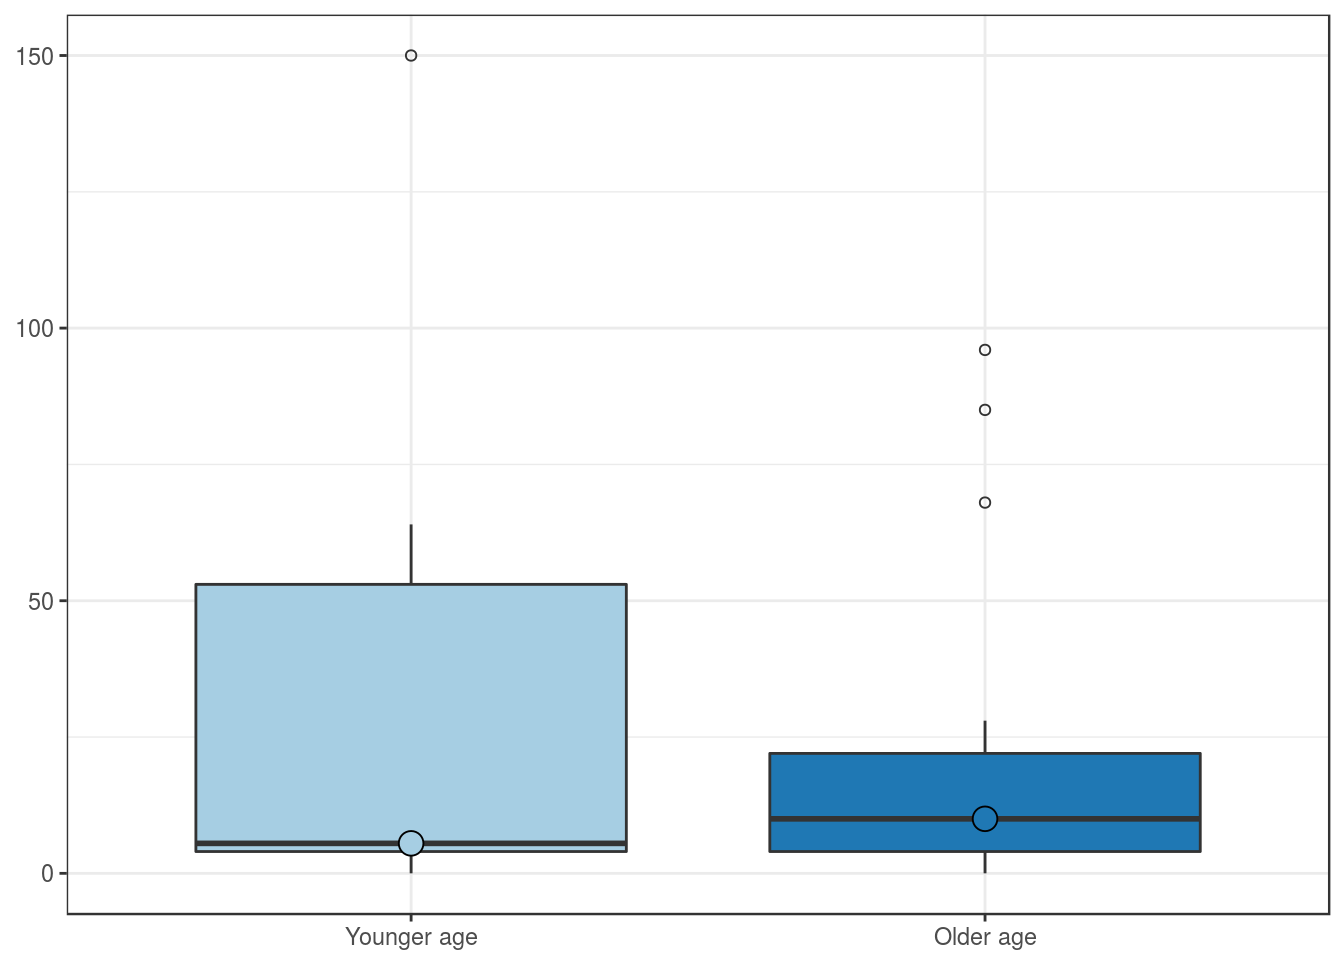
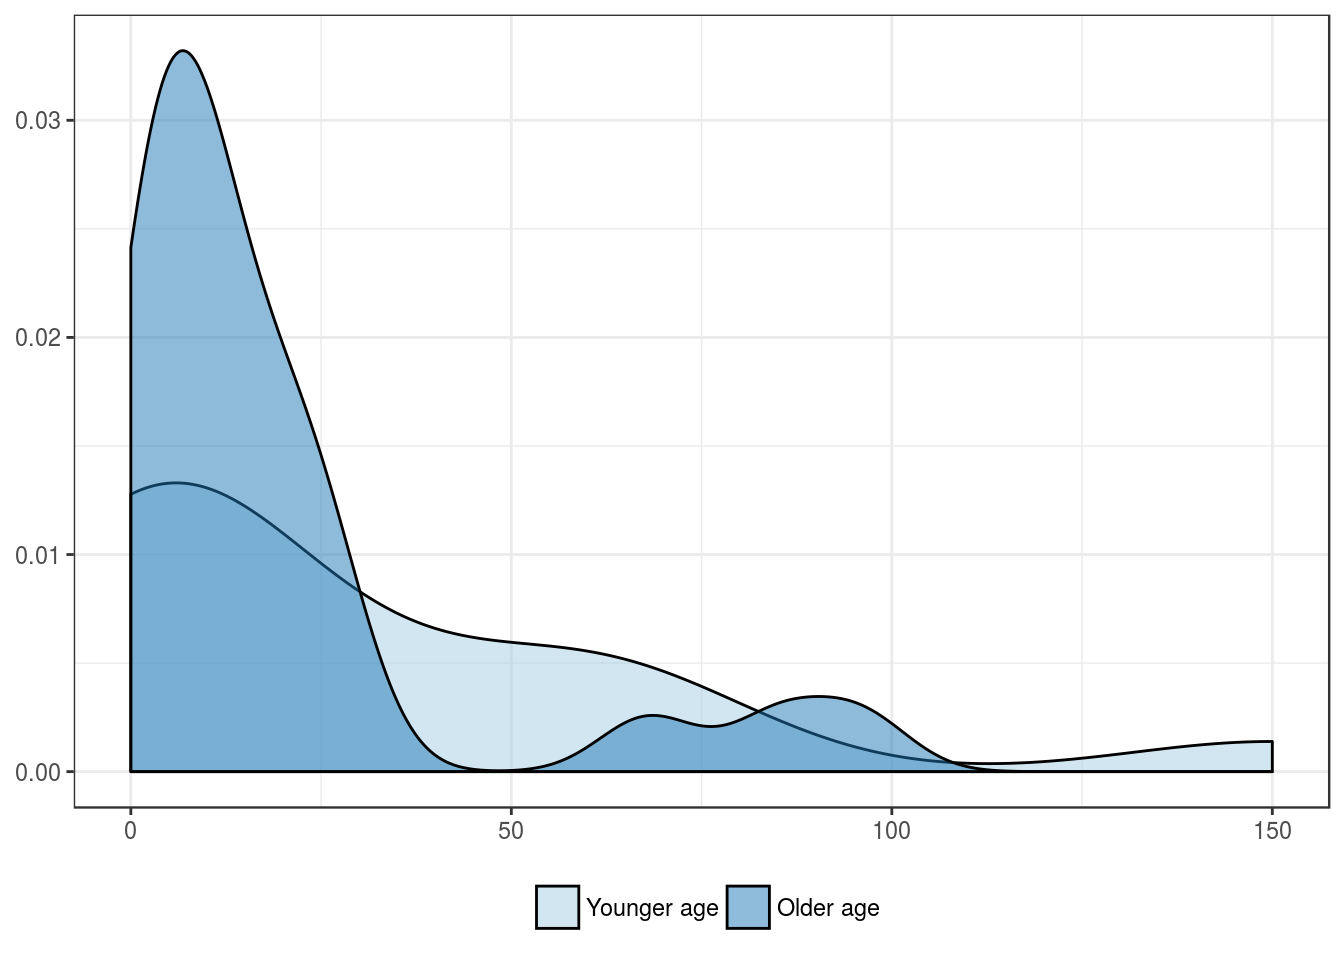
Clinical features
Patients’ age group, in years
| Younger age | Older age | |
|---|---|---|
| Mean | 29.7 | 19.5 |
| Standard deviation | 41.6 | 25.6 |
| Median | 5.5 | 10.0 |
| Interquartile range | 49.0 | 18.0 |
| Minimum | 0.0 | 0.0 |
| Maximum | 150.0 | 96.0 |
| Value | |
|---|---|
| U-statistic | 184 |
| P statistic | 9.2e-01 |
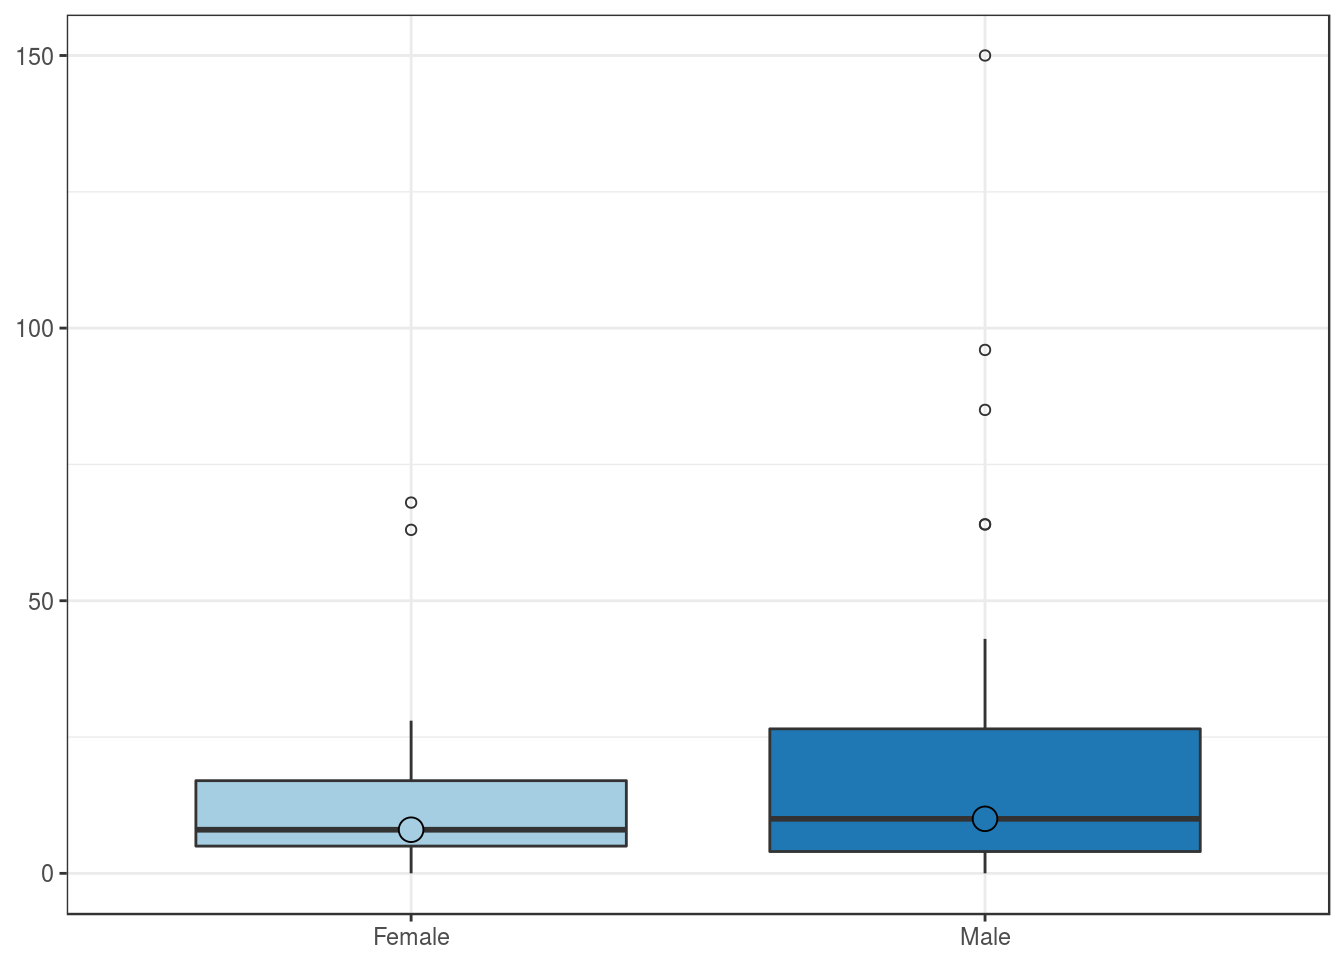
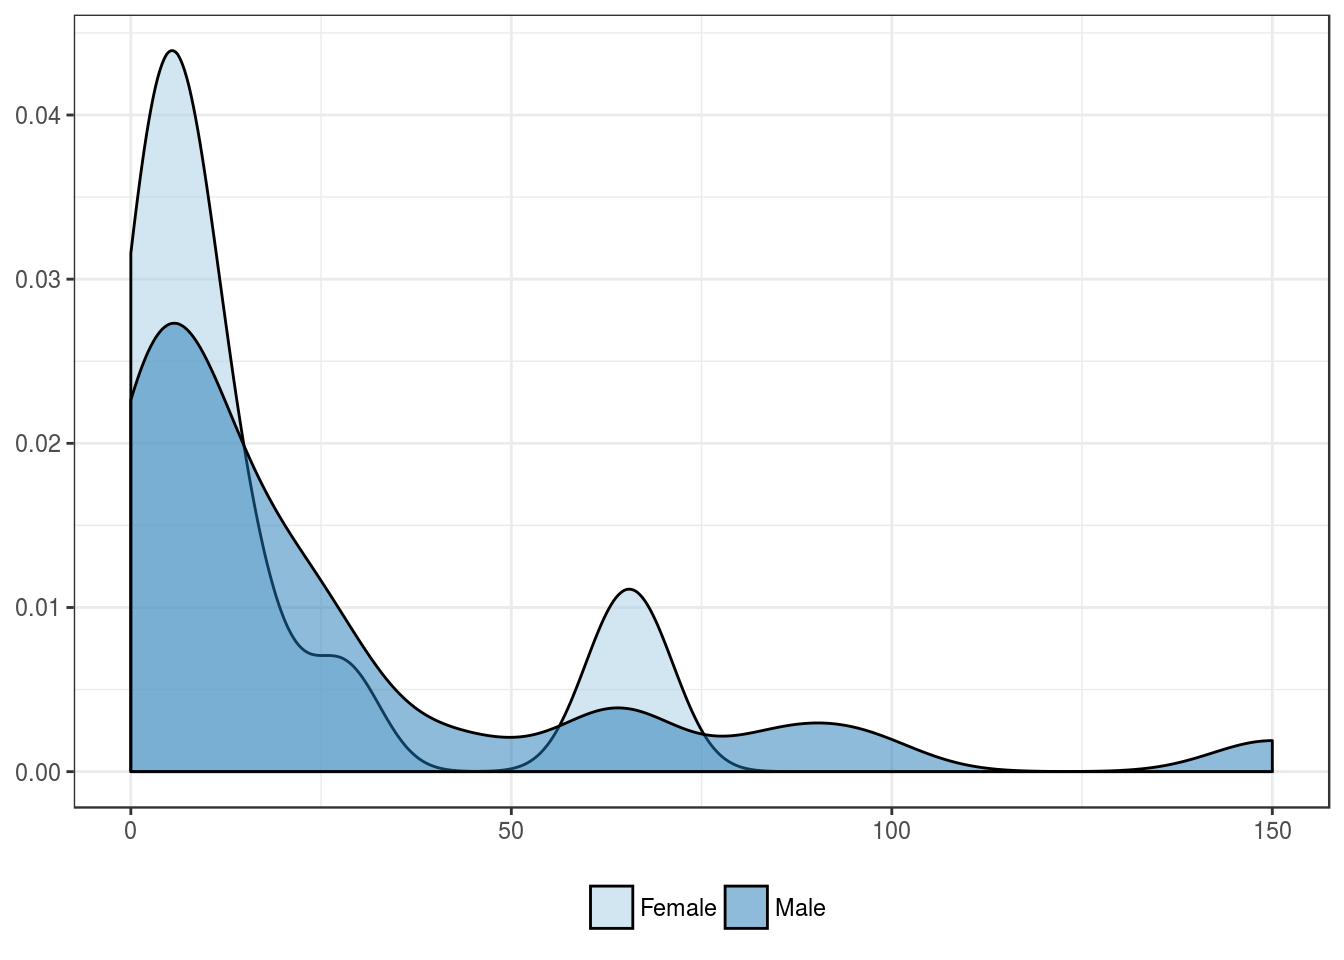
Patients’ sex
| Female | Male | |
|---|---|---|
| Mean | 17.2 | 26.3 |
| Standard deviation | 22.7 | 36.1 |
| Median | 8.0 | 10.0 |
| Interquartile range | 12.0 | 22.5 |
| Minimum | 0.0 | 0.0 |
| Maximum | 68.0 | 150.0 |
| Value | |
|---|---|
| U-statistic | 155 |
| P statistic | 5.6e-01 |
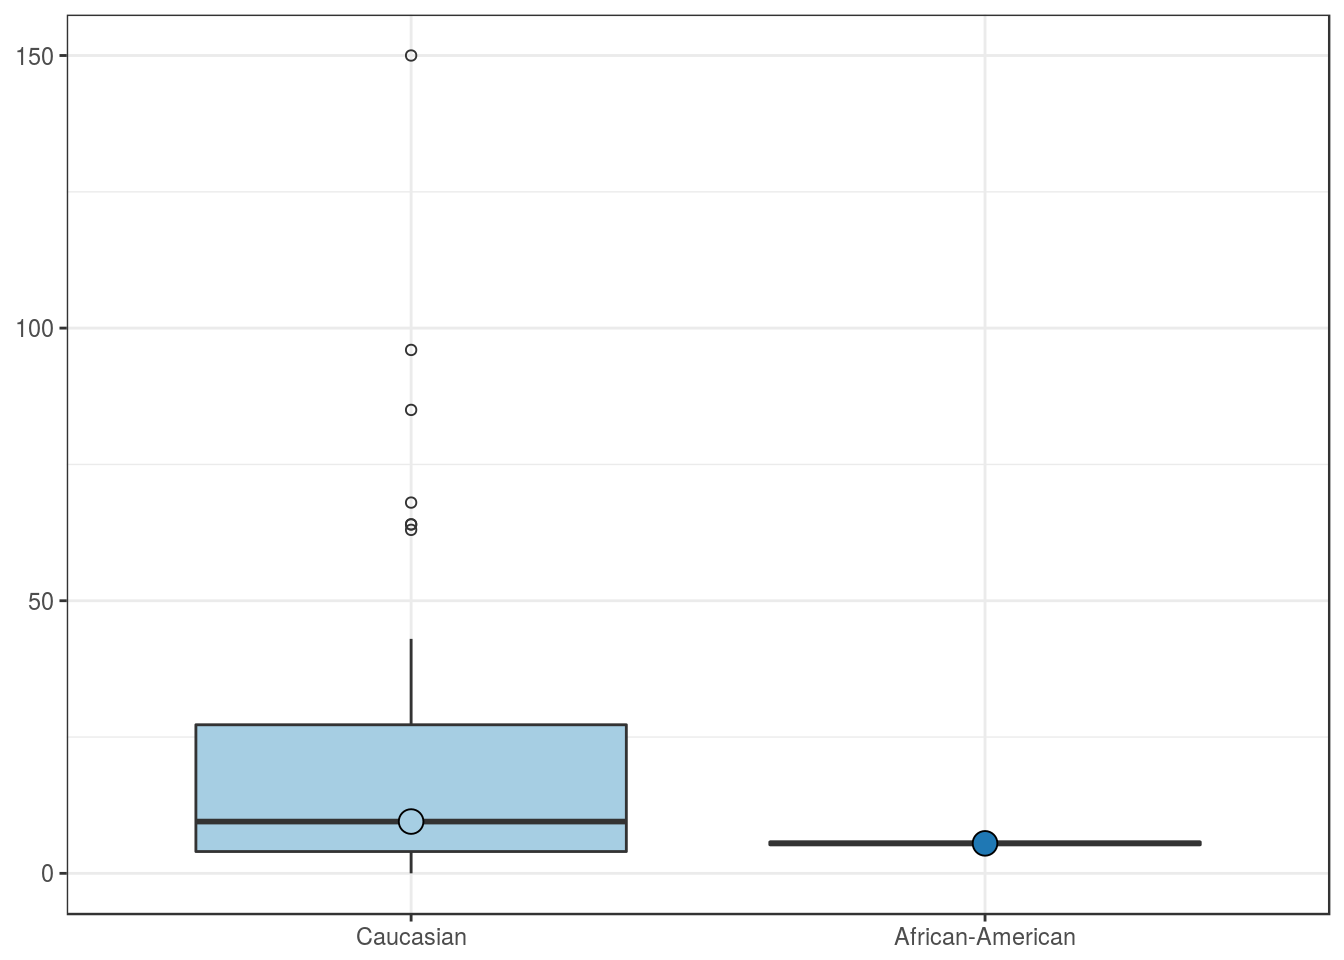
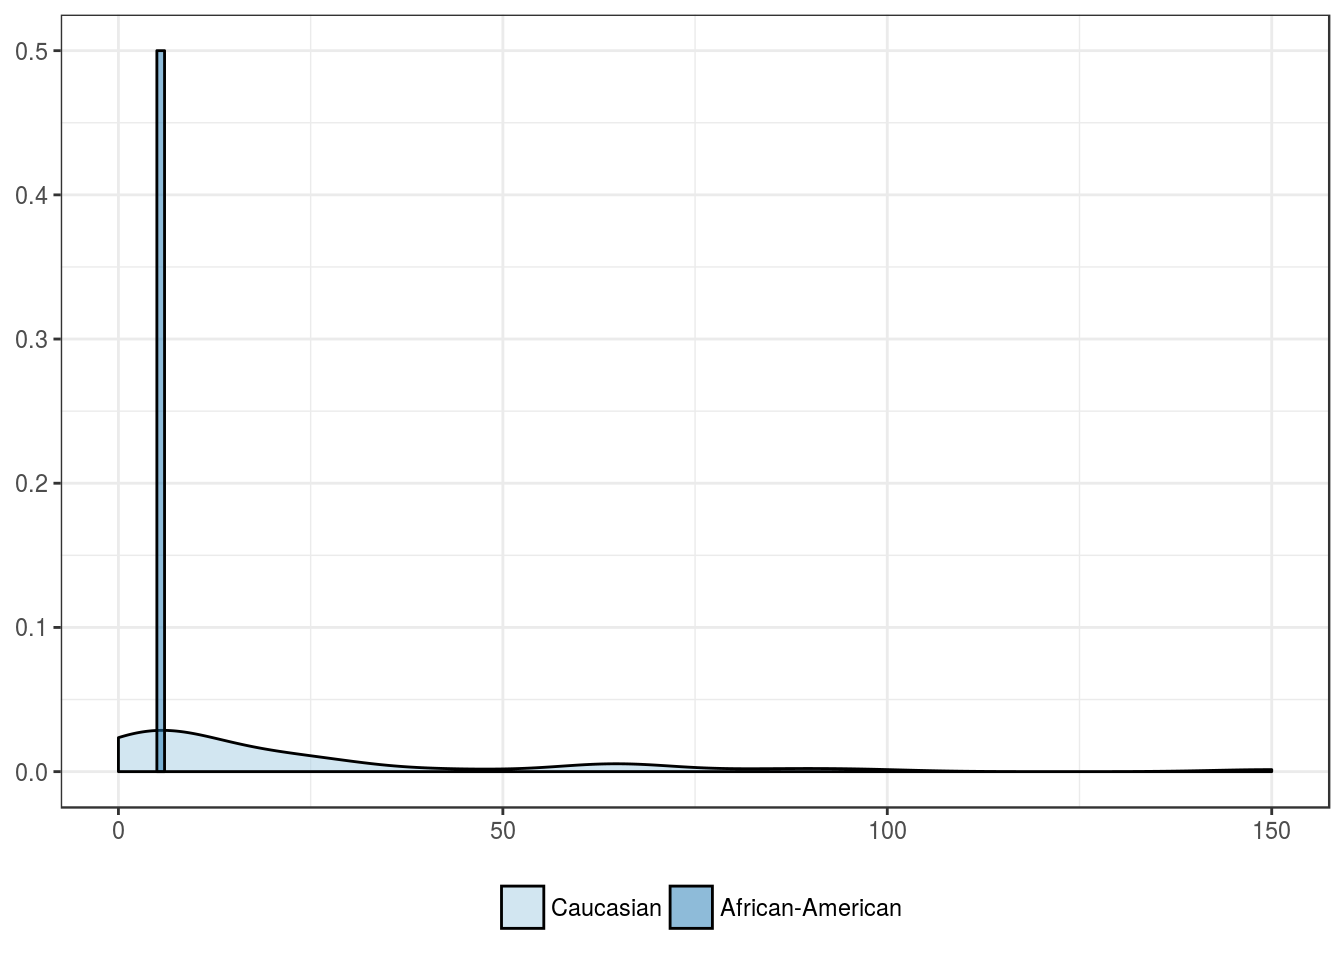
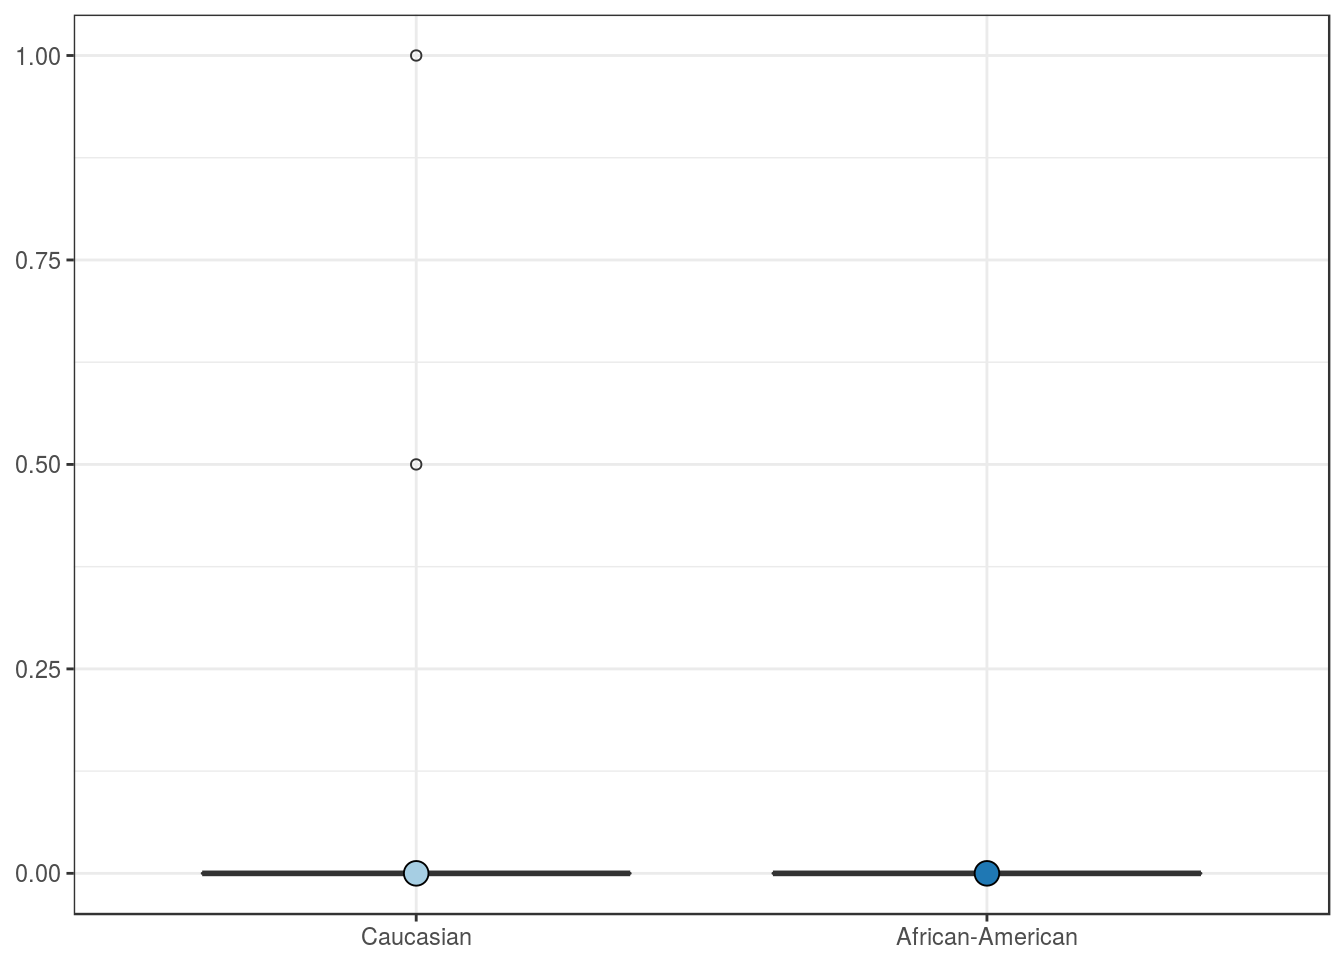
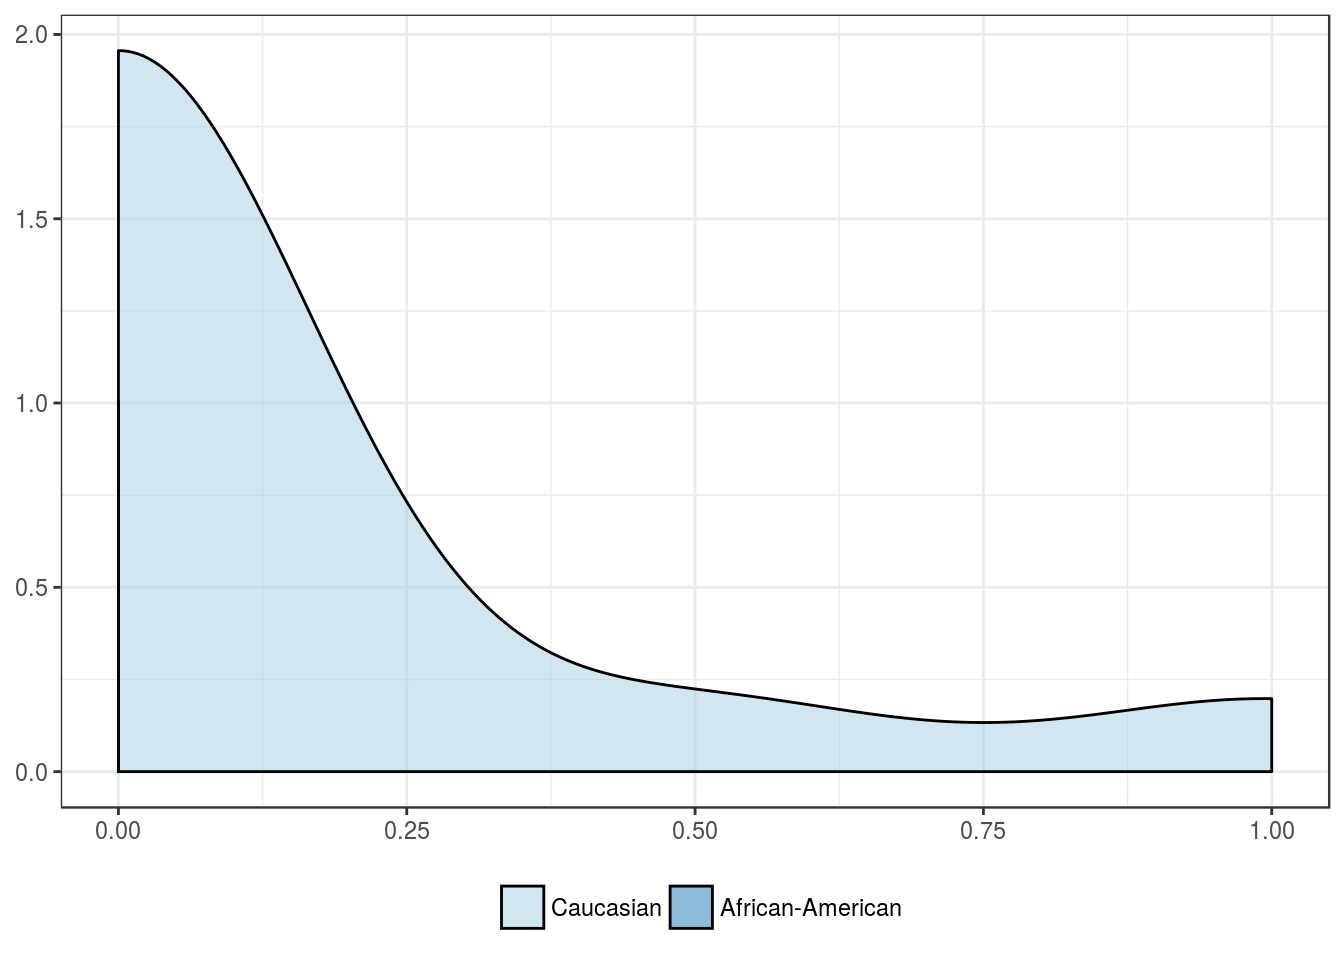
Patients’ race
| Caucasian | African-American | Asian | Other | |
|---|---|---|---|---|
| Mean | 24.3 | 5.5 | NA | NA |
| Standard deviation | 33.0 | 0.7 | NA | NA |
| Median | 9.5 | 5.5 | NA | NA |
| Interquartile range | 23.2 | 0.5 | NA | NA |
| Minimum | 0.0 | 5.0 | NA | NA |
| Maximum | 150.0 | 6.0 | NA | NA |
| Value | |
|---|---|
| Statistic | 0.4669 |
| Parameter | 1 |
| P statistic | 0.49 |
Outcome features
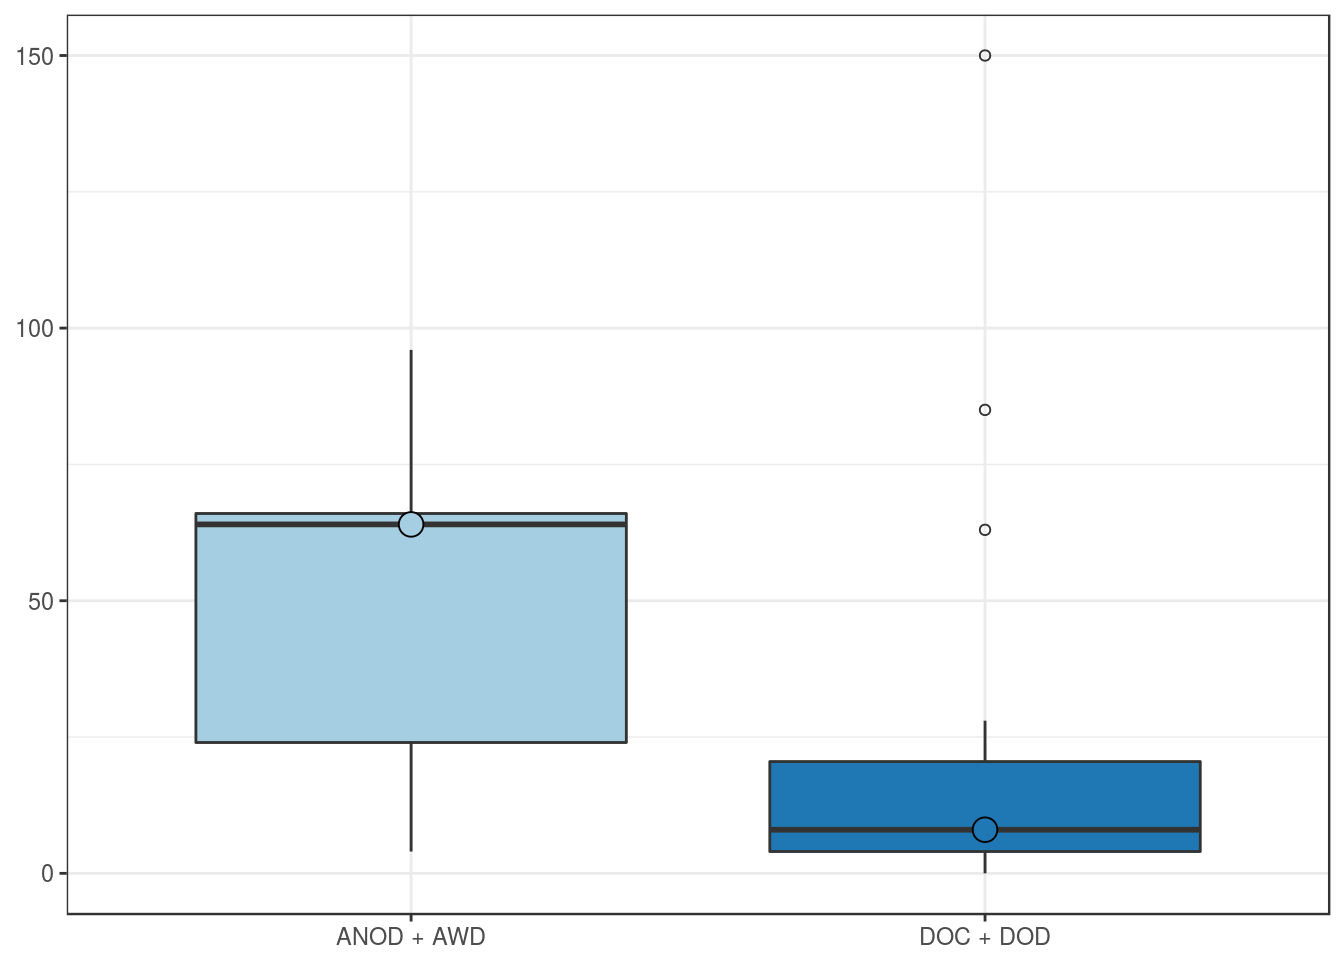
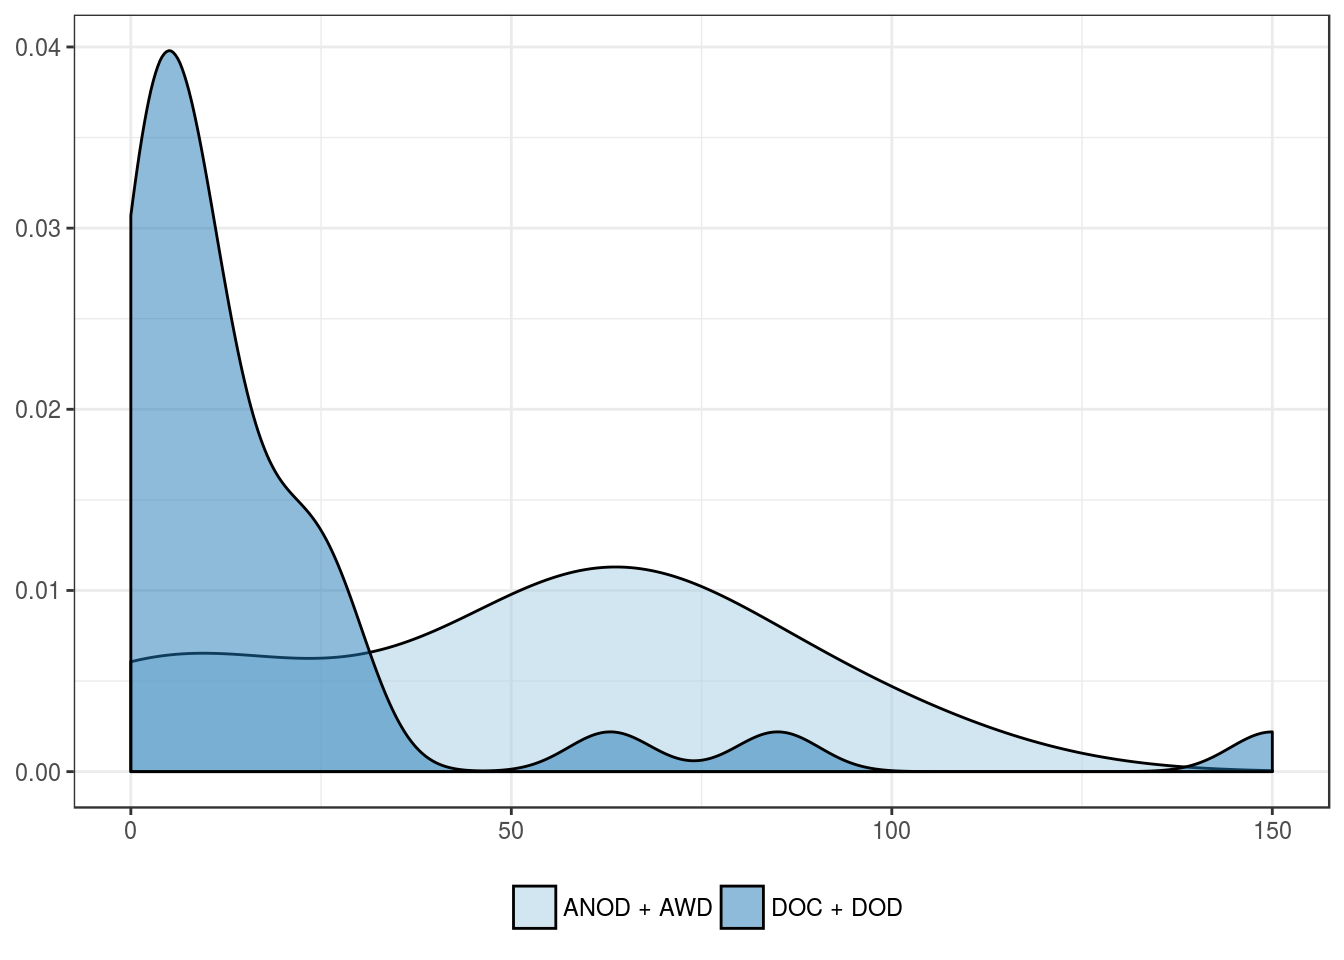
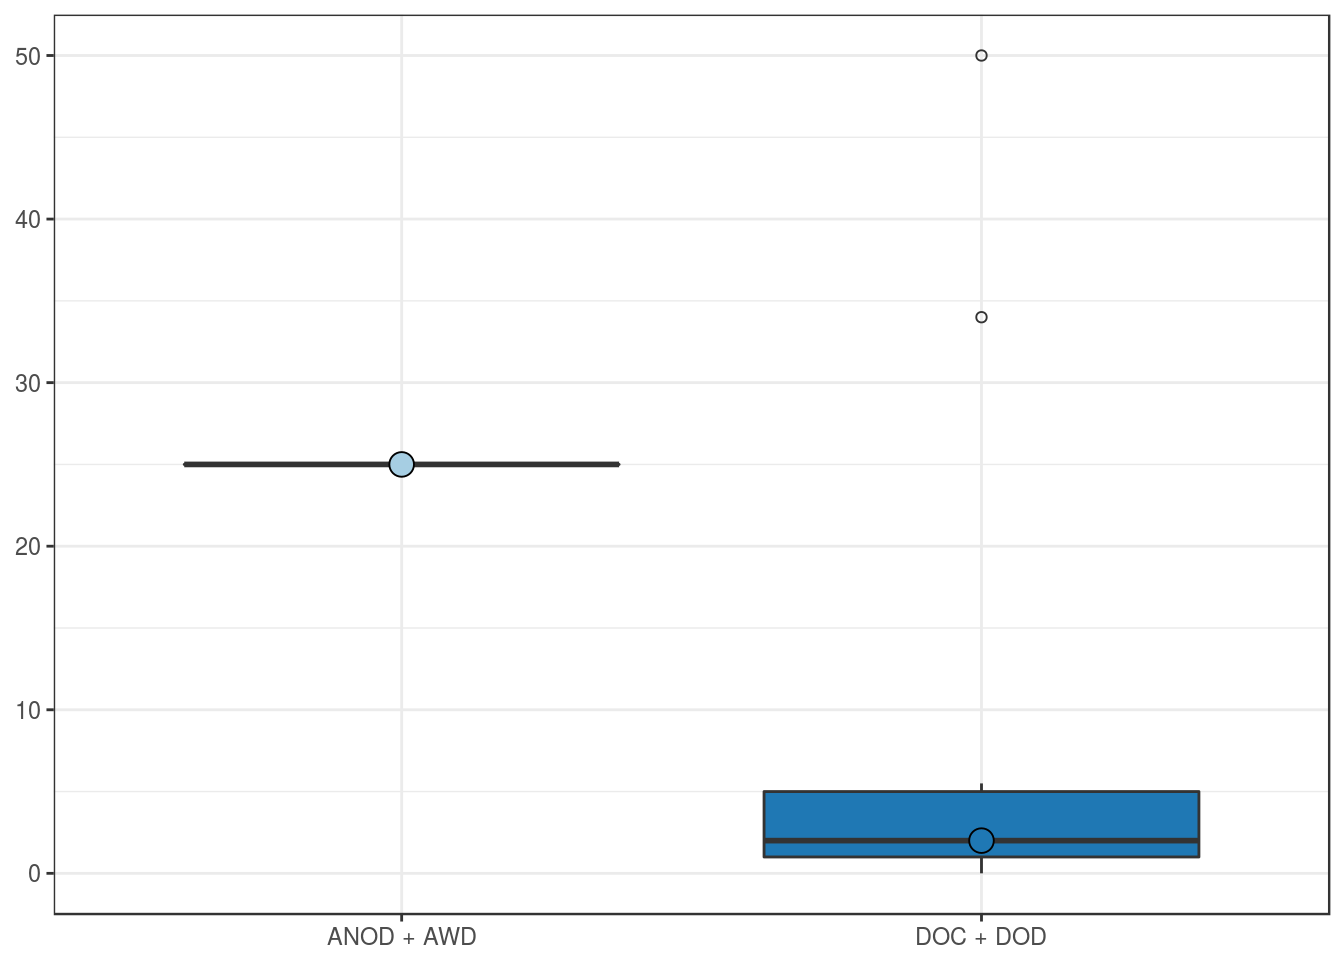
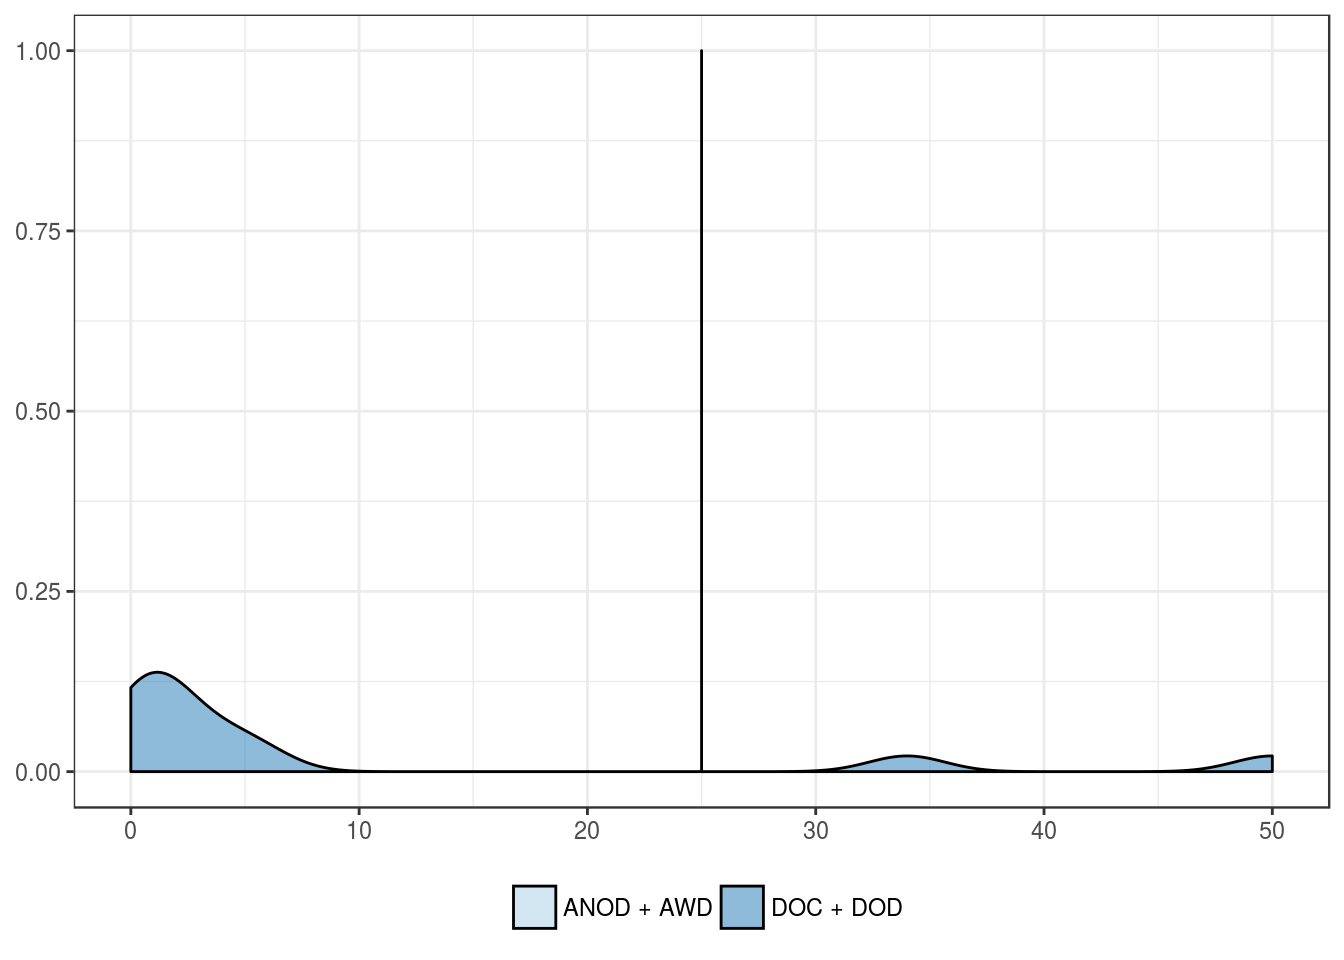
Overall mortality
| ANOD + AWD | DOC + DOD | |
|---|---|---|
| Mean | 49.1 | 17.9 |
| Standard deviation | 34.2 | 29.7 |
| Median | 64.0 | 8.0 |
| Interquartile range | 42.0 | 16.5 |
| Minimum | 4.0 | 0.0 |
| Maximum | 96.0 | 150.0 |
| Value | |
|---|---|
| U-statistic | 176 |
| P statistic | 3.3e-02 |
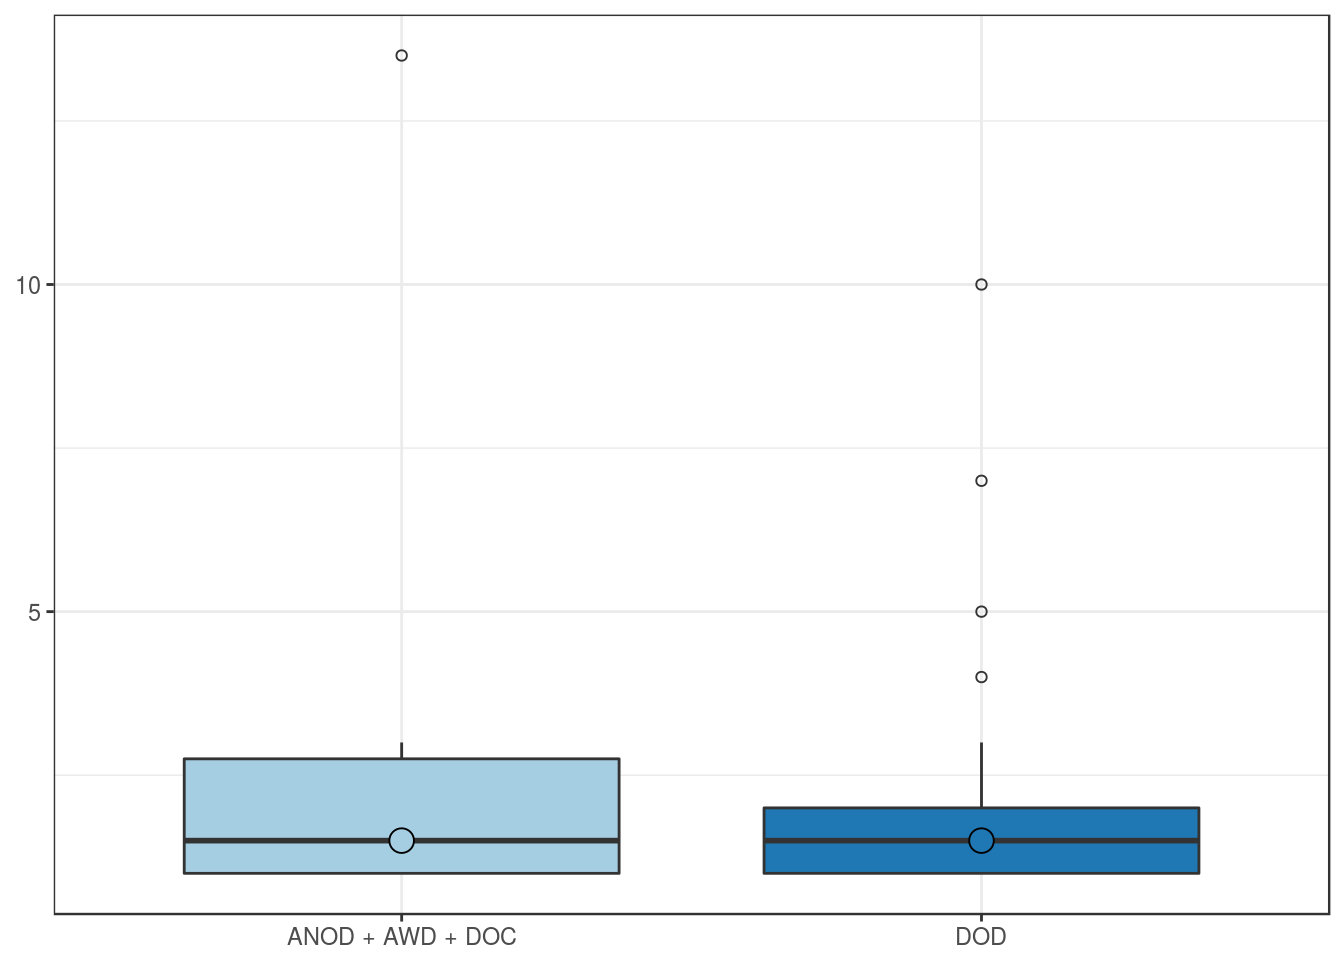
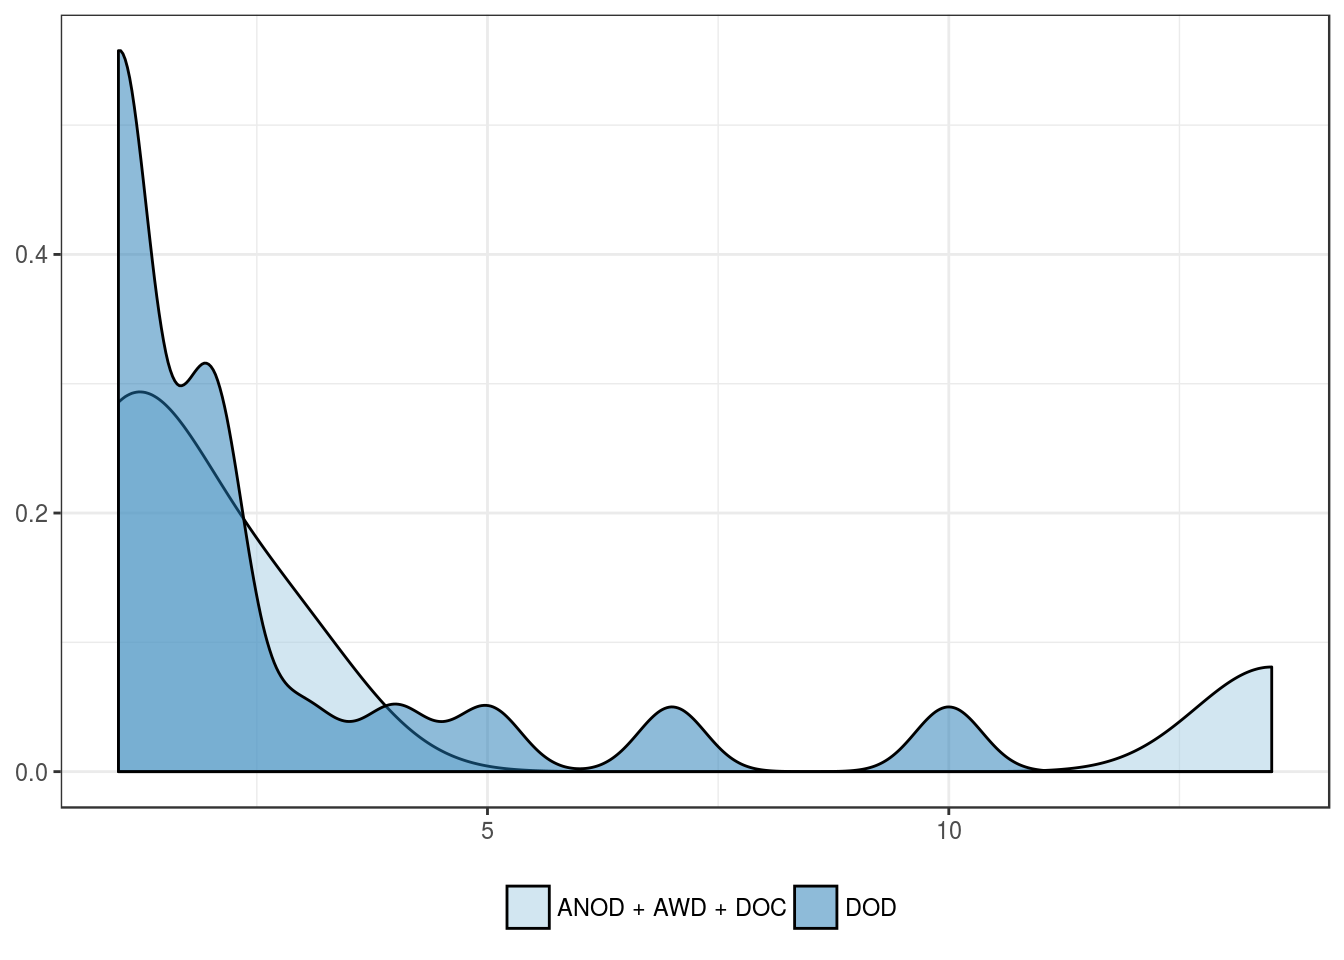
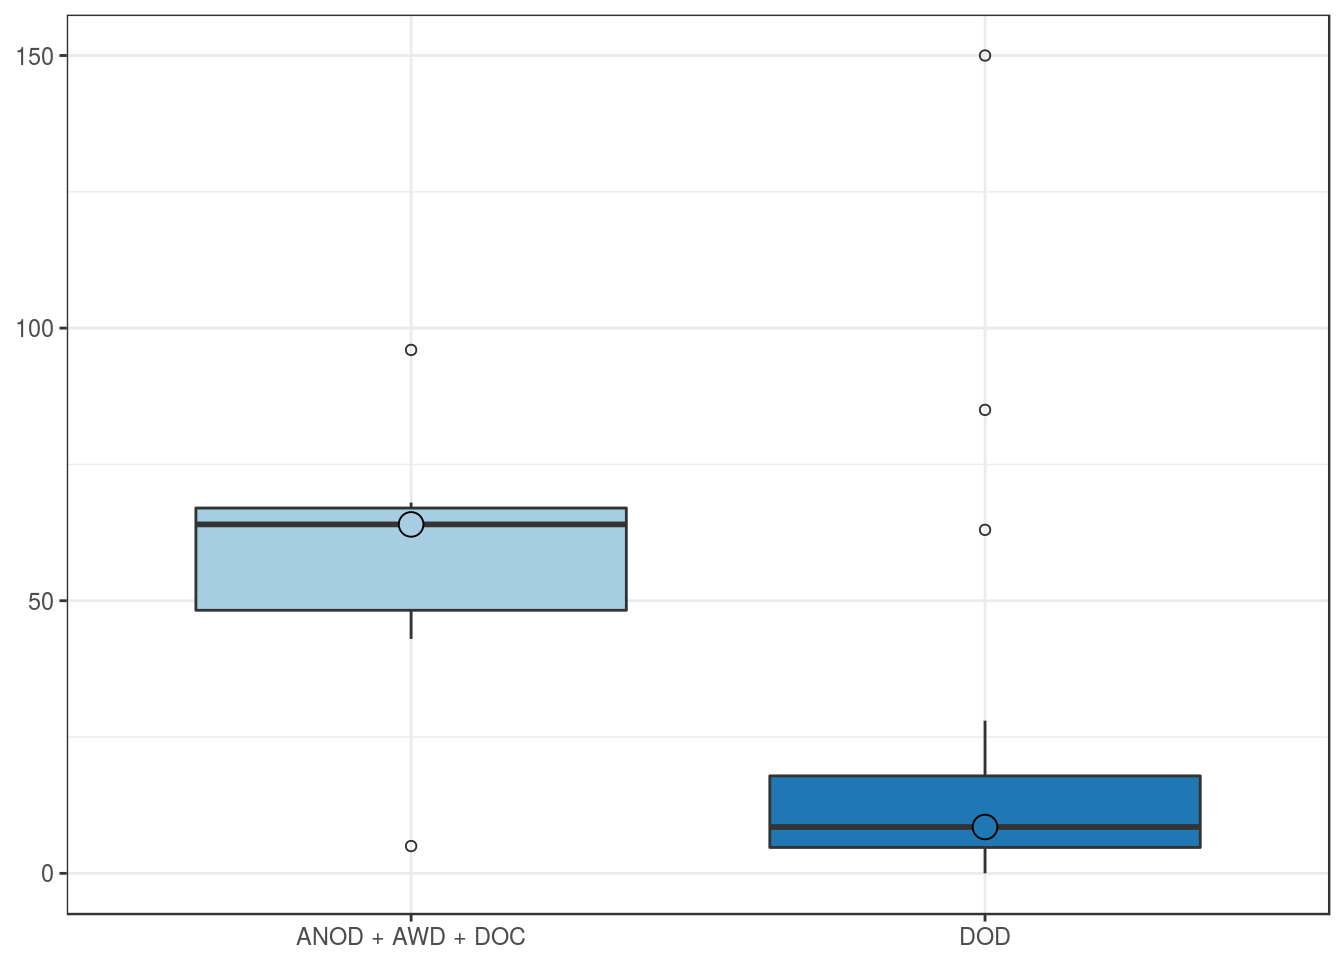
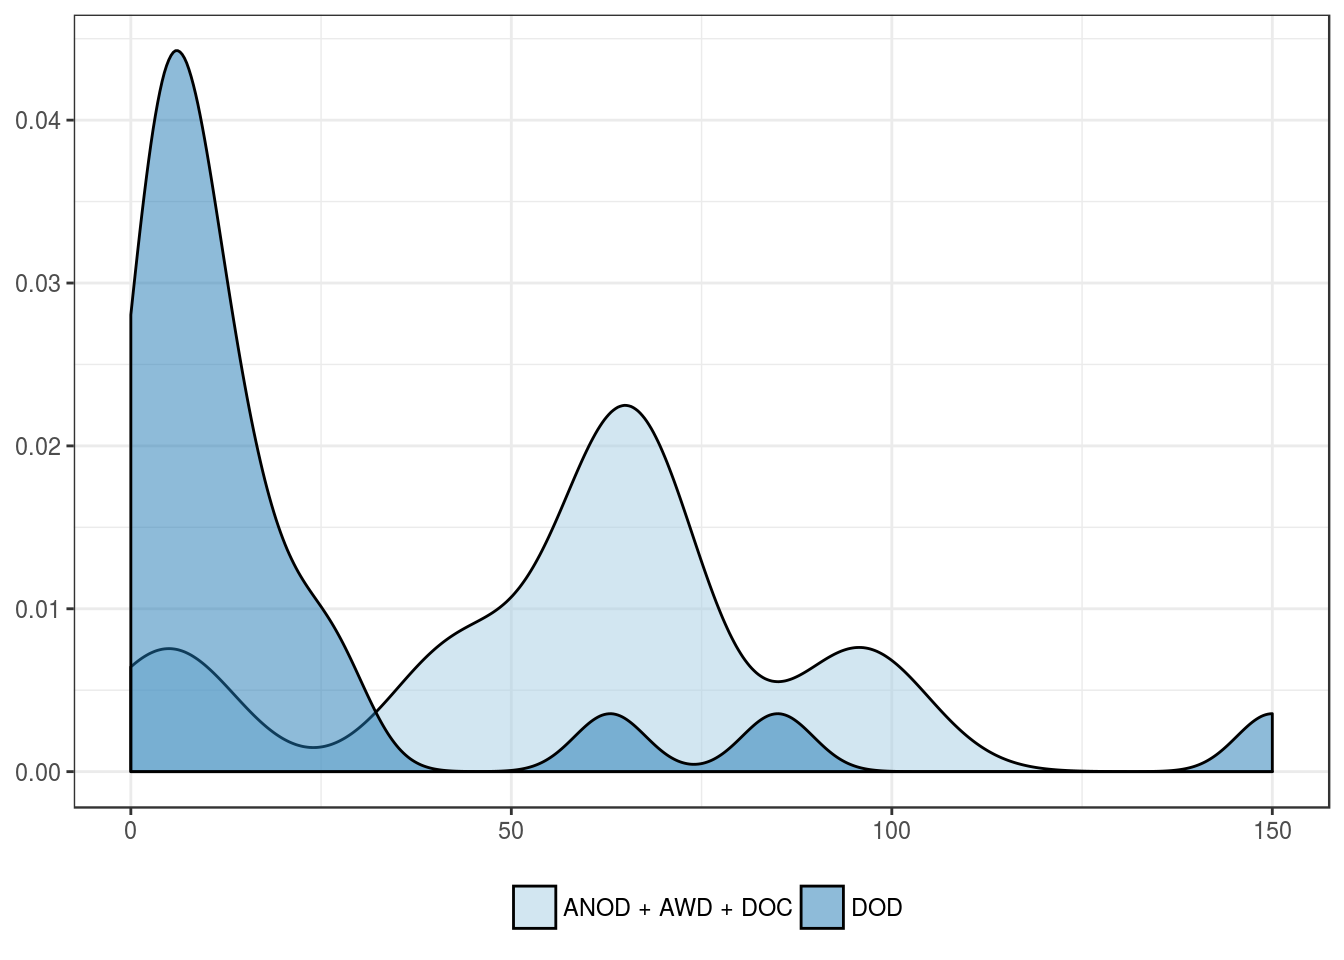
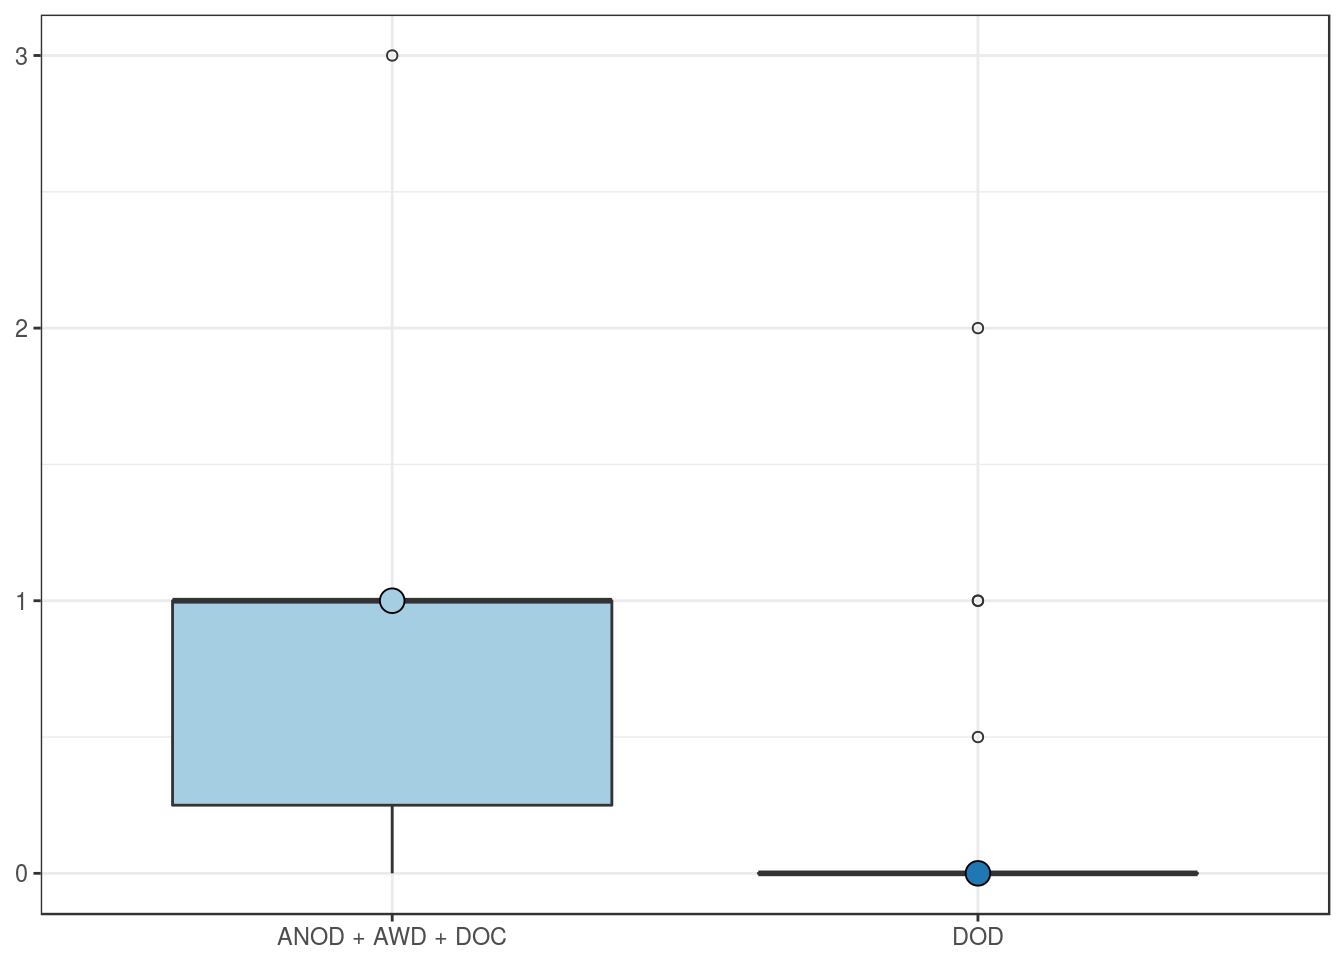
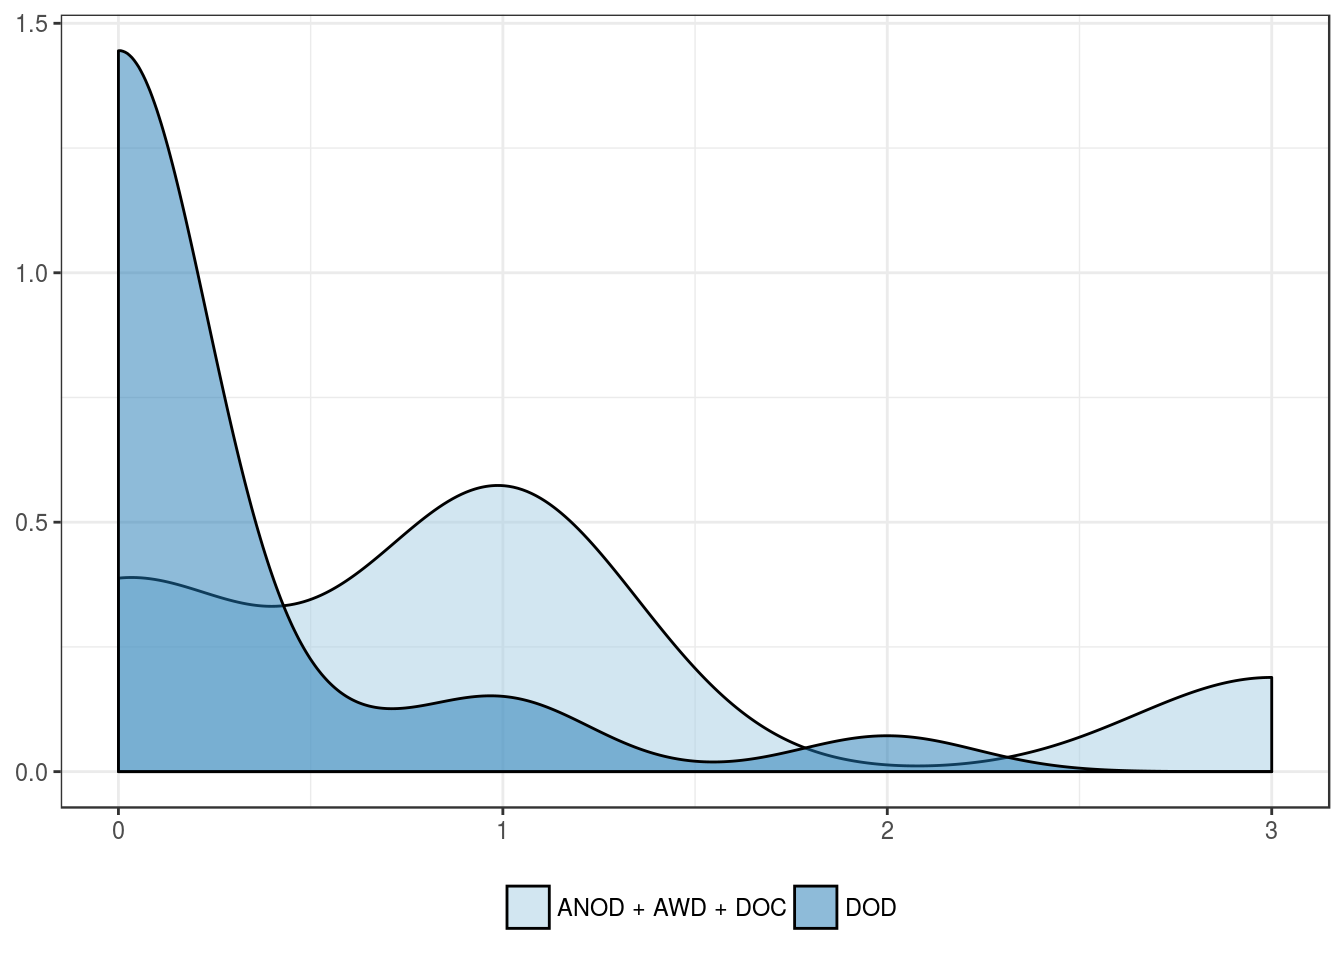
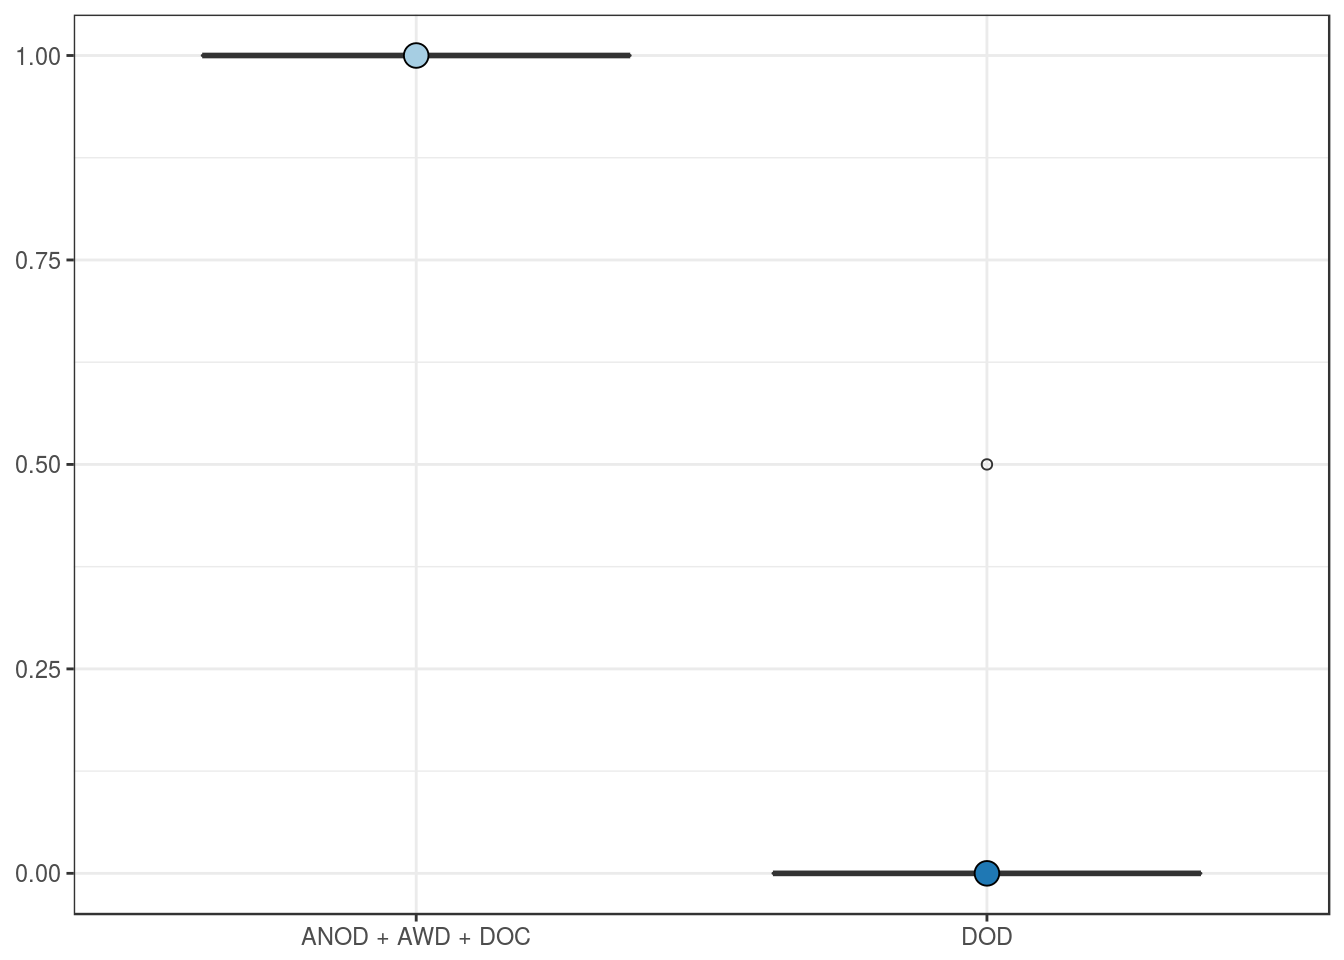
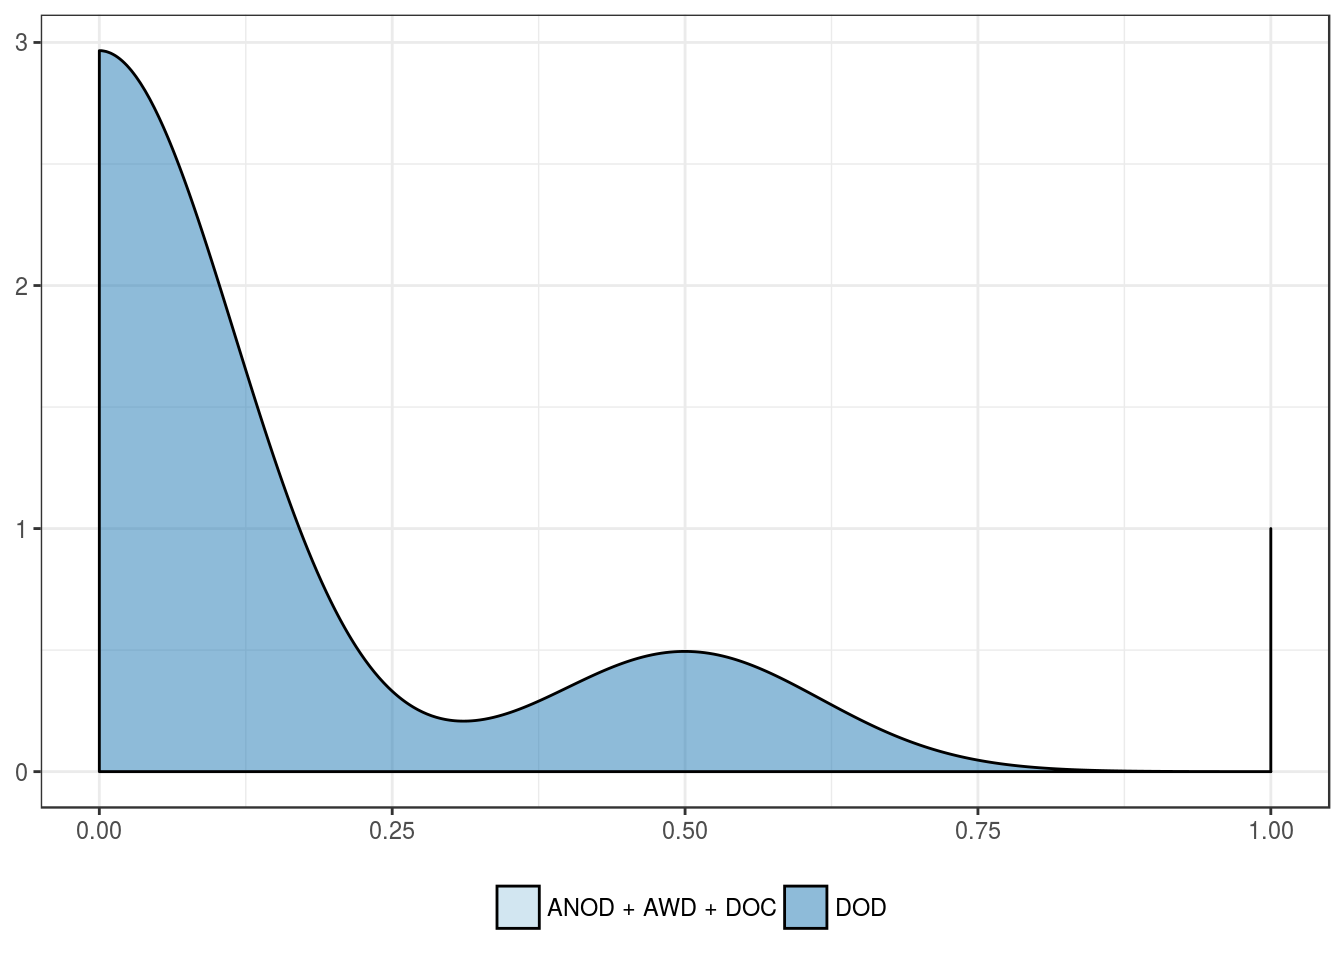
Cancer-related mortality
| ANOD + AWD + DOC | DOD | |
|---|---|---|
| Mean | 56.7 | 20.8 |
| Standard deviation | 30.5 | 33.9 |
| Median | 64.0 | 8.5 |
| Interquartile range | 18.8 | 13.1 |
| Minimum | 5.0 | 0.0 |
| Maximum | 96.0 | 150.0 |
| Value | |
|---|---|
| U-statistic | 116 |
| P statistic | 2.2e-02 |
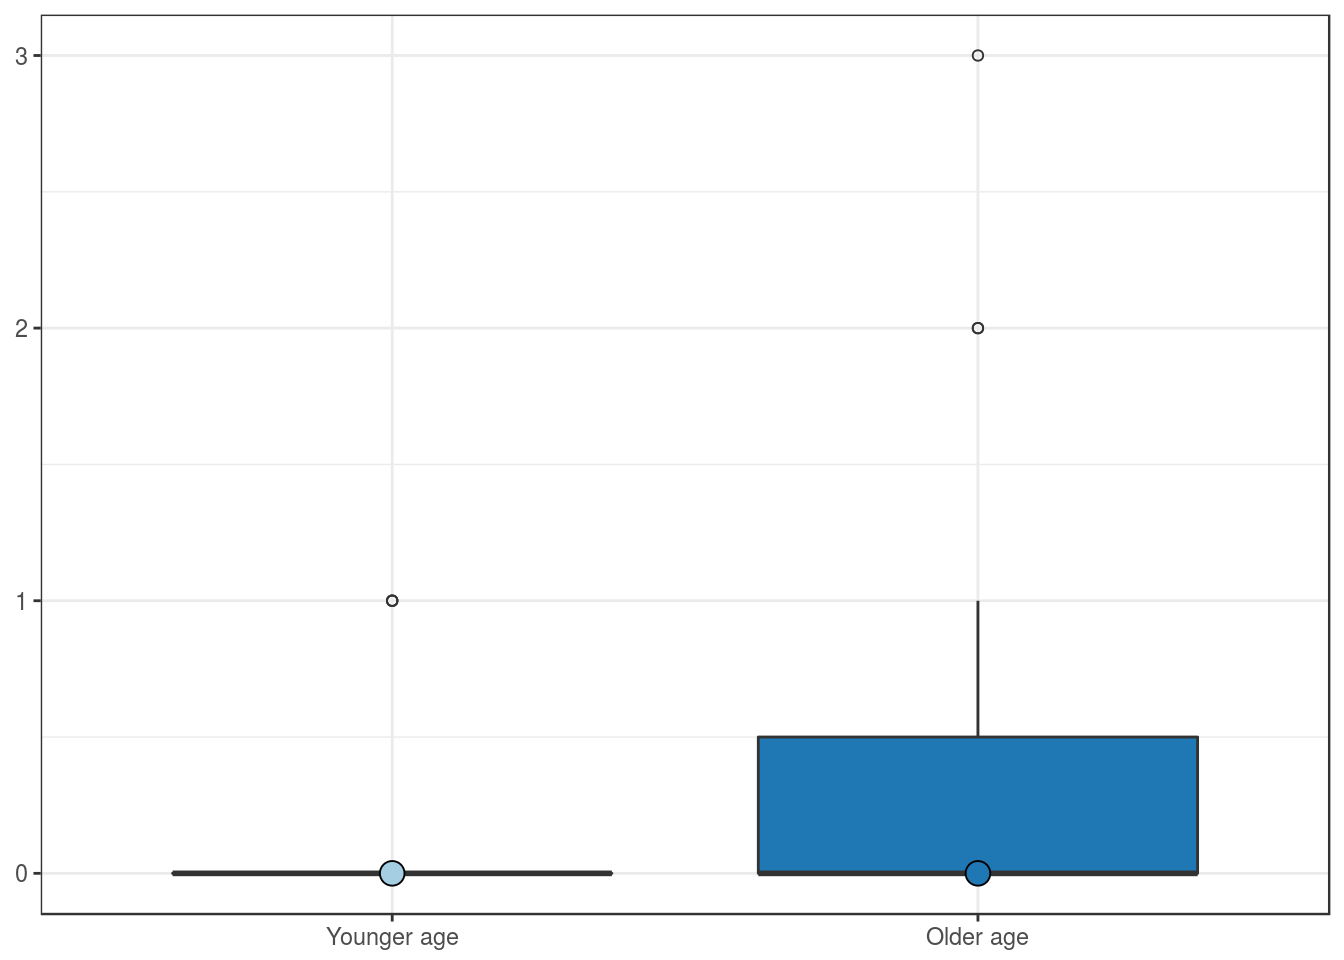
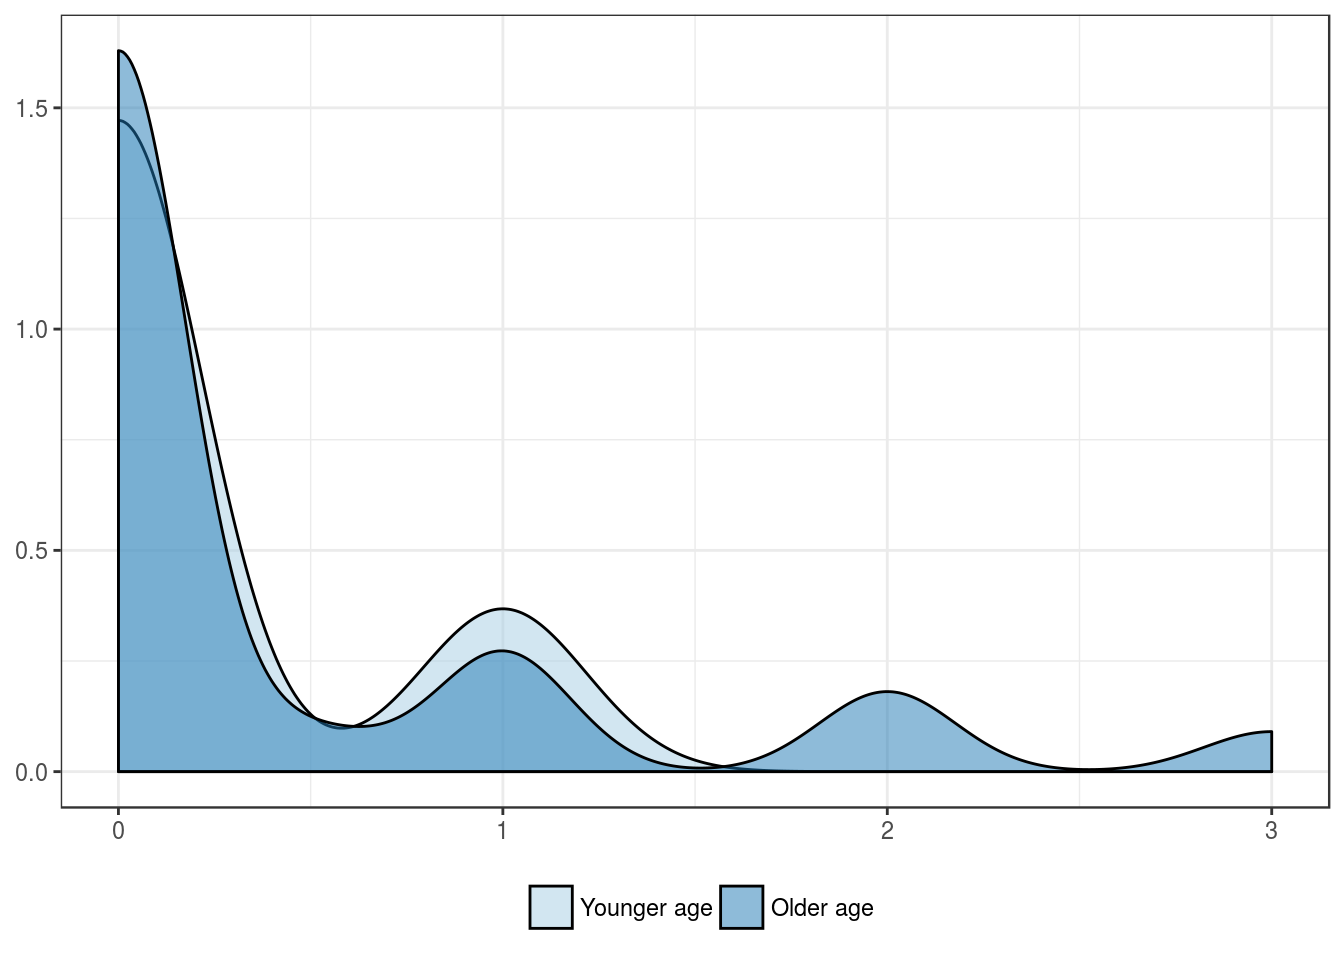
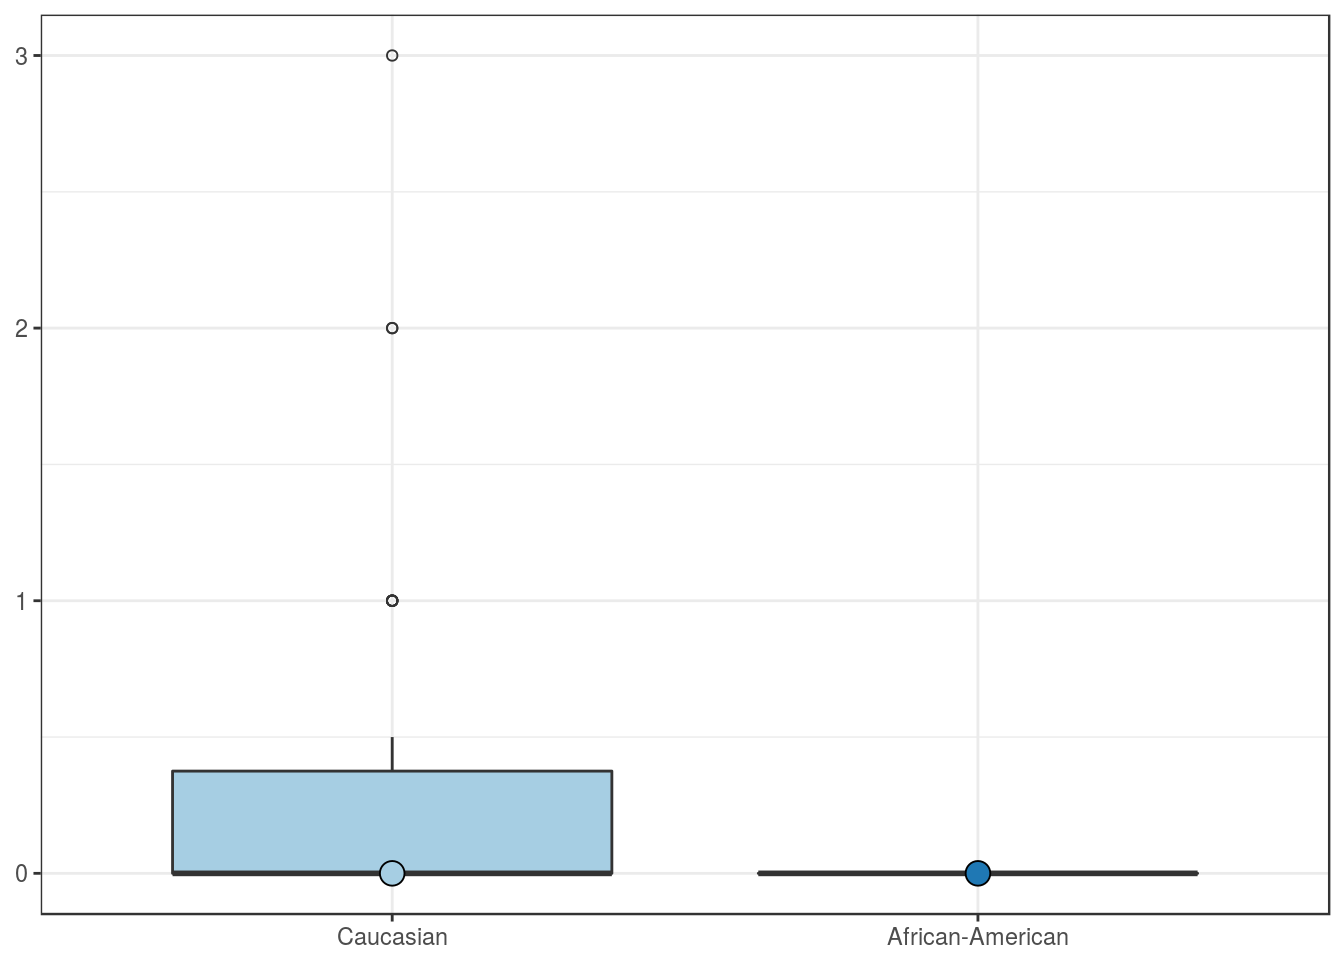
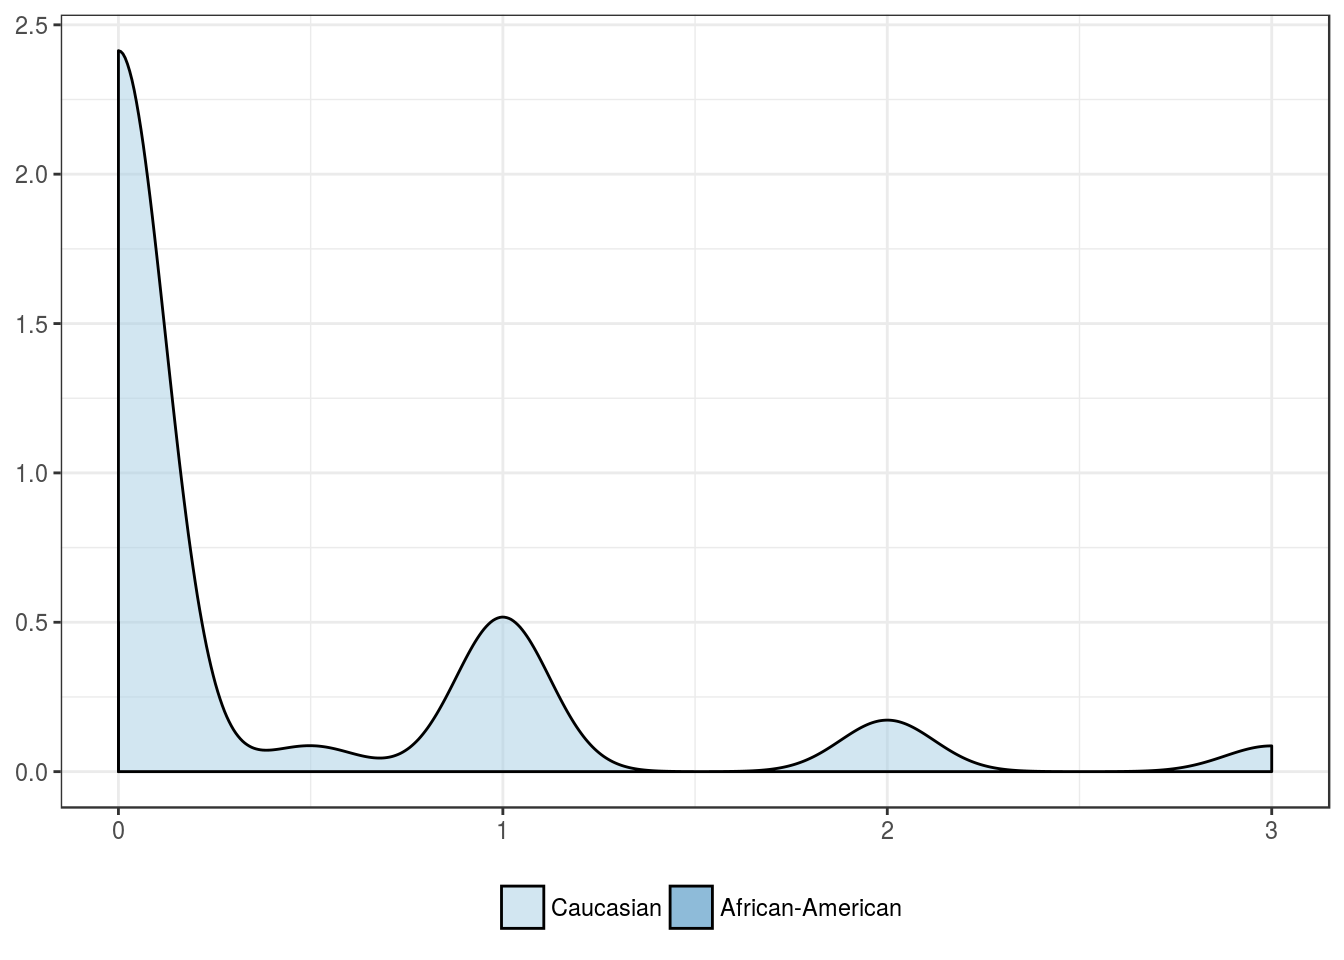
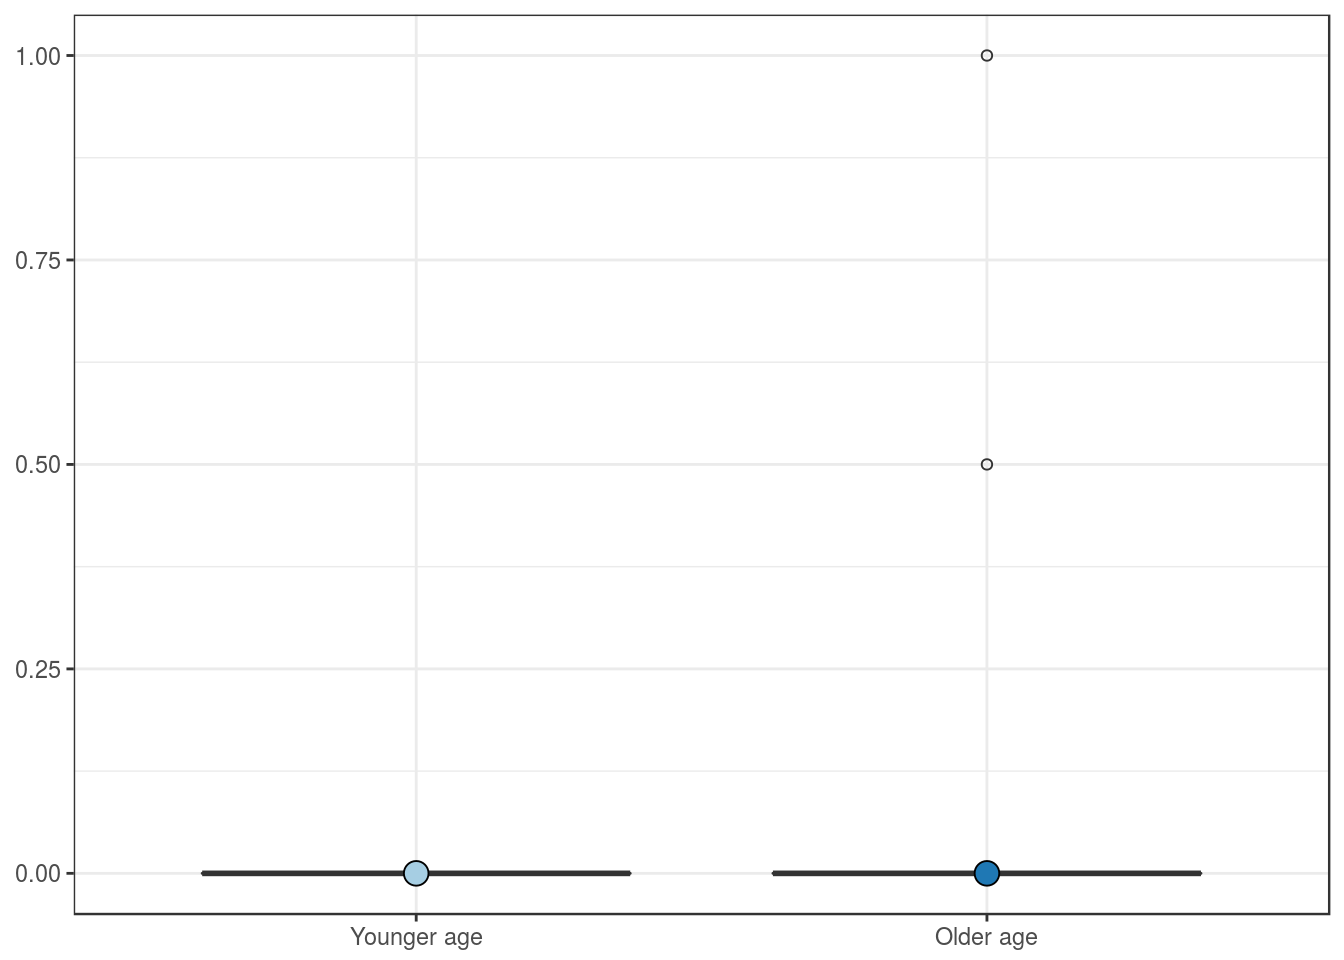
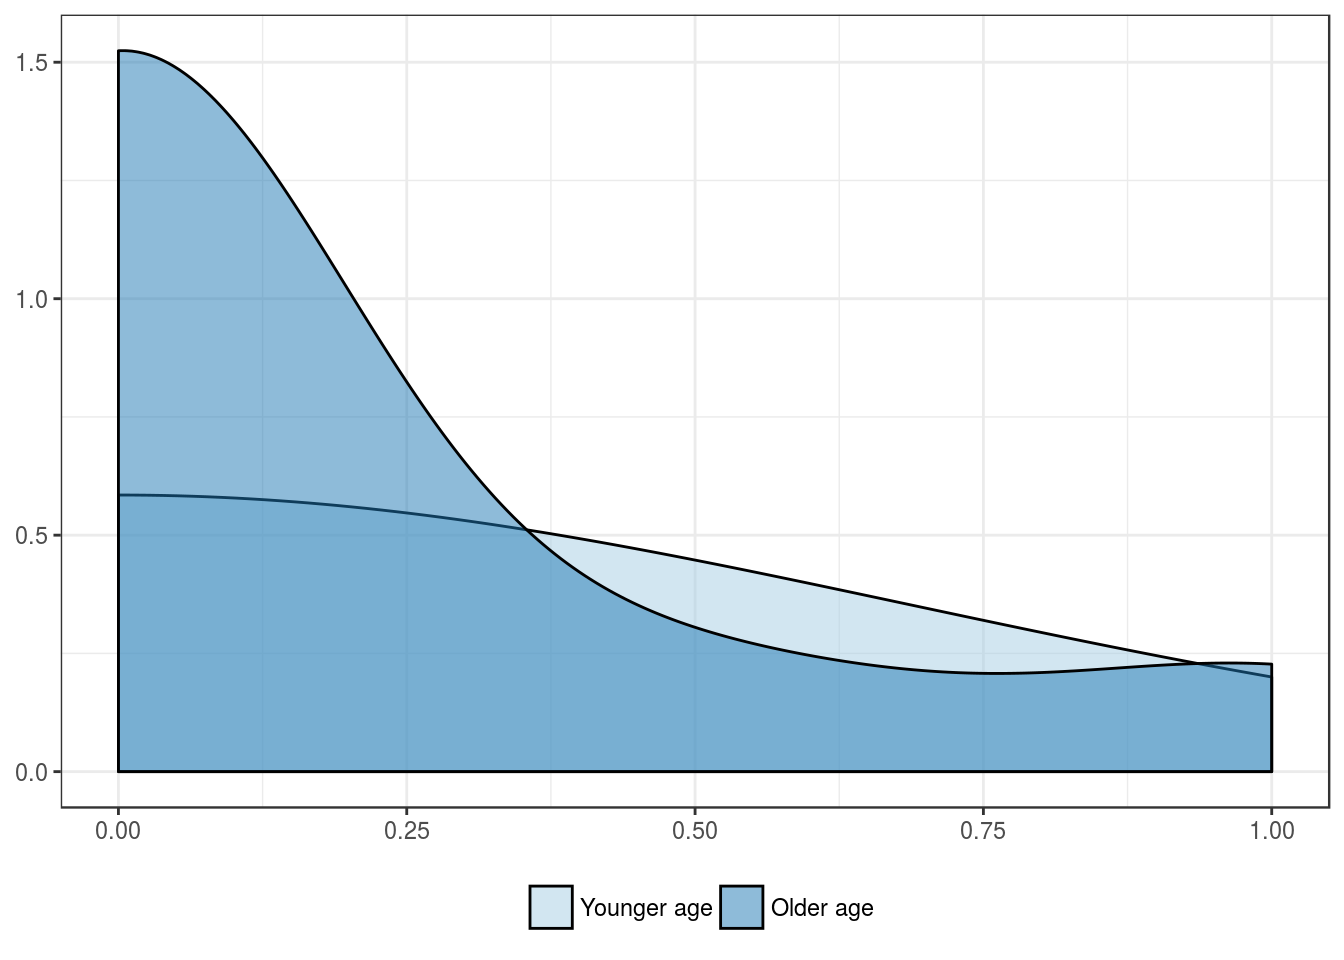
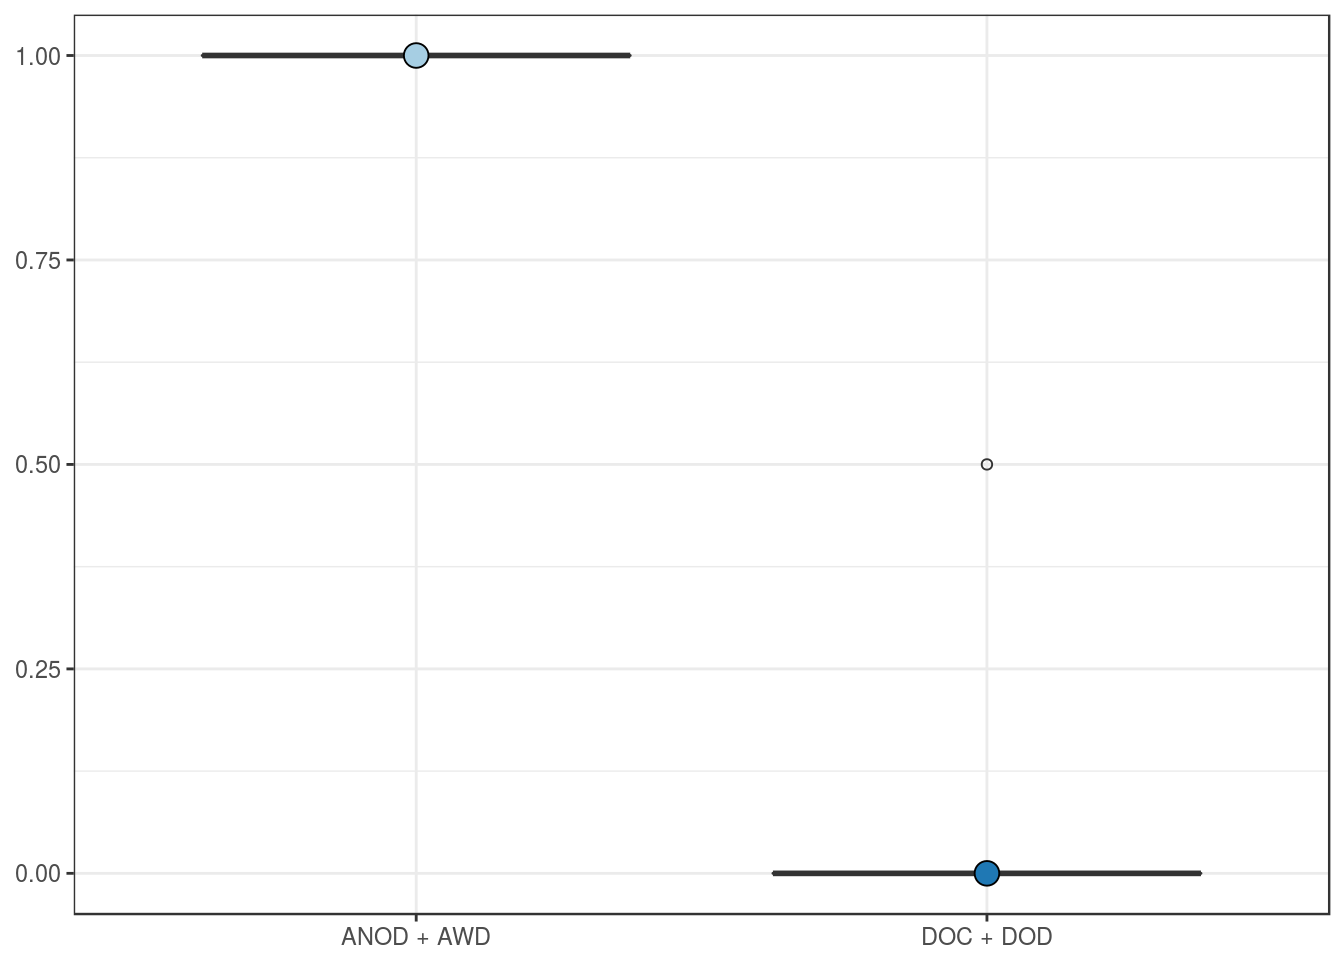
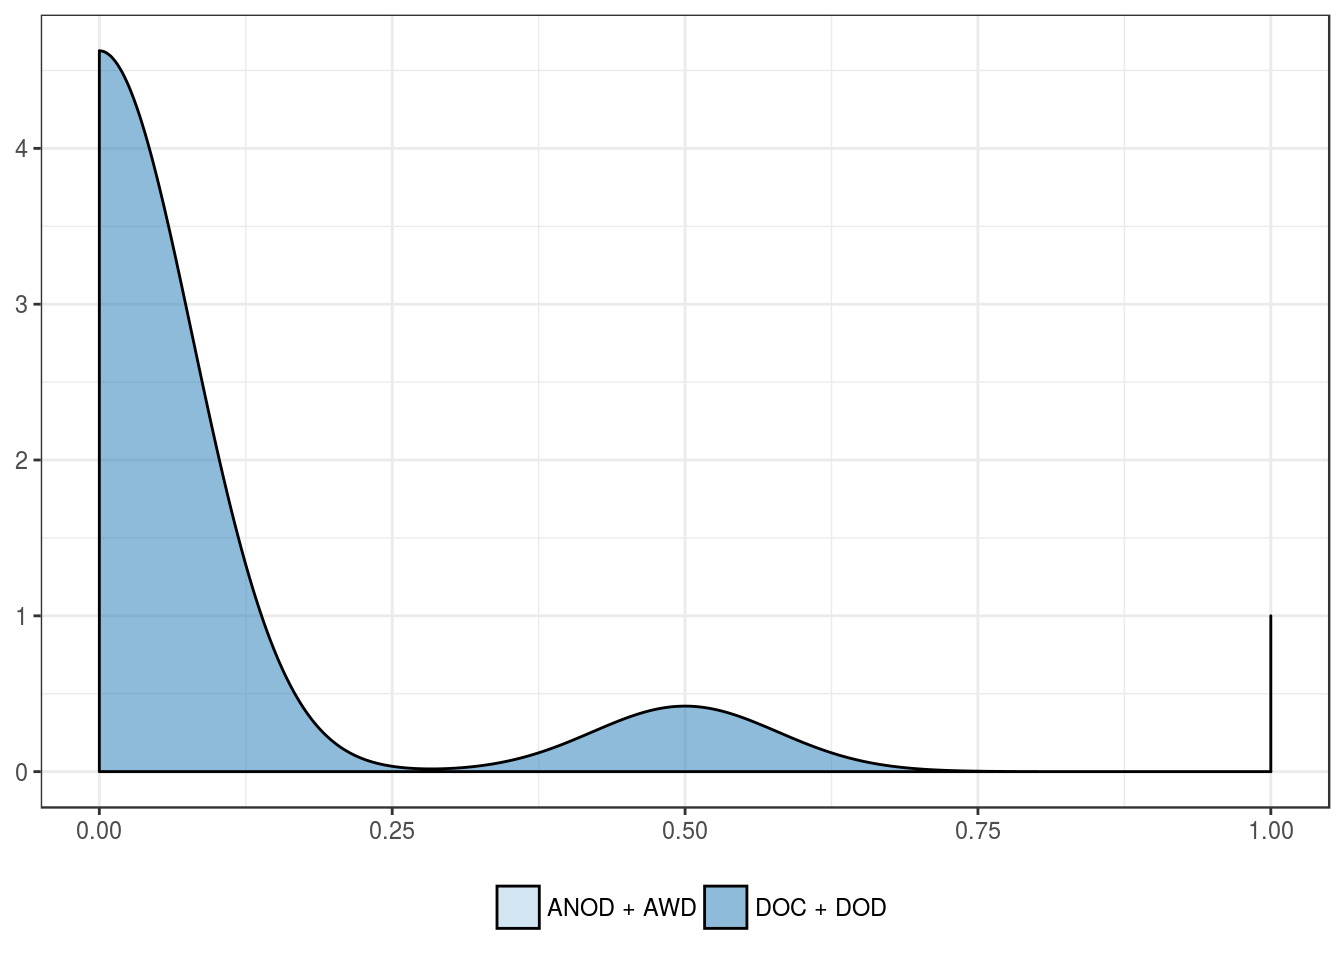
CD8–Ki67 positivity in intratumoral lymphocytes
Clinical features
Patients’ age group, in years
| Younger age | Older age | |
|---|---|---|
| Mean | 0.2 | 0.4 |
| Standard deviation | 0.4 | 0.8 |
| Median | 0.0 | 0.0 |
| Interquartile range | 0.0 | 0.5 |
| Minimum | 0.0 | 0.0 |
| Maximum | 1.0 | 3.0 |
| Value | |
|---|---|
| U-statistic | 170 |
| P statistic | 5.2e-01 |
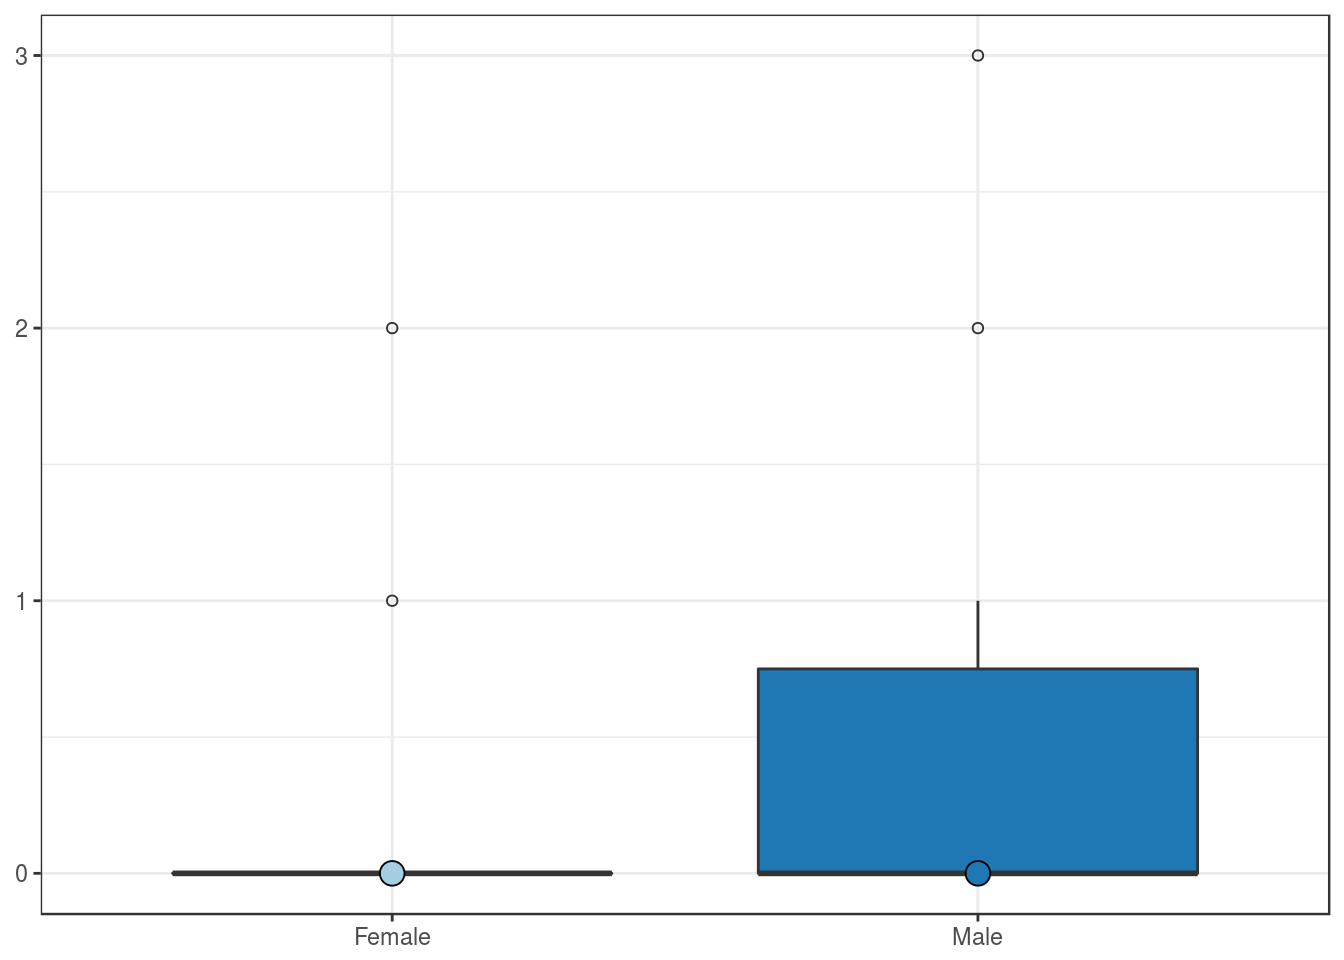
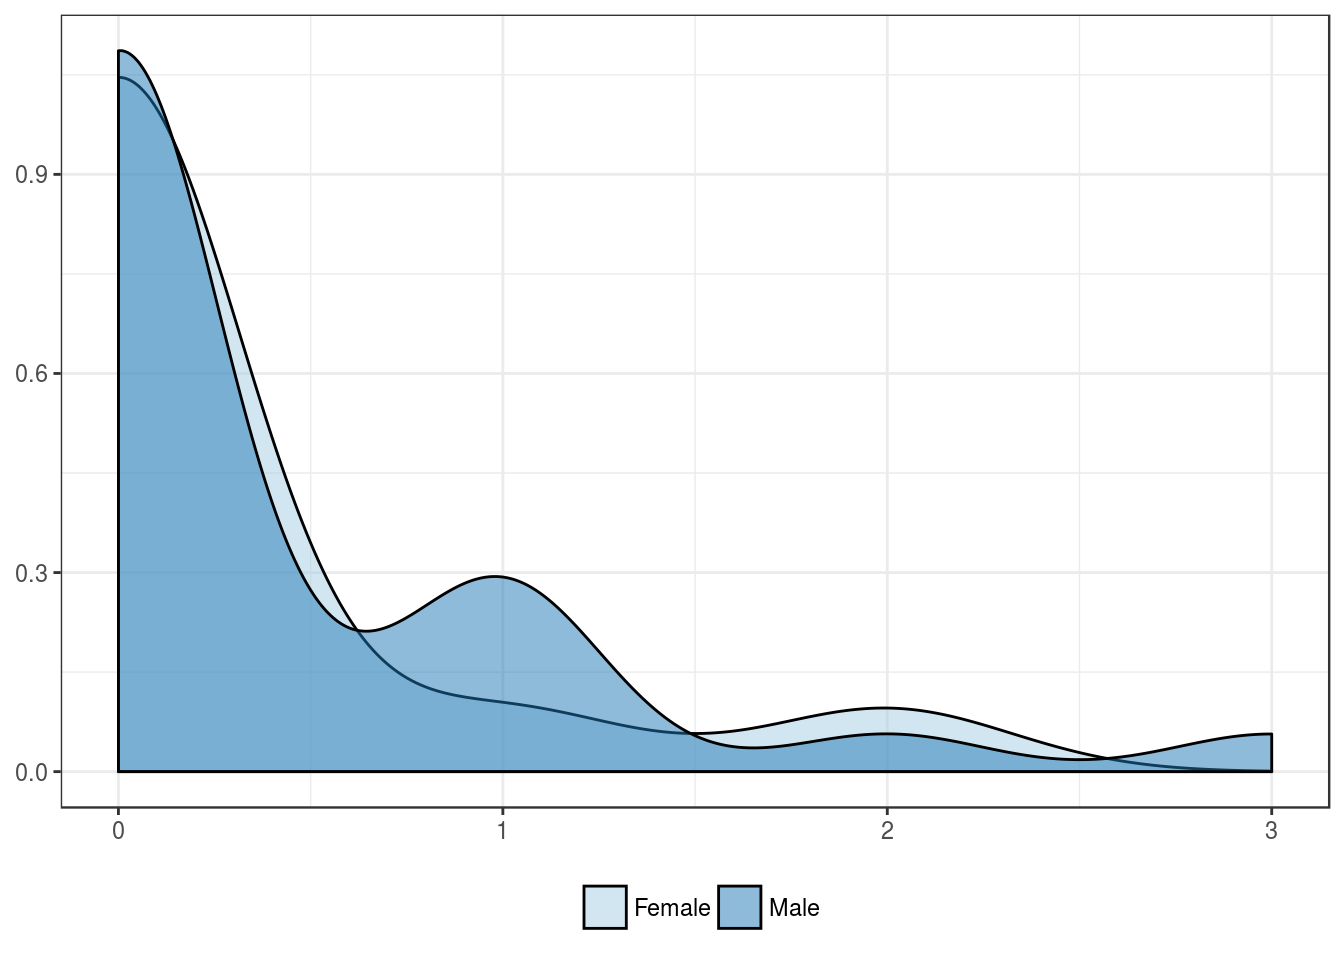
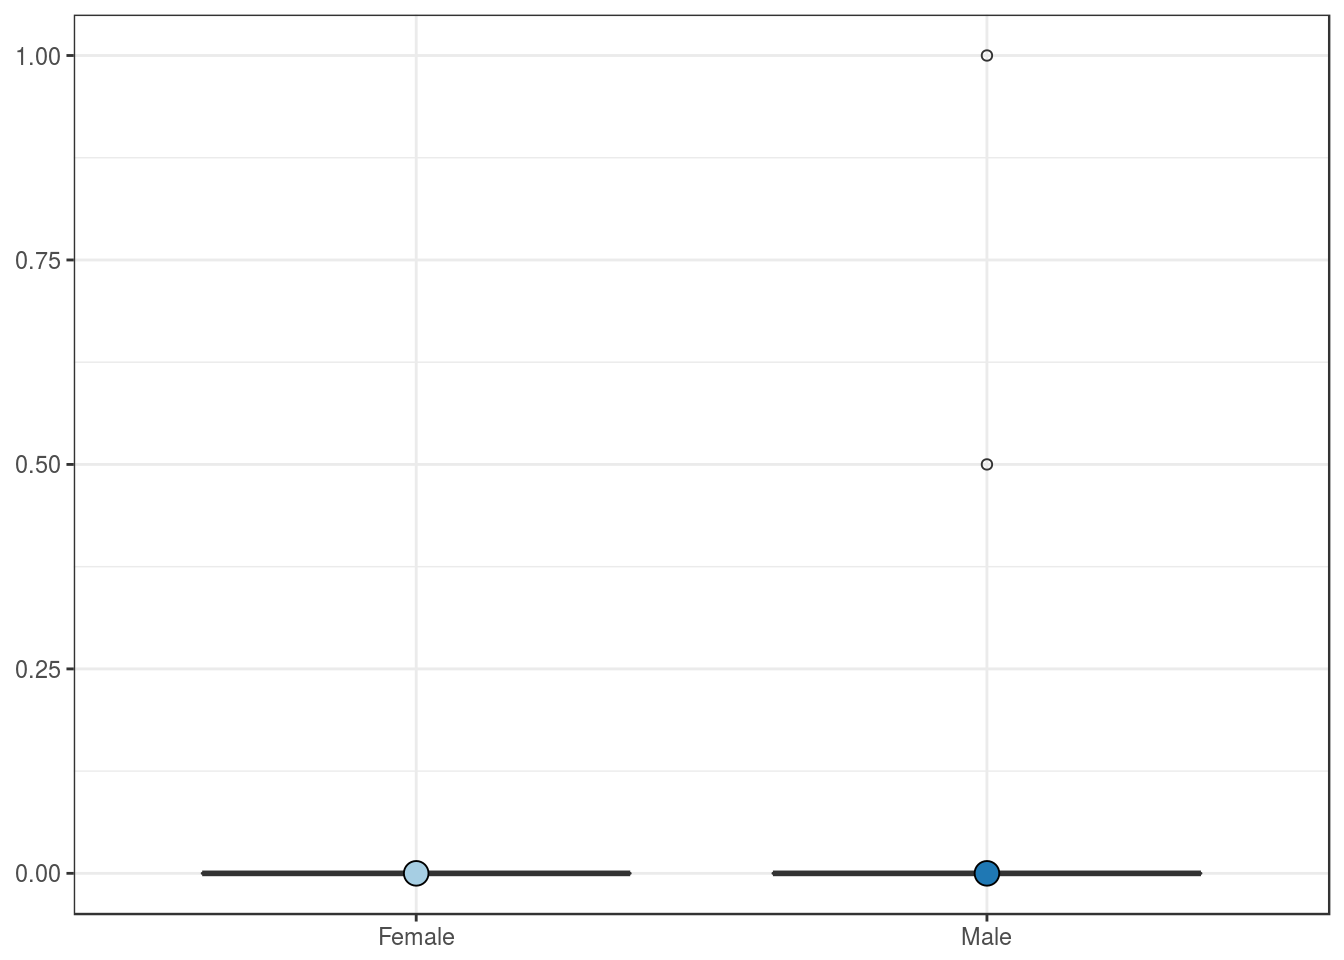
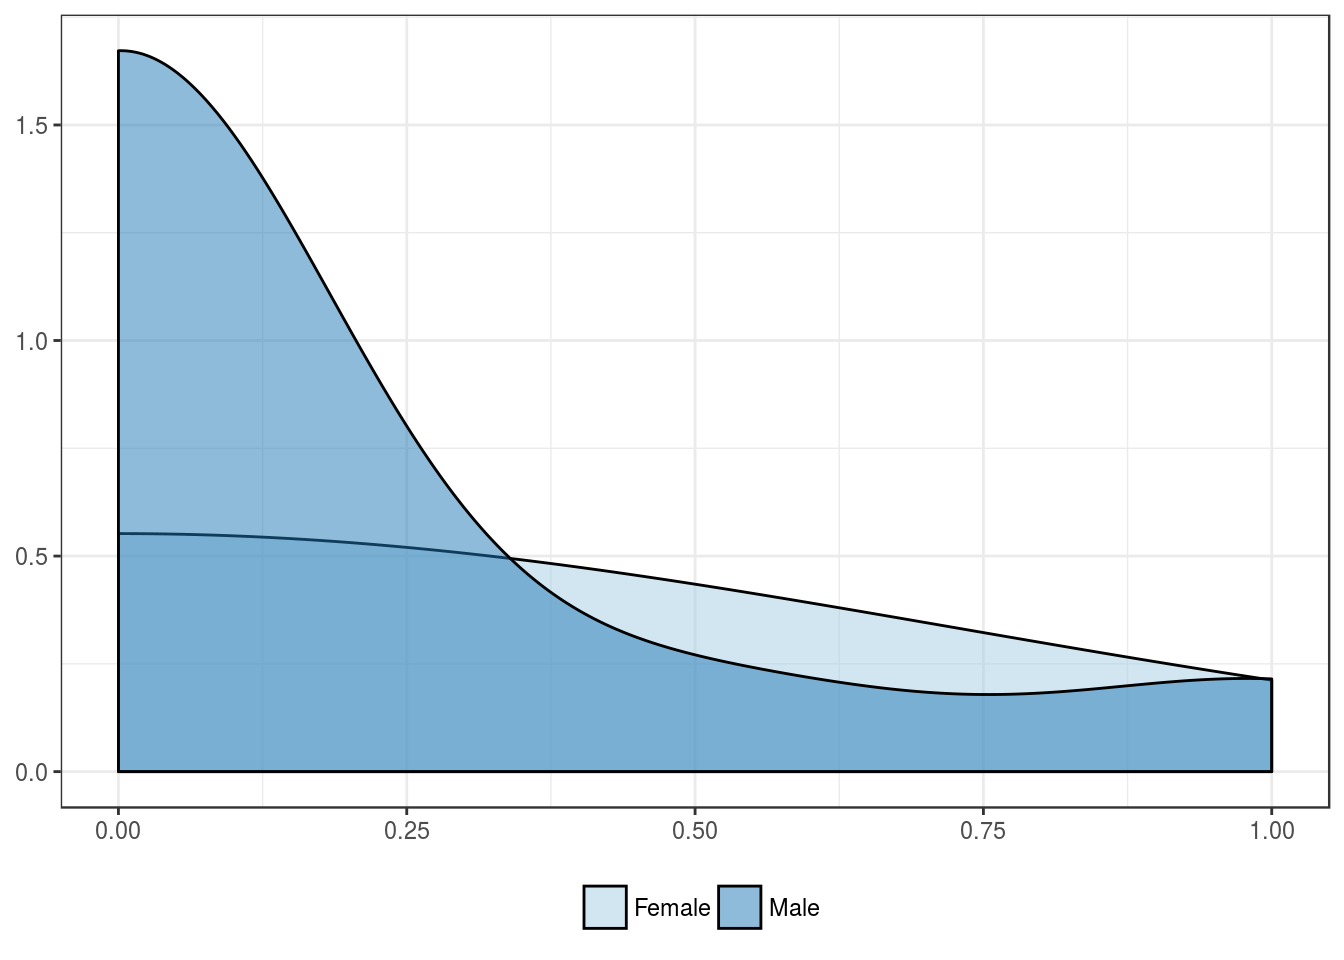
Patients’ sex
| Female | Male | |
|---|---|---|
| Mean | 0.2 | 0.4 |
| Standard deviation | 0.6 | 0.7 |
| Median | 0.0 | 0.0 |
| Interquartile range | 0.0 | 0.8 |
| Minimum | 0.0 | 0.0 |
| Maximum | 2.0 | 3.0 |
| Value | |
|---|---|
| U-statistic | 152 |
| P statistic | 3.9e-01 |
Patients’ race
| Caucasian | African-American | Asian | Other | |
|---|---|---|---|---|
| Mean | 0.4 | 0 | NA | NA |
| Standard deviation | 0.7 | 0 | NA | NA |
| Median | 0.0 | 0 | NA | NA |
| Interquartile range | 0.4 | 0 | NA | NA |
| Minimum | 0.0 | 0 | NA | NA |
| Maximum | 3.0 | 0 | NA | NA |
| Value | |
|---|---|
| Statistic | 0.6698 |
| Parameter | 1 |
| P statistic | 0.41 |
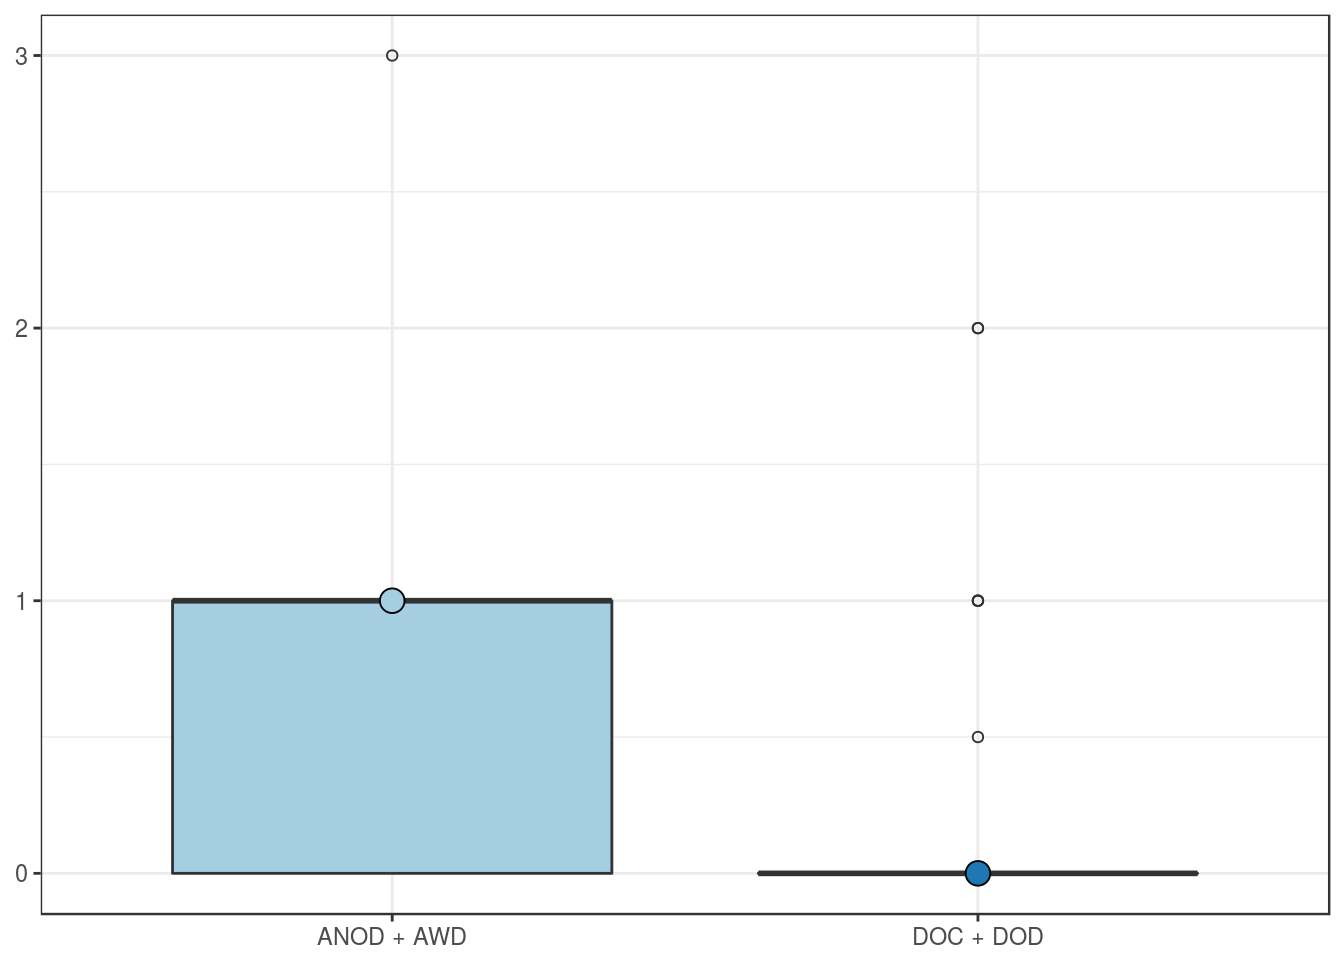
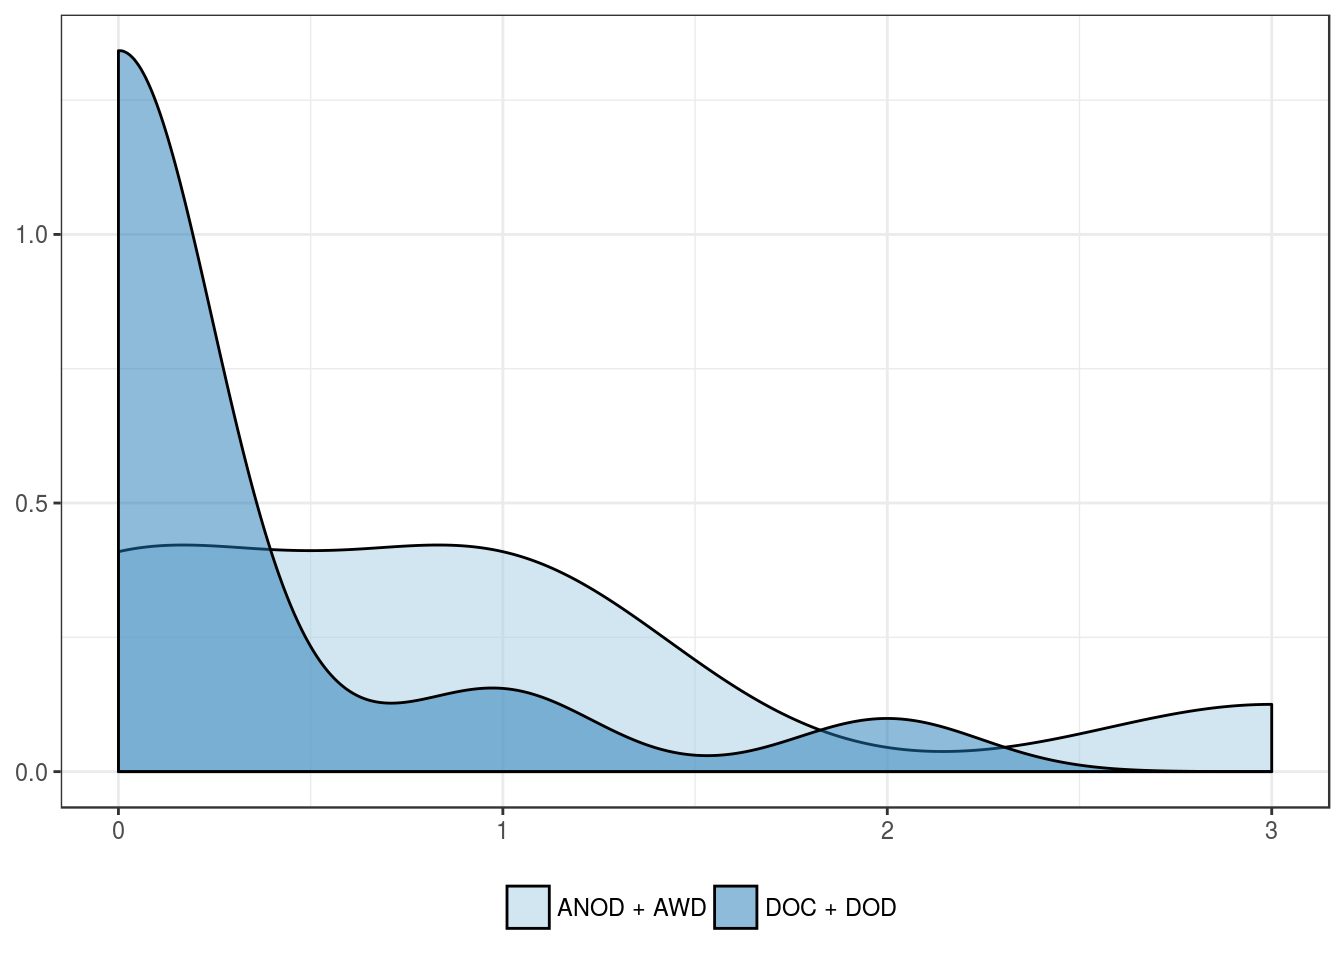
Outcome features
Overall mortality
| ANOD + AWD | DOC + DOD | |
|---|---|---|
| Mean | 0.9 | 0.2 |
| Standard deviation | 1.1 | 0.5 |
| Median | 1.0 | 0.0 |
| Interquartile range | 1.0 | 0.0 |
| Minimum | 0.0 | 0.0 |
| Maximum | 3.0 | 2.0 |
| Value | |
|---|---|
| U-statistic | 162 |
| P statistic | 3.1e-02 |
Cancer-related mortality
| ANOD + AWD + DOC | DOD | |
|---|---|---|
| Mean | 1.0 | 0.2 |
| Standard deviation | 1.1 | 0.5 |
| Median | 1.0 | 0.0 |
| Interquartile range | 0.8 | 0.0 |
| Minimum | 0.0 | 0.0 |
| Maximum | 3.0 | 2.0 |
| Value | |
|---|---|
| U-statistic | 110 |
| P statistic | 1.2e-02 |
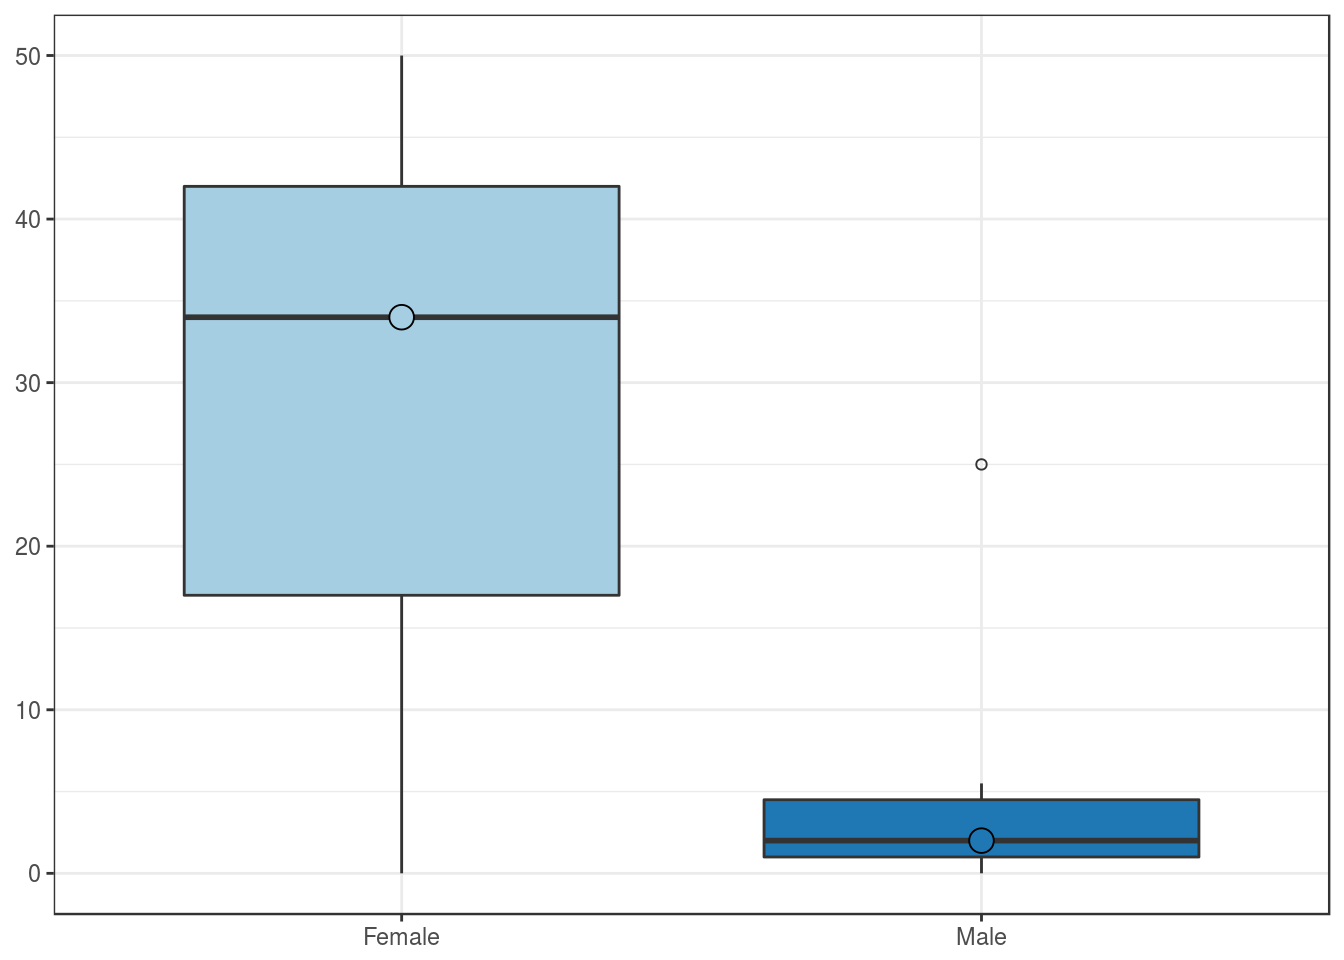
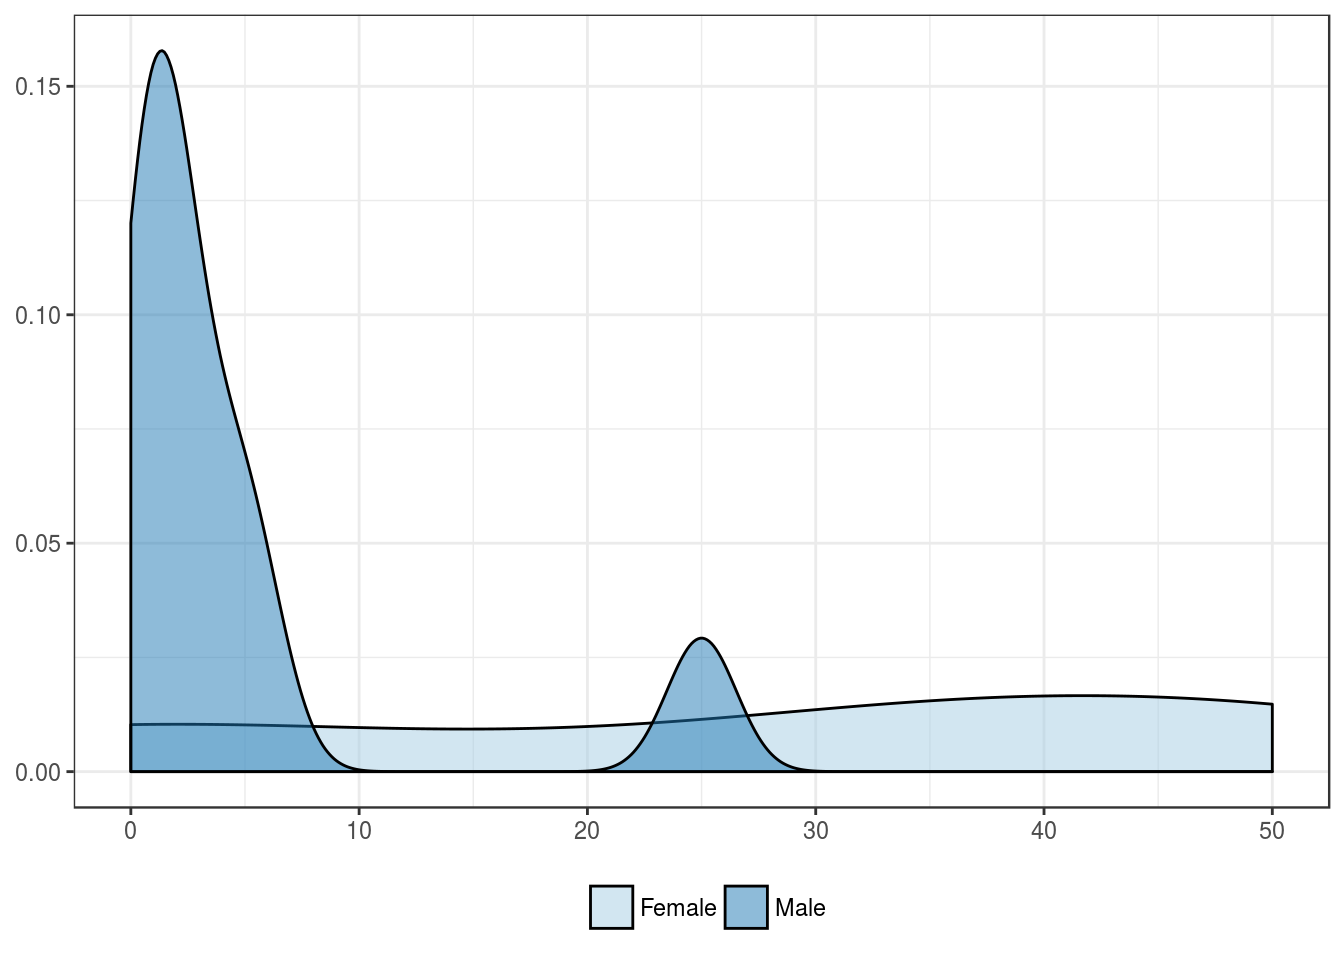
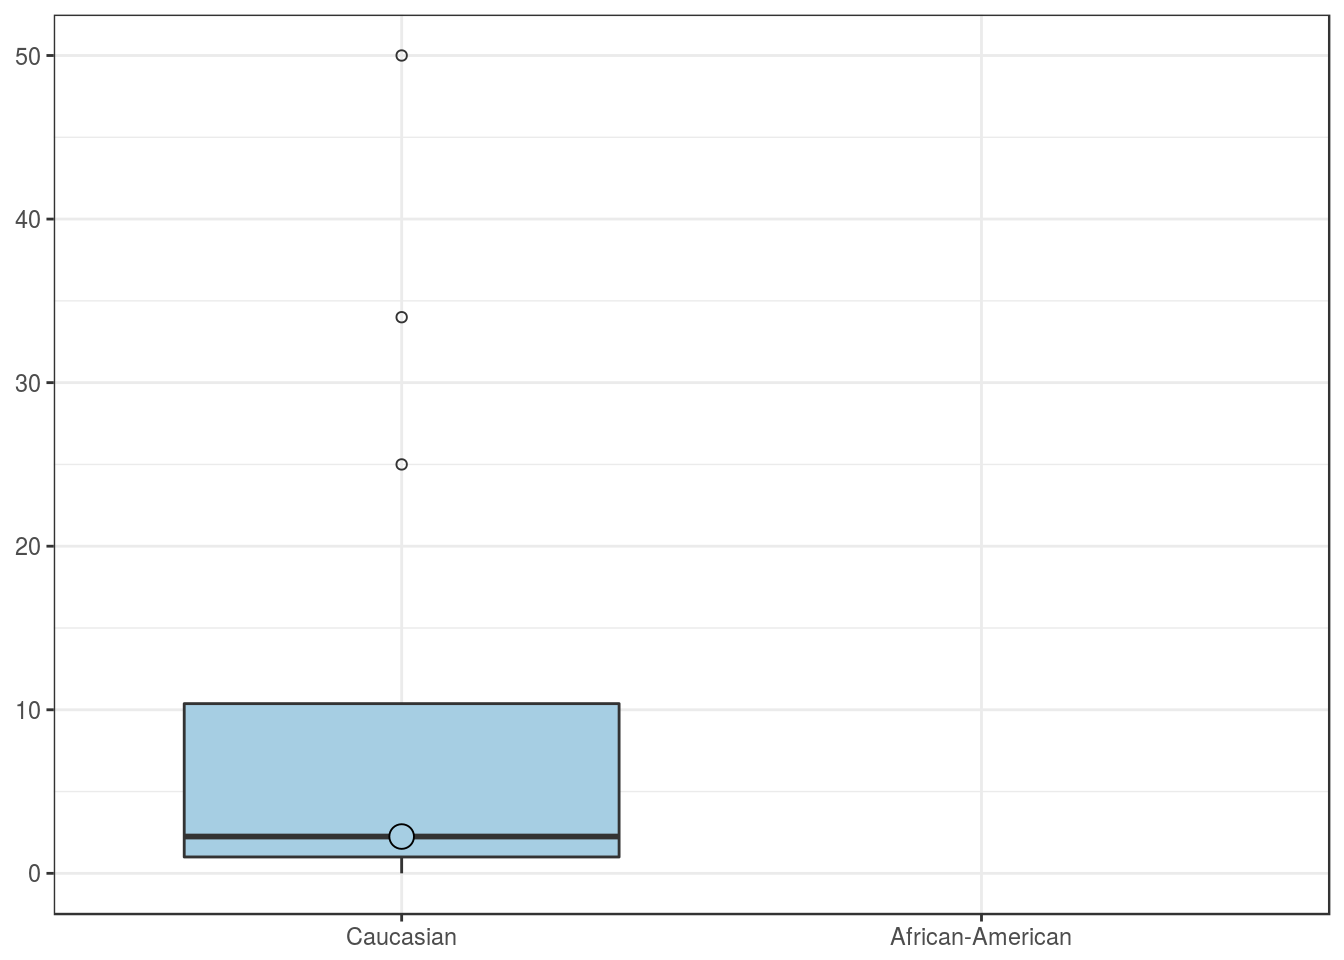
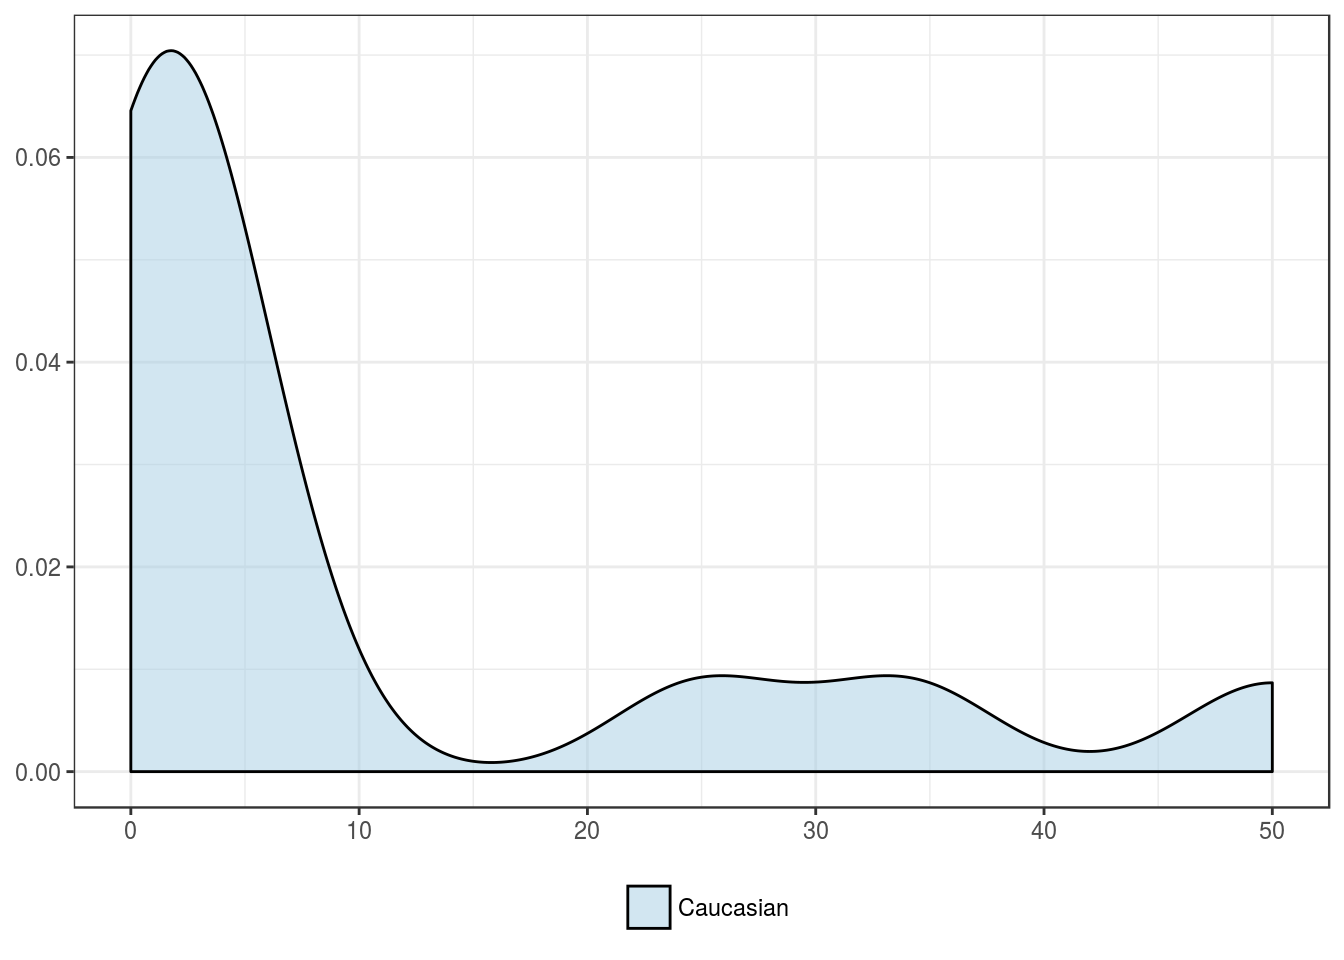
CD8 positivity in stromal lymphocytes
Clinical features
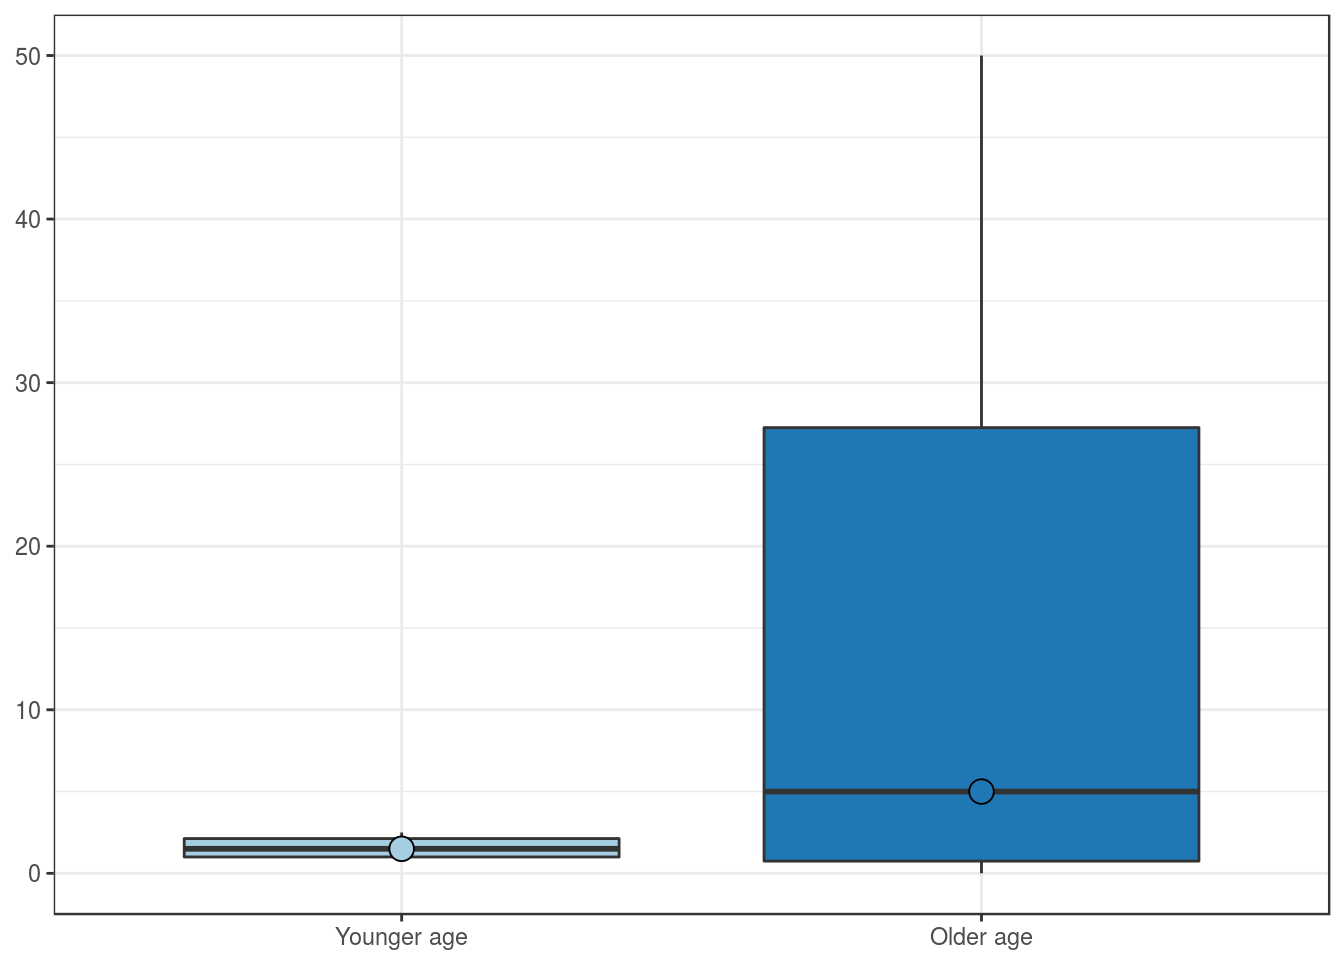
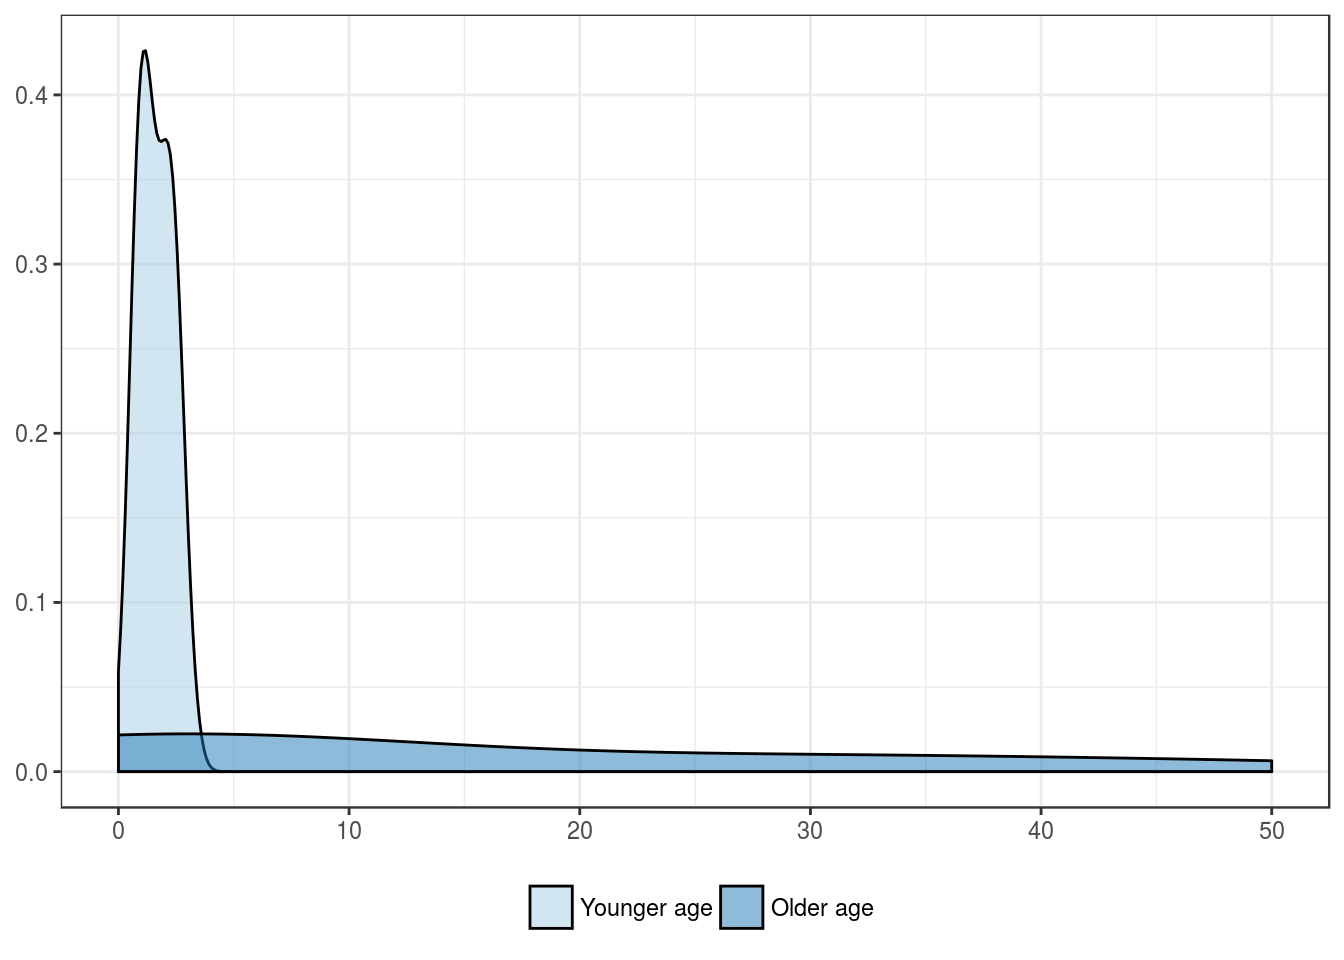
Patients’ age group, in years
| Younger age | Older age | |
|---|---|---|
| Mean | 1.6 | 15.0 |
| Standard deviation | 0.8 | 19.0 |
| Median | 1.5 | 5.0 |
| Interquartile range | 1.1 | 26.5 |
| Minimum | 1.0 | 0.0 |
| Maximum | 2.5 | 50.0 |
| Value | |
|---|---|
| U-statistic | 11 |
| P statistic | 4.4e-01 |
Patients’ sex
| Female | Male | |
|---|---|---|
| Mean | 28.0 | 4.7 |
| Standard deviation | 25.5 | 7.8 |
| Median | 34.0 | 2.0 |
| Interquartile range | 25.0 | 3.5 |
| Minimum | 0.0 | 0.0 |
| Maximum | 50.0 | 25.0 |
| Value | |
|---|---|
| U-statistic | 18.5 |
| P statistic | 4e-01 |
Patients’ race
| Caucasian | African-American | Asian | Other | |
|---|---|---|---|---|
| Mean | 10.5 | NaN | NA | NA |
| Standard deviation | 16.5 | NA | NA | NA |
| Median | 2.2 | NA | NA | NA |
| Interquartile range | 9.4 | NA | NA | NA |
| Minimum | 0.0 | Inf | NA | NA |
| Maximum | 50.0 | -Inf | NA | NA |
Outcome features
Overall mortality
| ANOD + AWD | DOC + DOD | |
|---|---|---|
| Mean | 25 | 9.2 |
| Standard deviation | NA | 16.7 |
| Median | 25 | 2.0 |
| Interquartile range | 0 | 4.0 |
| Minimum | 25 | 0.0 |
| Maximum | 25 | 50.0 |
| Value | |
|---|---|
| U-statistic | 9 |
| P statistic | 3.8e-01 |
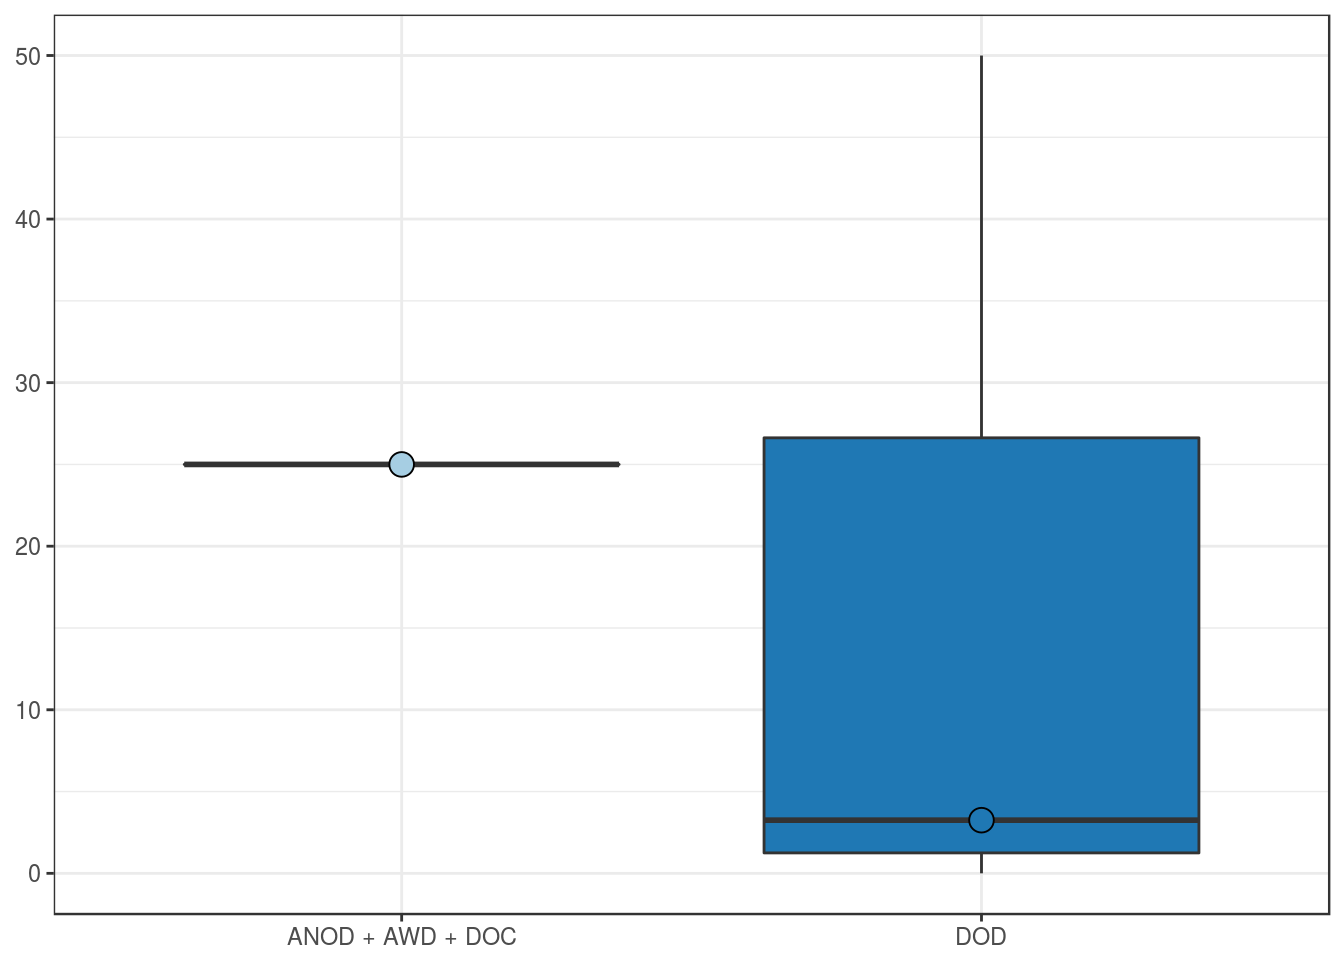
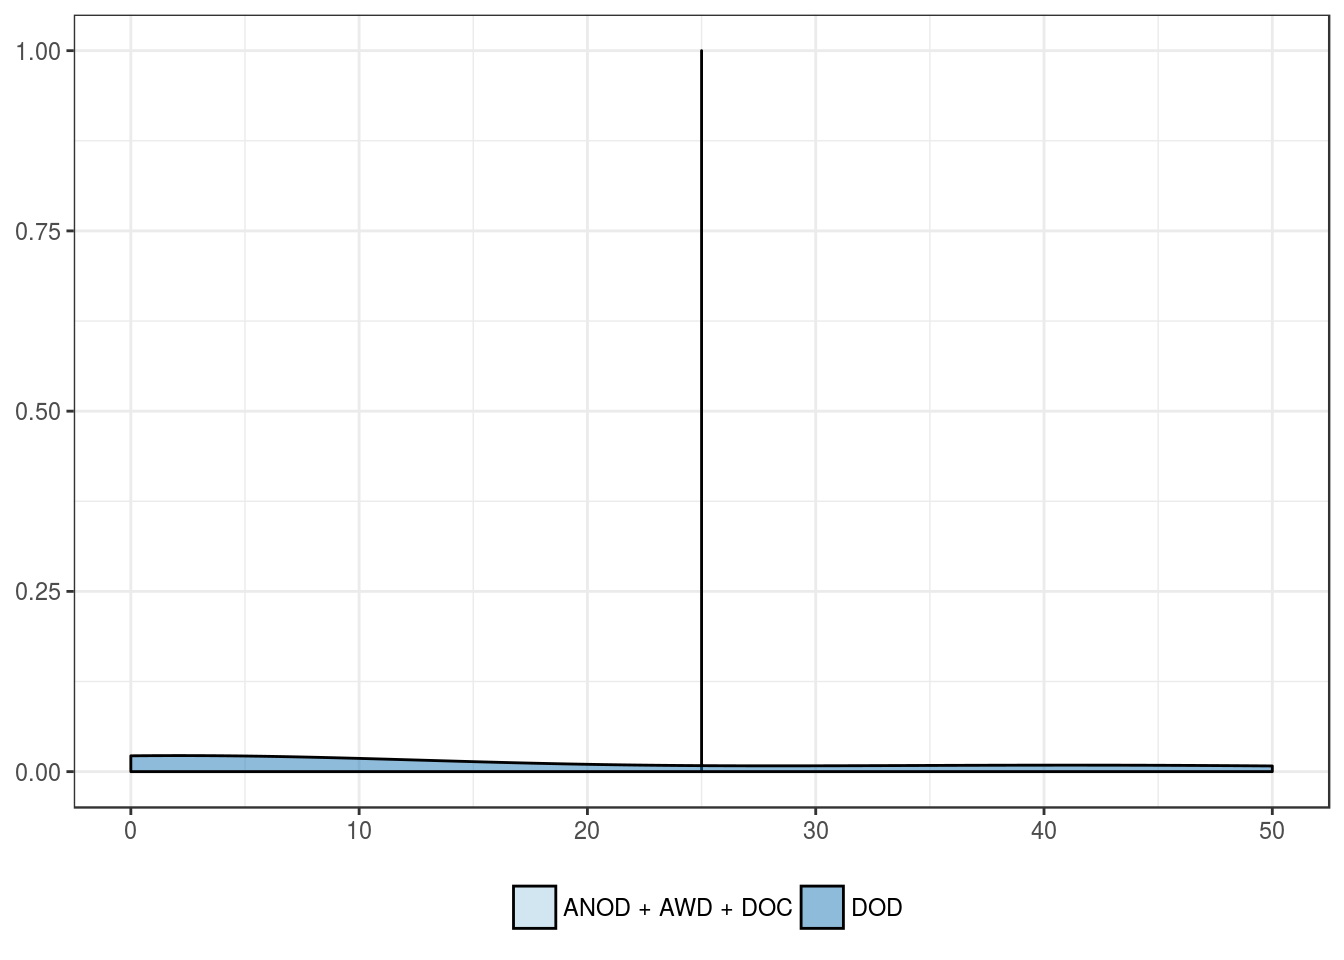
Cancer-related mortality
| ANOD + AWD + DOC | DOD | |
|---|---|---|
| Mean | 25 | 15.2 |
| Standard deviation | NA | 21.4 |
| Median | 25 | 3.2 |
| Interquartile range | 0 | 25.4 |
| Minimum | 25 | 0.0 |
| Maximum | 25 | 50.0 |
| Value | |
|---|---|
| U-statistic | 4 |
| P statistic | 8.6e-01 |
CD8–Ki67 positivity in stromal lymphocytes
Clinical features
Patients’ age group, in years
| Younger age | Older age | |
|---|---|---|
| Mean | 0 | 0.2 |
| Standard deviation | 0 | 0.4 |
| Median | 0 | 0.0 |
| Interquartile range | 0 | 0.0 |
| Minimum | 0 | 0.0 |
| Maximum | 0 | 1.0 |
| Value | |
|---|---|
| U-statistic | 14 |
| P statistic | 3.9e-01 |
Patients’ sex
| Female | Male | |
|---|---|---|
| Mean | 0 | 0.2 |
| Standard deviation | 0 | 0.3 |
| Median | 0 | 0.0 |
| Interquartile range | 0 | 0.0 |
| Minimum | 0 | 0.0 |
| Maximum | 0 | 1.0 |
| Value | |
|---|---|
| U-statistic | 12 |
| P statistic | 5e-01 |
Patients’ race
| Caucasian | African-American | Asian | Other | |
|---|---|---|---|---|
| Mean | 0.1 | 0 | NA | NA |
| Standard deviation | 0.3 | NA | NA | NA |
| Median | 0.0 | 0 | NA | NA |
| Interquartile range | 0.0 | 0 | NA | NA |
| Minimum | 0.0 | 0 | NA | NA |
| Maximum | 1.0 | 0 | NA | NA |
| Value | |
|---|---|
| Statistic | 0.1806 |
| Parameter | 1 |
| P statistic | 0.67 |
Outcome features
Overall mortality
| ANOD + AWD | DOC + DOD | |
|---|---|---|
| Mean | 1 | 0.0 |
| Standard deviation | NA | 0.1 |
| Median | 1 | 0.0 |
| Interquartile range | 0 | 0.0 |
| Minimum | 1 | 0.0 |
| Maximum | 1 | 0.5 |
| Value | |
|---|---|
| U-statistic | 12 |
| P statistic | 1.9e-02 |
Cancer-related mortality
| ANOD + AWD + DOC | DOD | |
|---|---|---|
| Mean | 1 | 0.1 |
| Standard deviation | NA | 0.2 |
| Median | 1 | 0.0 |
| Interquartile range | 0 | 0.0 |
| Minimum | 1 | 0.0 |
| Maximum | 1 | 0.5 |
| Value | |
|---|---|
| U-statistic | 7 |
| P statistic | 8.6e-02 |
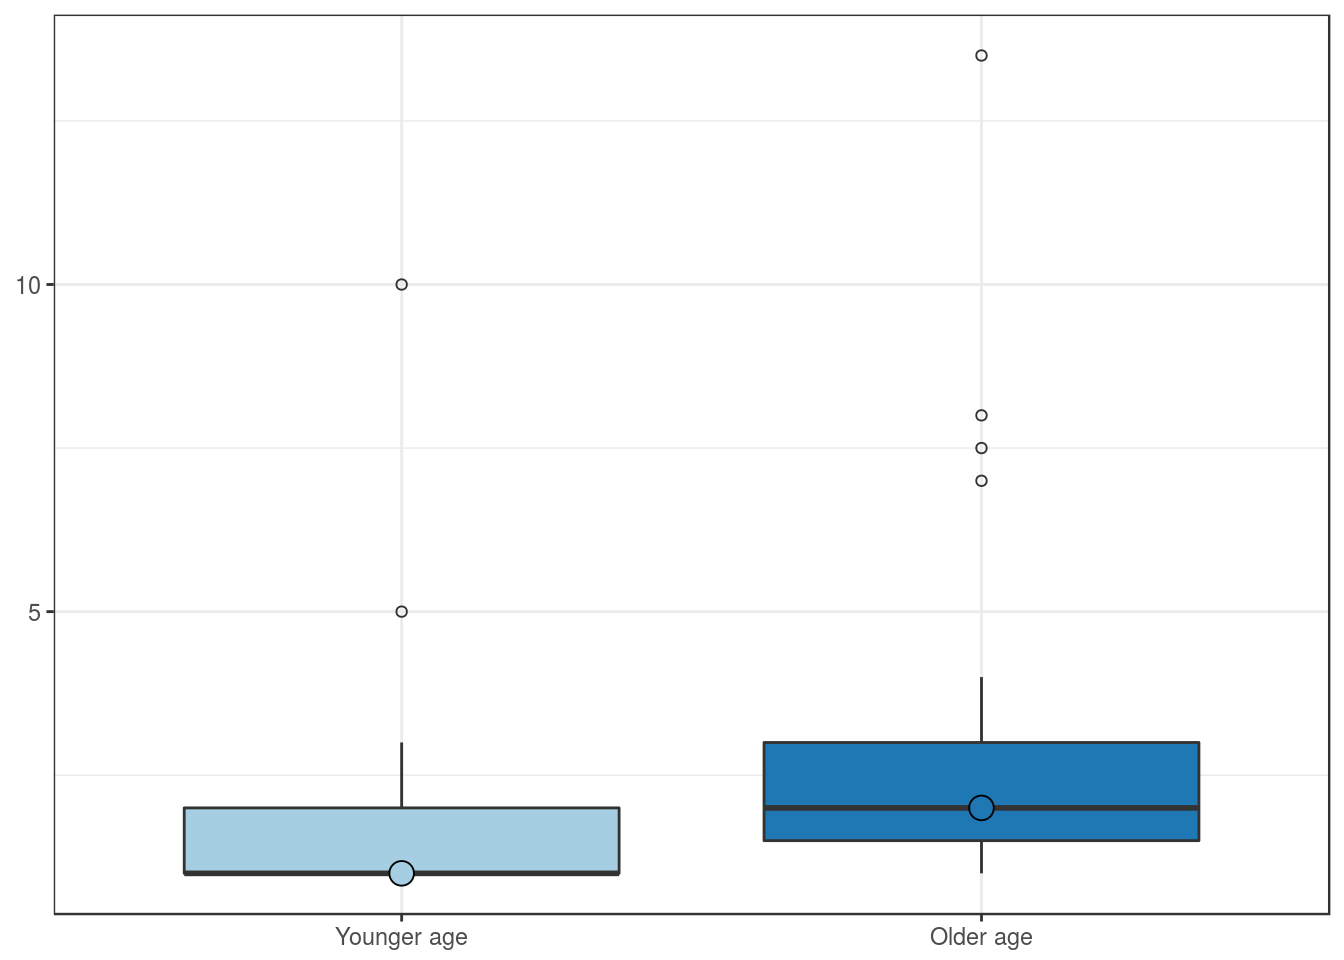
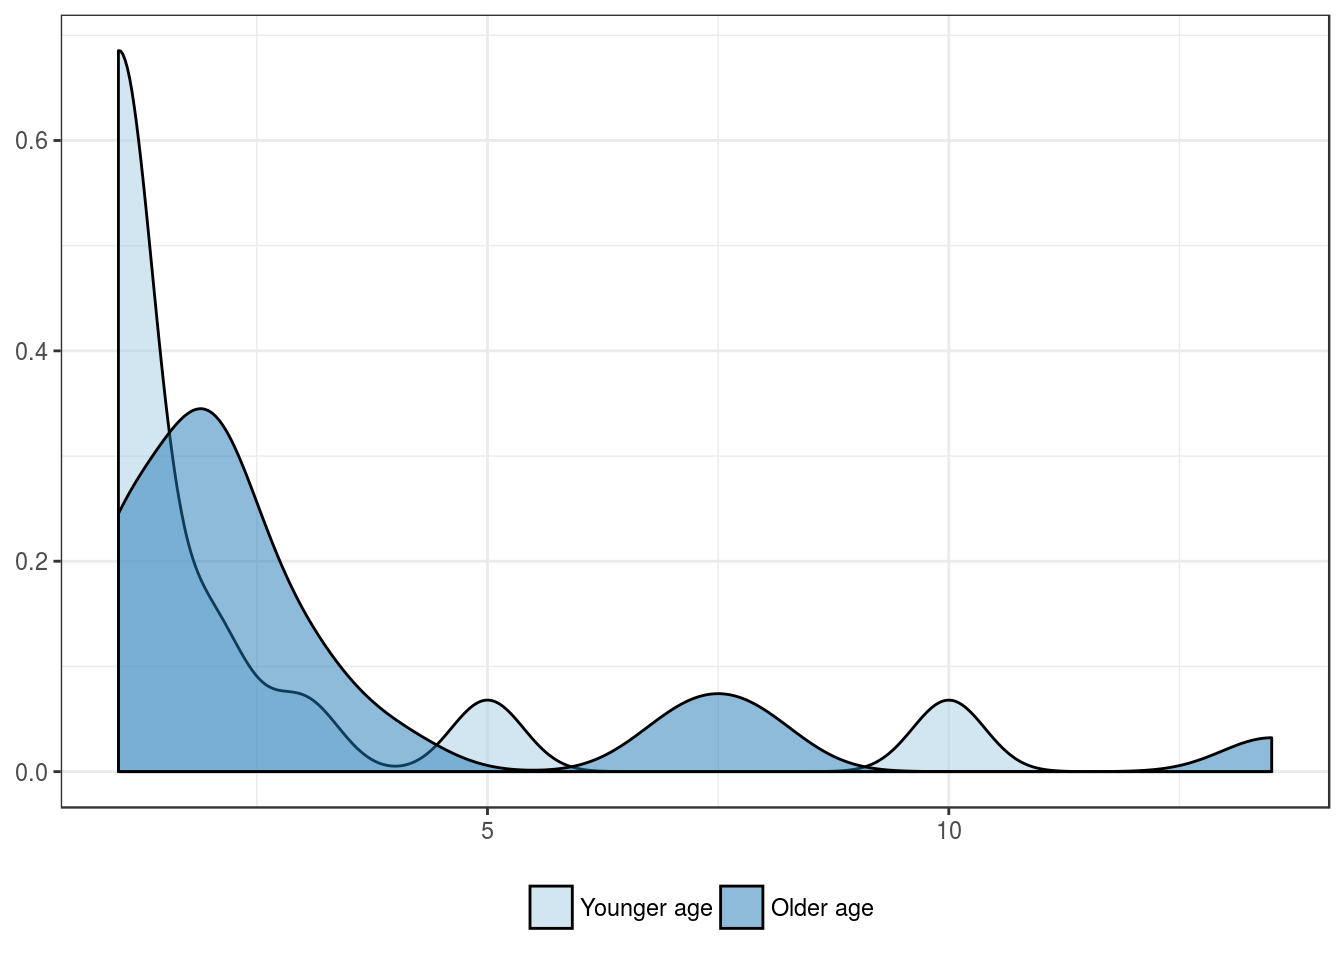
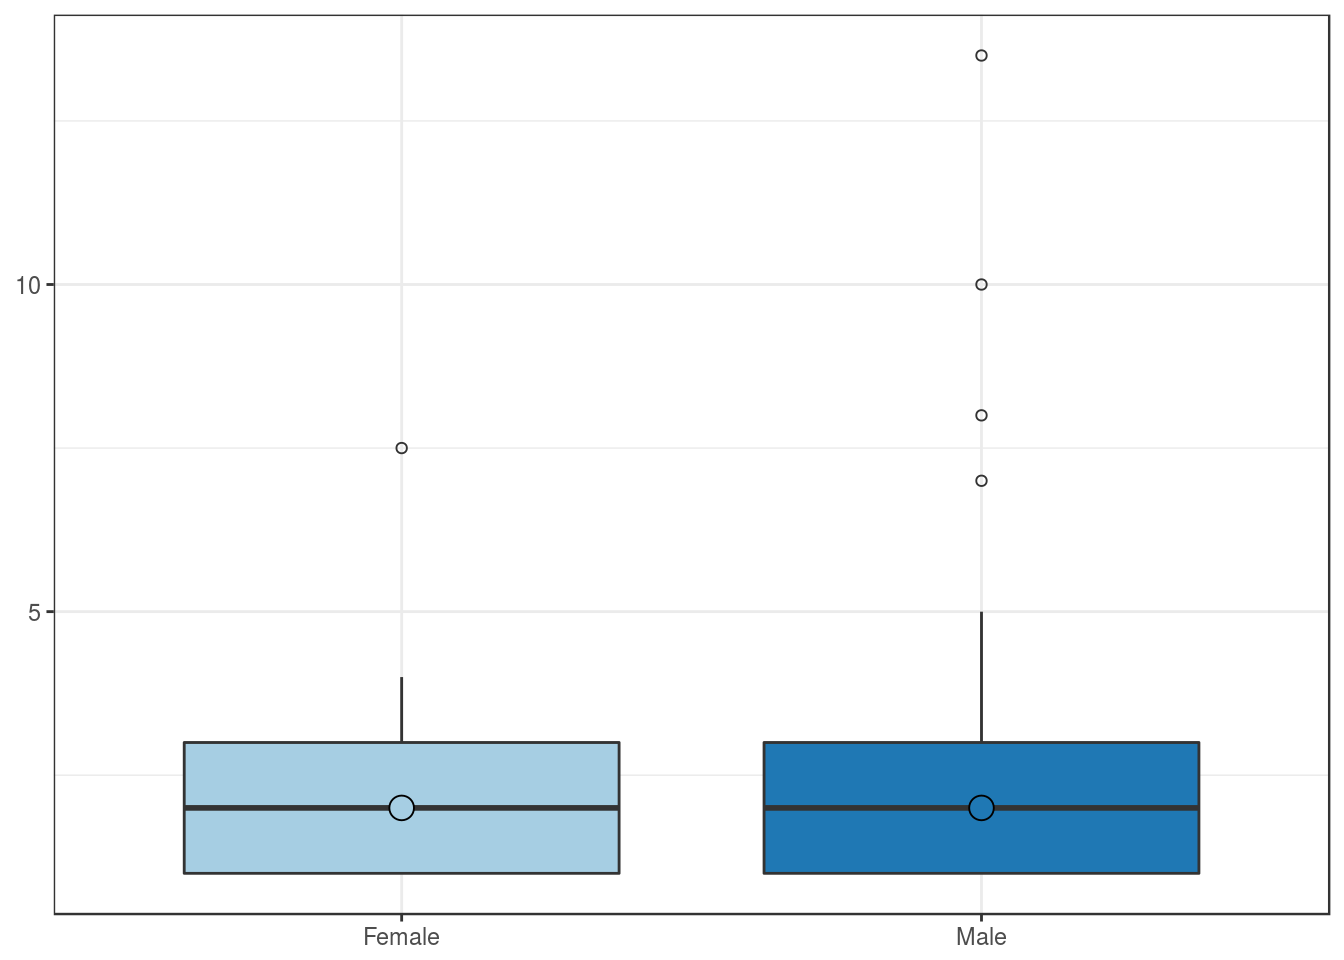
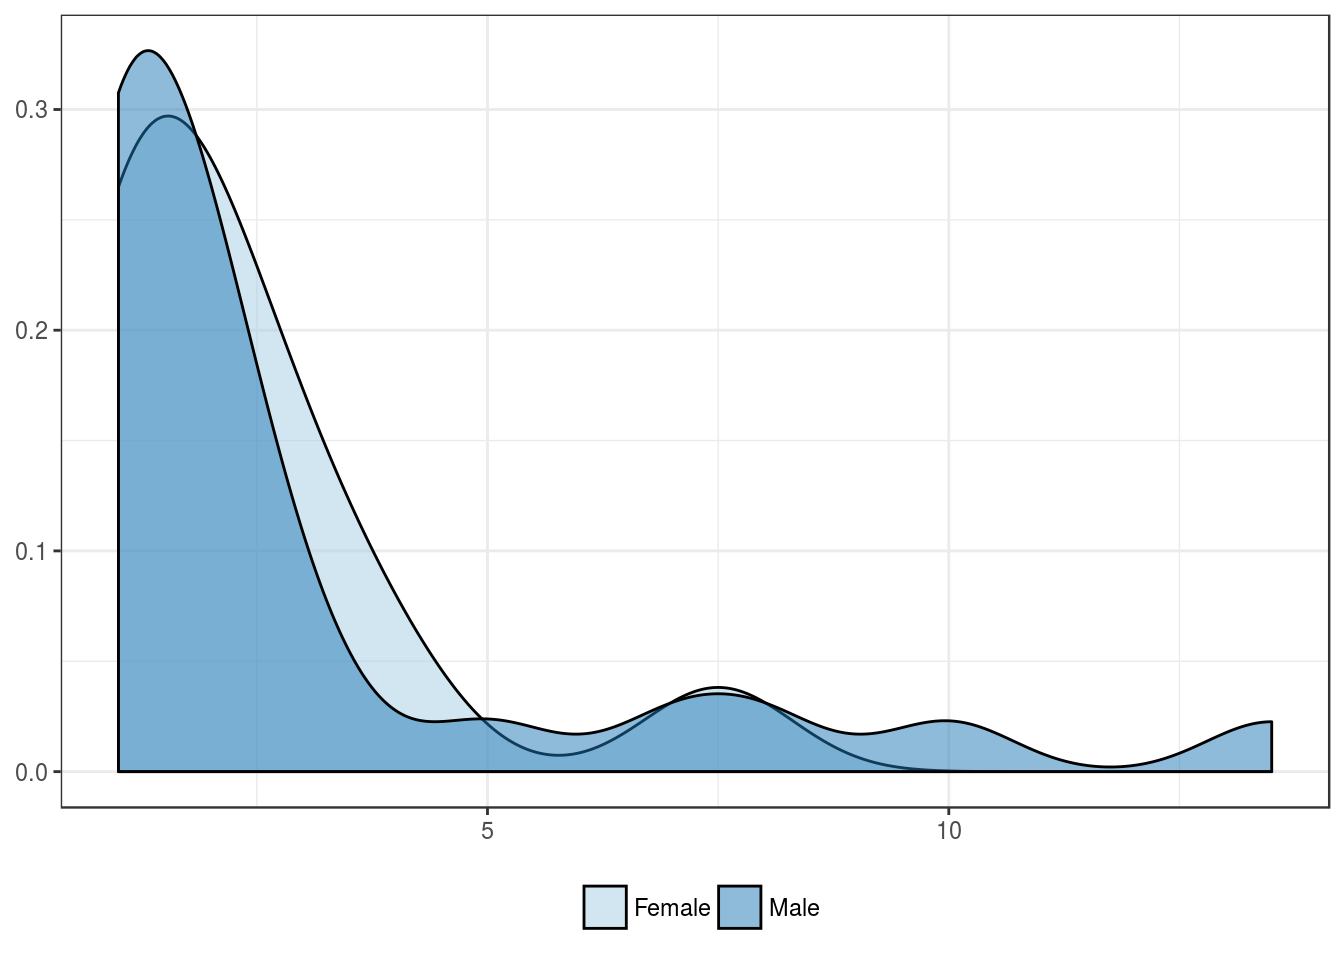
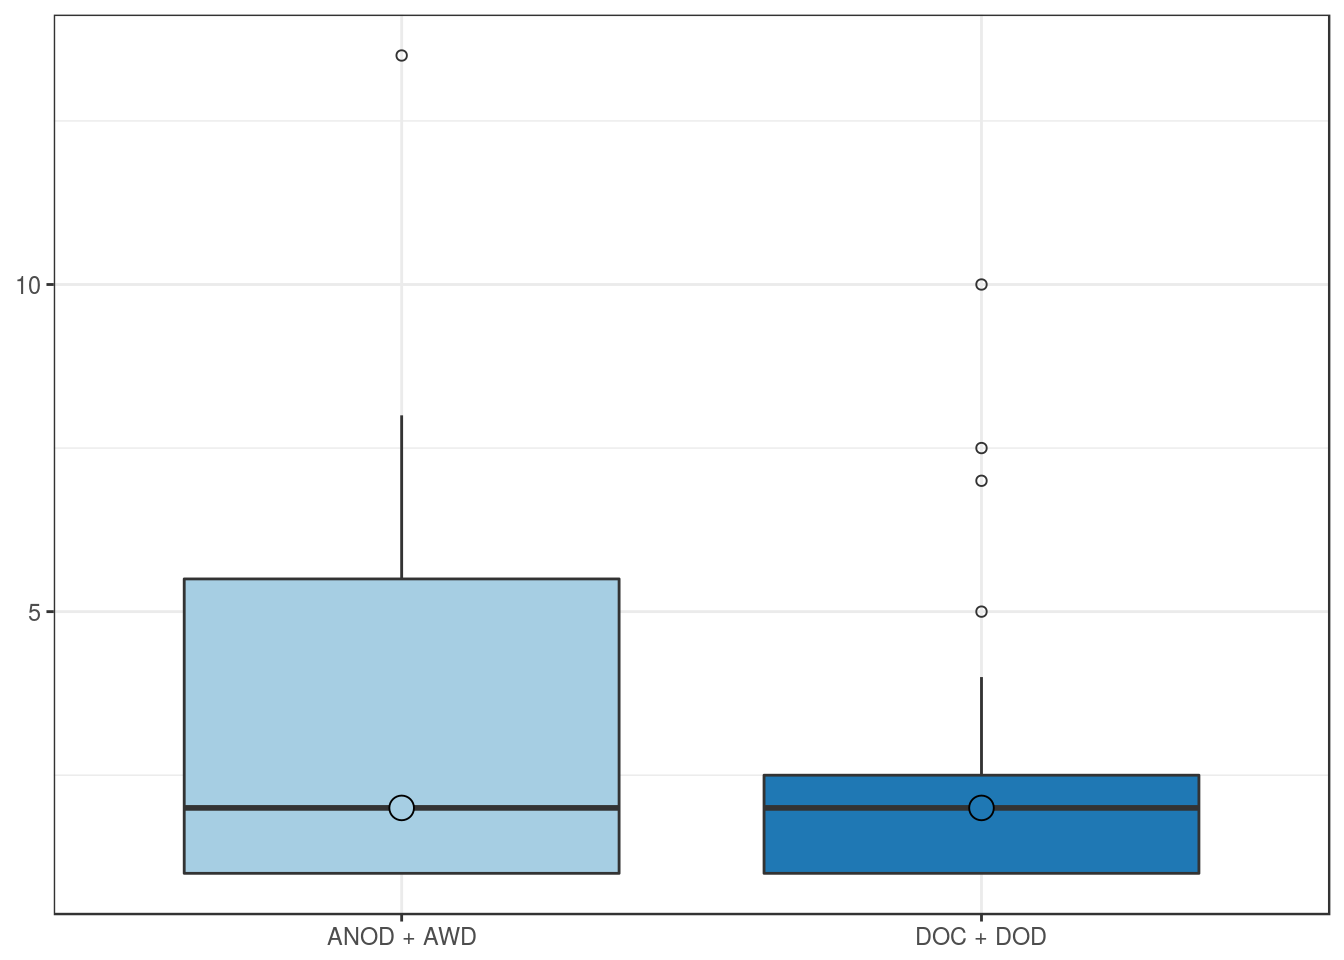
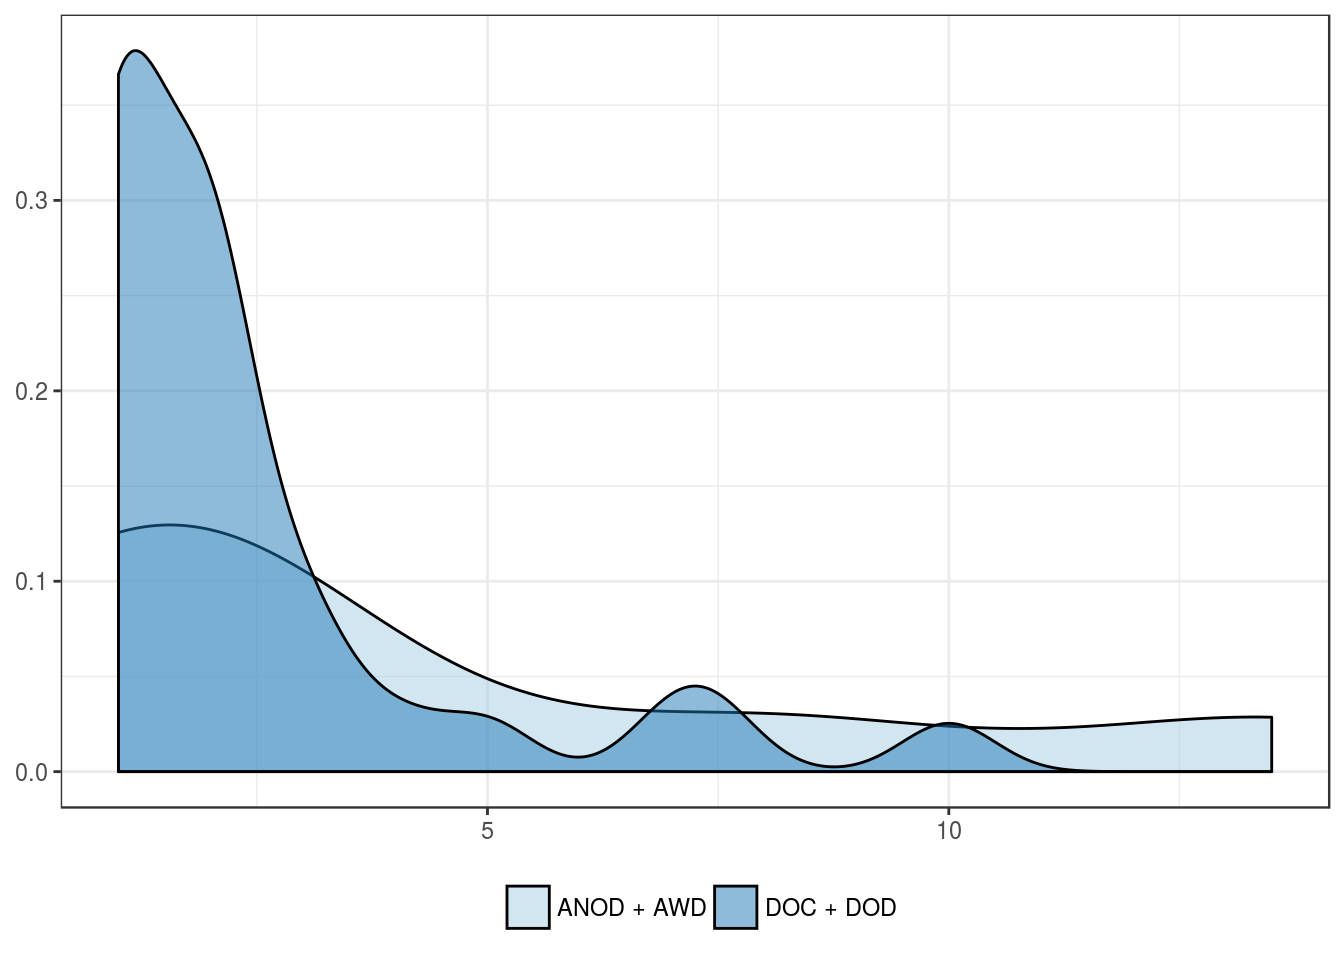
Ki67 positivity in intratumoral lymphocytes
Clinical features
Patients’ age group, in years
| Younger age | Older age | |
|---|---|---|
| Mean | 2.1 | 3.2 |
| Standard deviation | 2.4 | 3.1 |
| Median | 1.0 | 2.0 |
| Interquartile range | 1.0 | 1.5 |
| Minimum | 1.0 | 1.0 |
| Maximum | 10.0 | 13.5 |
| Value | |
|---|---|
| U-statistic | 108 |
| P statistic | 4.6e-02 |
Patients’ sex
| Female | Male | |
|---|---|---|
| Mean | 2.3 | 3.0 |
| Standard deviation | 1.8 | 3.3 |
| Median | 2.0 | 2.0 |
| Interquartile range | 2.0 | 2.0 |
| Minimum | 1.0 | 1.0 |
| Maximum | 7.5 | 13.5 |
| Value | |
|---|---|
| U-statistic | 166 |
| P statistic | 9.4e-01 |
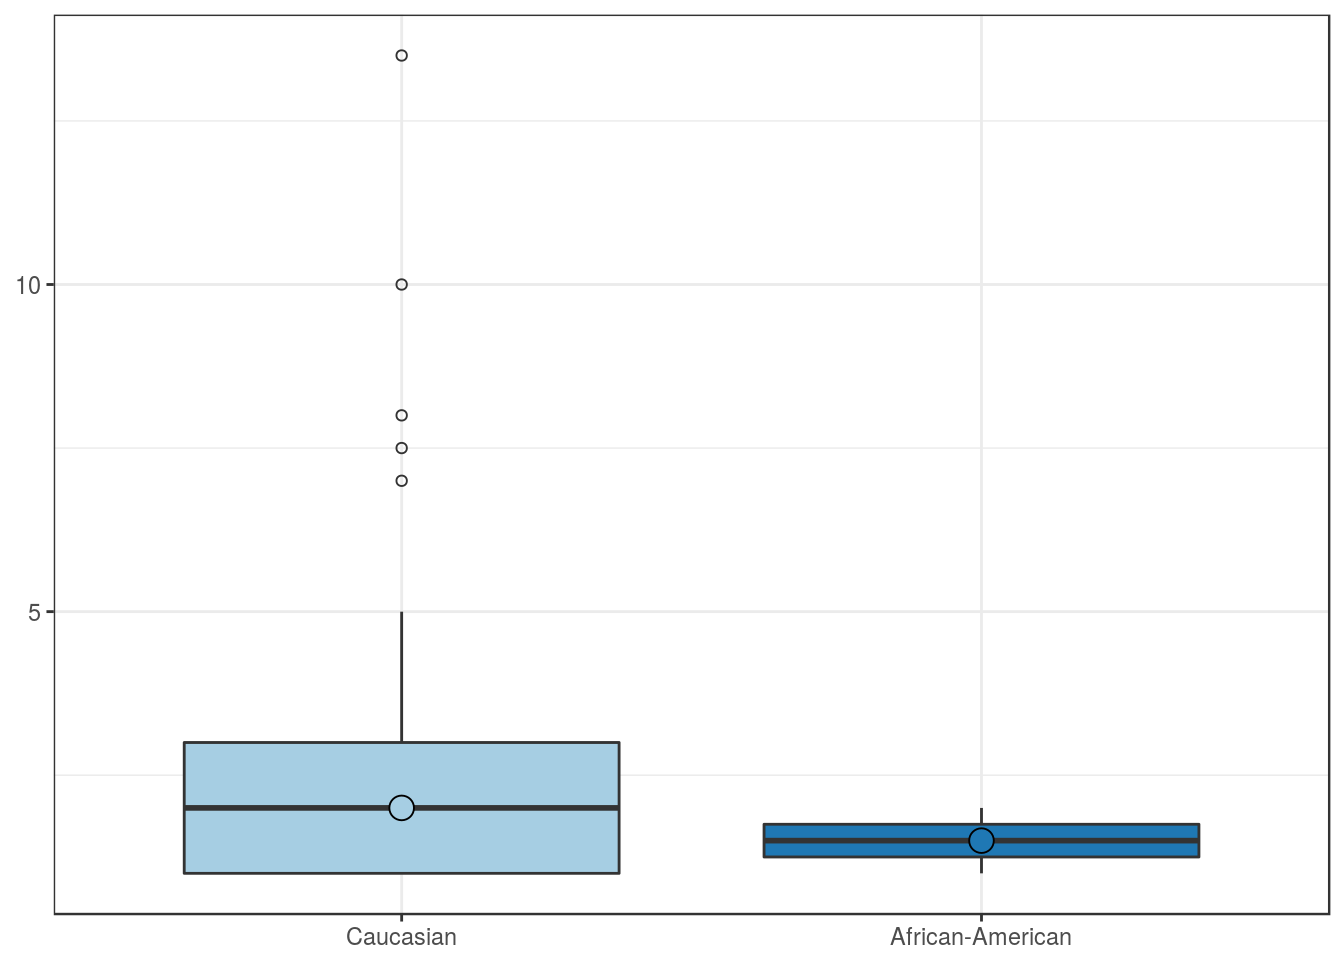
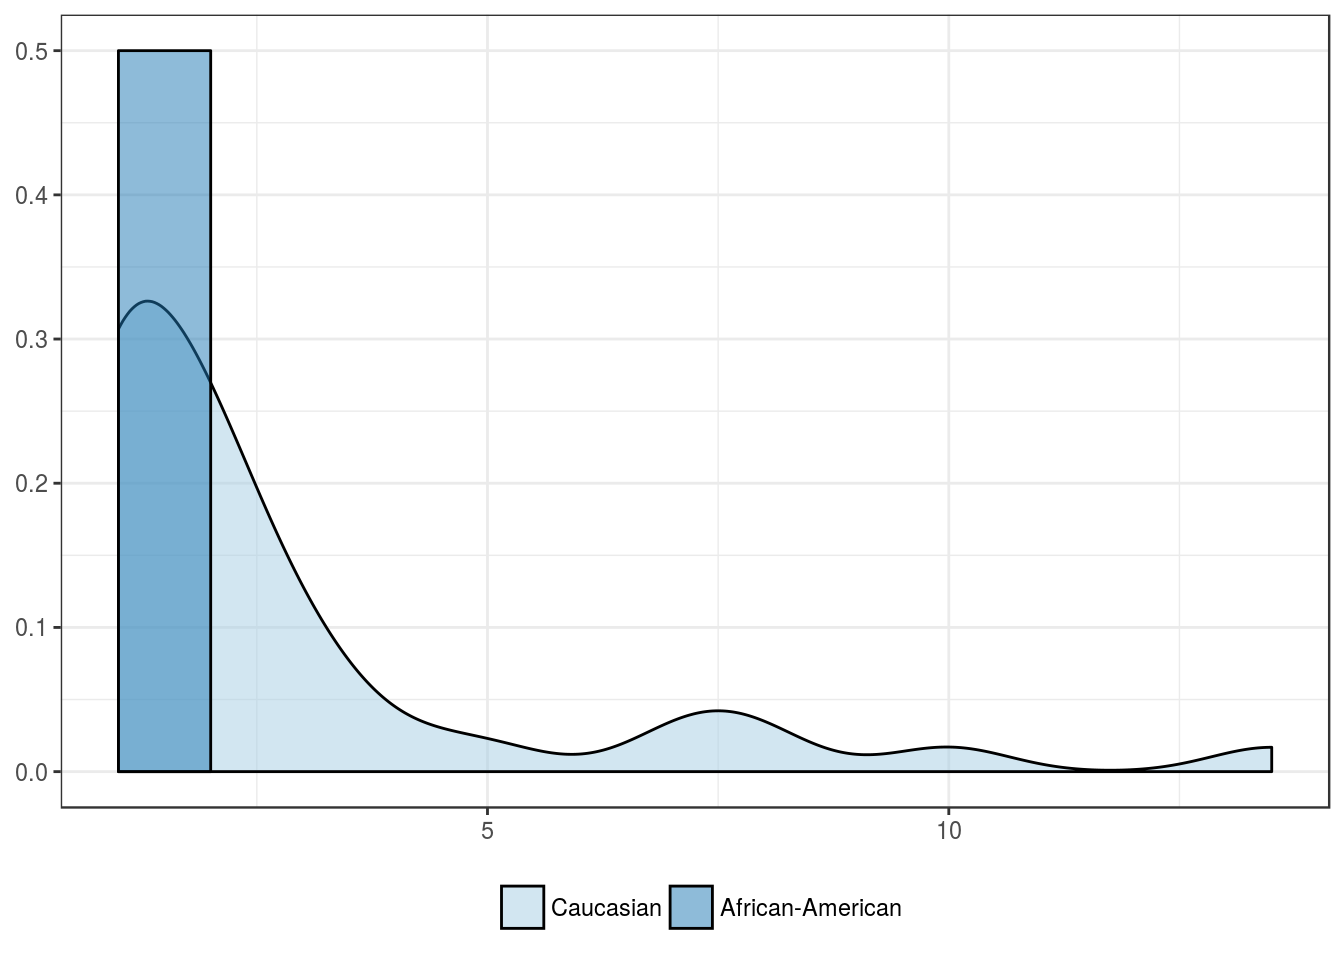
Patients’ race
| Caucasian | African-American | Asian | Other | |
|---|---|---|---|---|
| Mean | 2.8 | 1.5 | NA | NA |
| Standard deviation | 2.9 | 0.7 | NA | NA |
| Median | 2.0 | 1.5 | NA | NA |
| Interquartile range | 2.0 | 0.5 | NA | NA |
| Minimum | 1.0 | 1.0 | NA | NA |
| Maximum | 13.5 | 2.0 | NA | NA |
| Value | |
|---|---|
| Statistic | 0.3429 |
| Parameter | 1 |
| P statistic | 0.56 |
Outcome features
Overall mortality
| ANOD + AWD | DOC + DOD | |
|---|---|---|
| Mean | 4.2 | 2.4 |
| Standard deviation | 4.8 | 2.2 |
| Median | 2.0 | 2.0 |
| Interquartile range | 4.5 | 1.5 |
| Minimum | 1.0 | 1.0 |
| Maximum | 13.5 | 10.0 |
| Value | |
|---|---|
| U-statistic | 123 |
| P statistic | 5.8e-01 |
Cancer-related mortality
| ANOD + AWD + DOC | DOD | |
|---|---|---|
| Mean | 3.6 | 2.4 |
| Standard deviation | 4.9 | 2.3 |
| Median | 1.5 | 1.5 |
| Interquartile range | 1.8 | 1.0 |
| Minimum | 1.0 | 1.0 |
| Maximum | 13.5 | 10.0 |
| Value | |
|---|---|
| U-statistic | 70 |
| P statistic | 8.3e-01 |