Clinical features
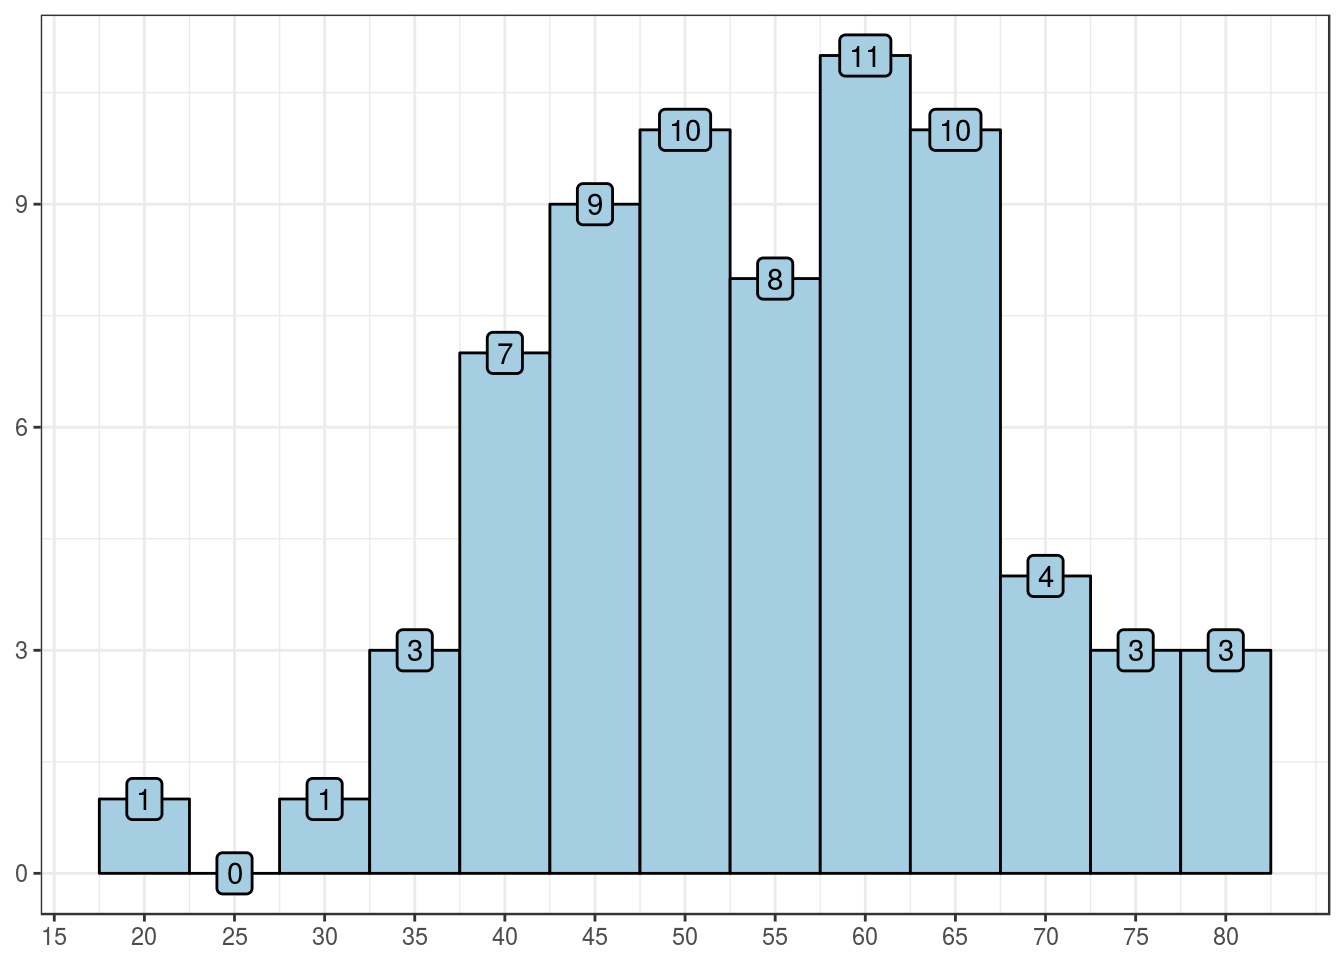
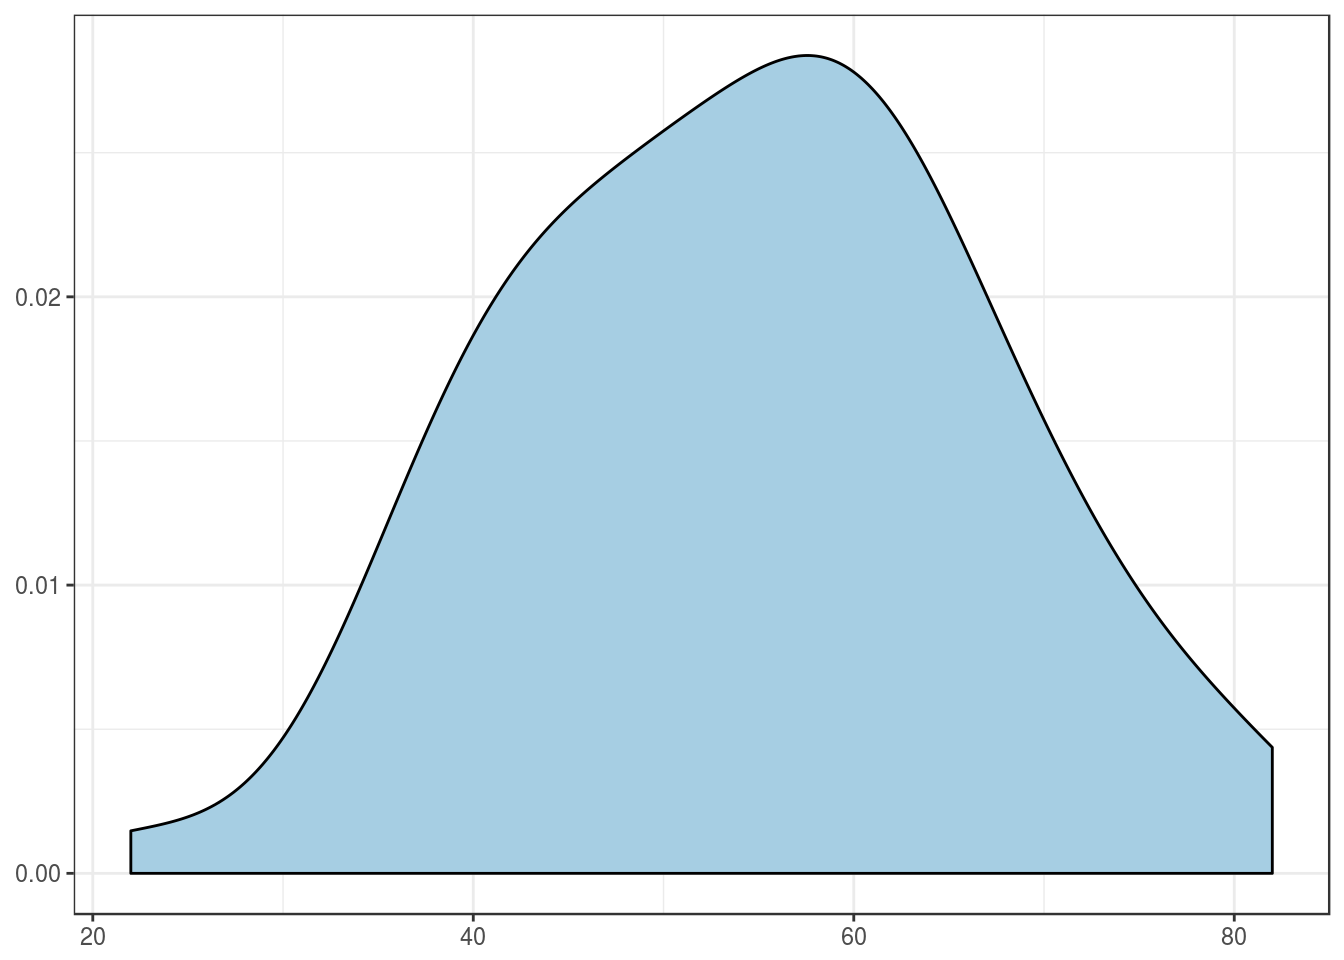
Patients’ age, in years
Summary table
| Mean |
54.7 |
| Standard deviation |
12.5 |
| Median |
55 |
| Interquartile range |
17.8 |
| Mininum |
22 |
| Maximum |
82 |
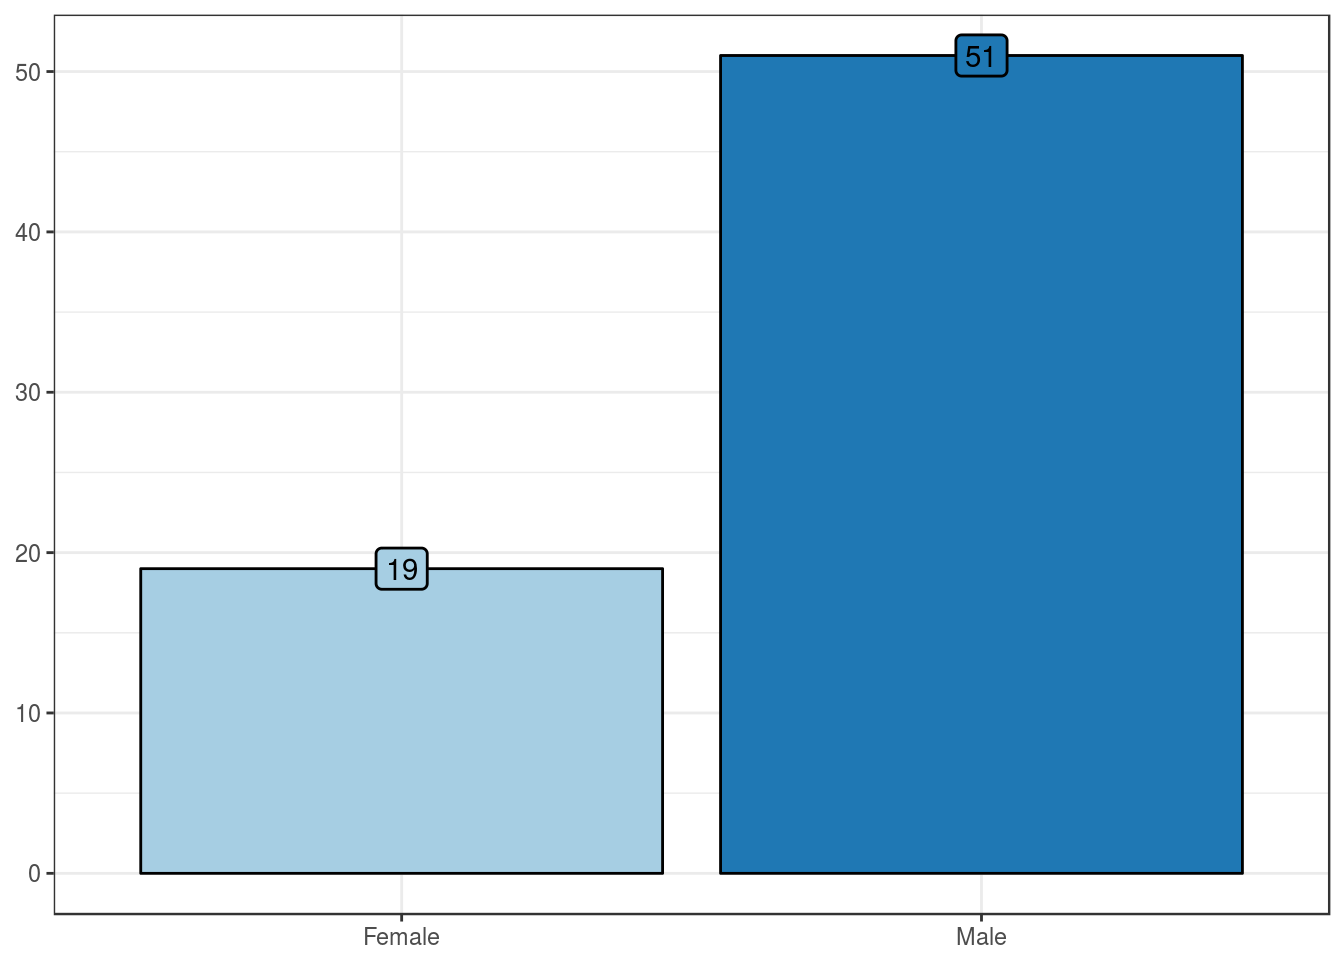
Patients’ sex
Summary table
| Female |
19 (27) |
| Male |
51 (73) |
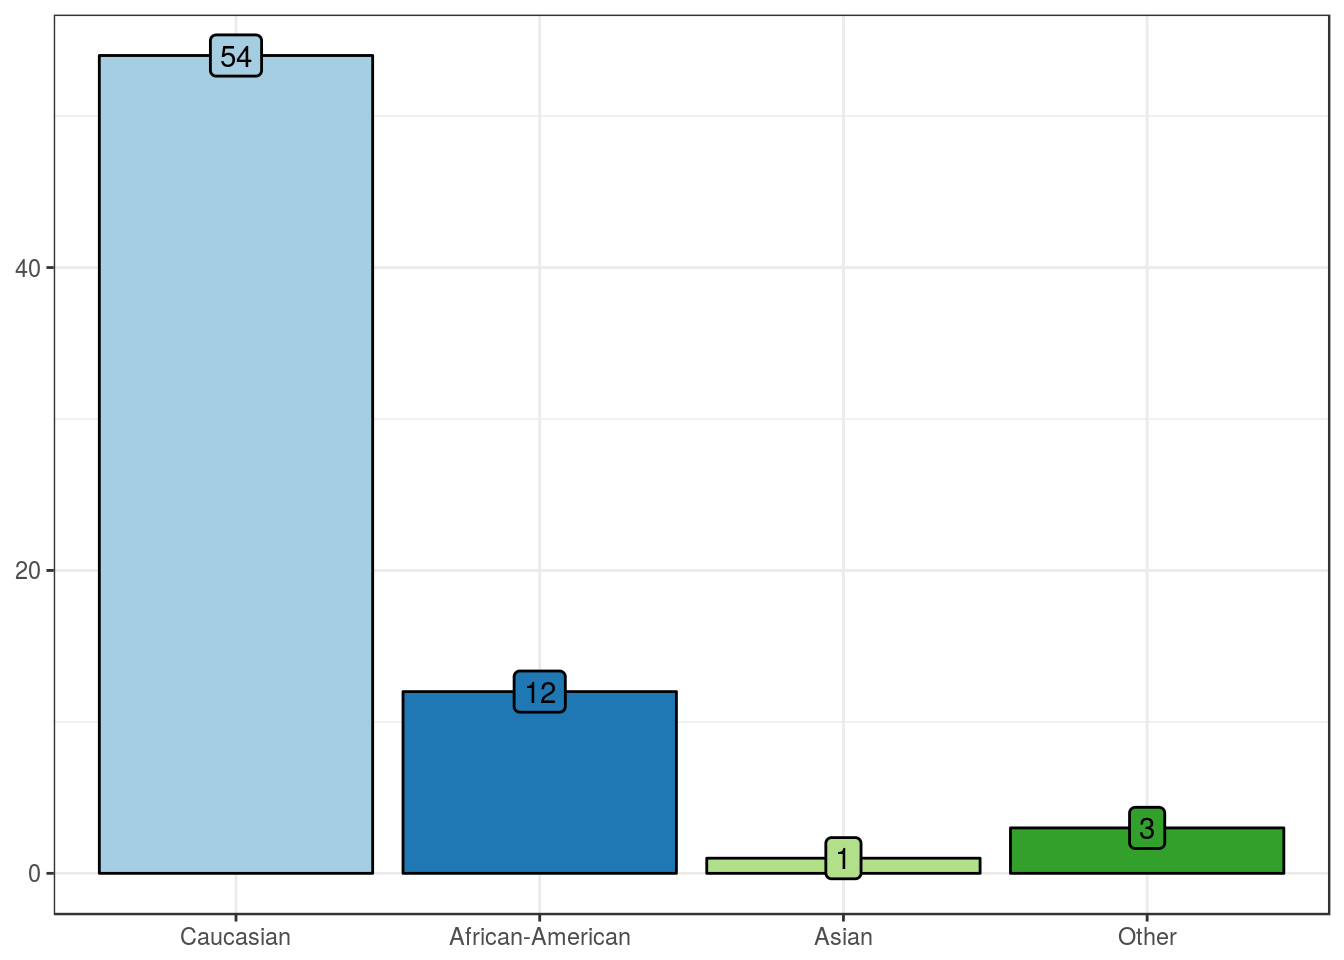
Patients´ race
Summary table
| Caucasian |
54 (77) |
| African-American |
12 (17) |
| Asian |
1 (1) |
| Other |
3 (4) |
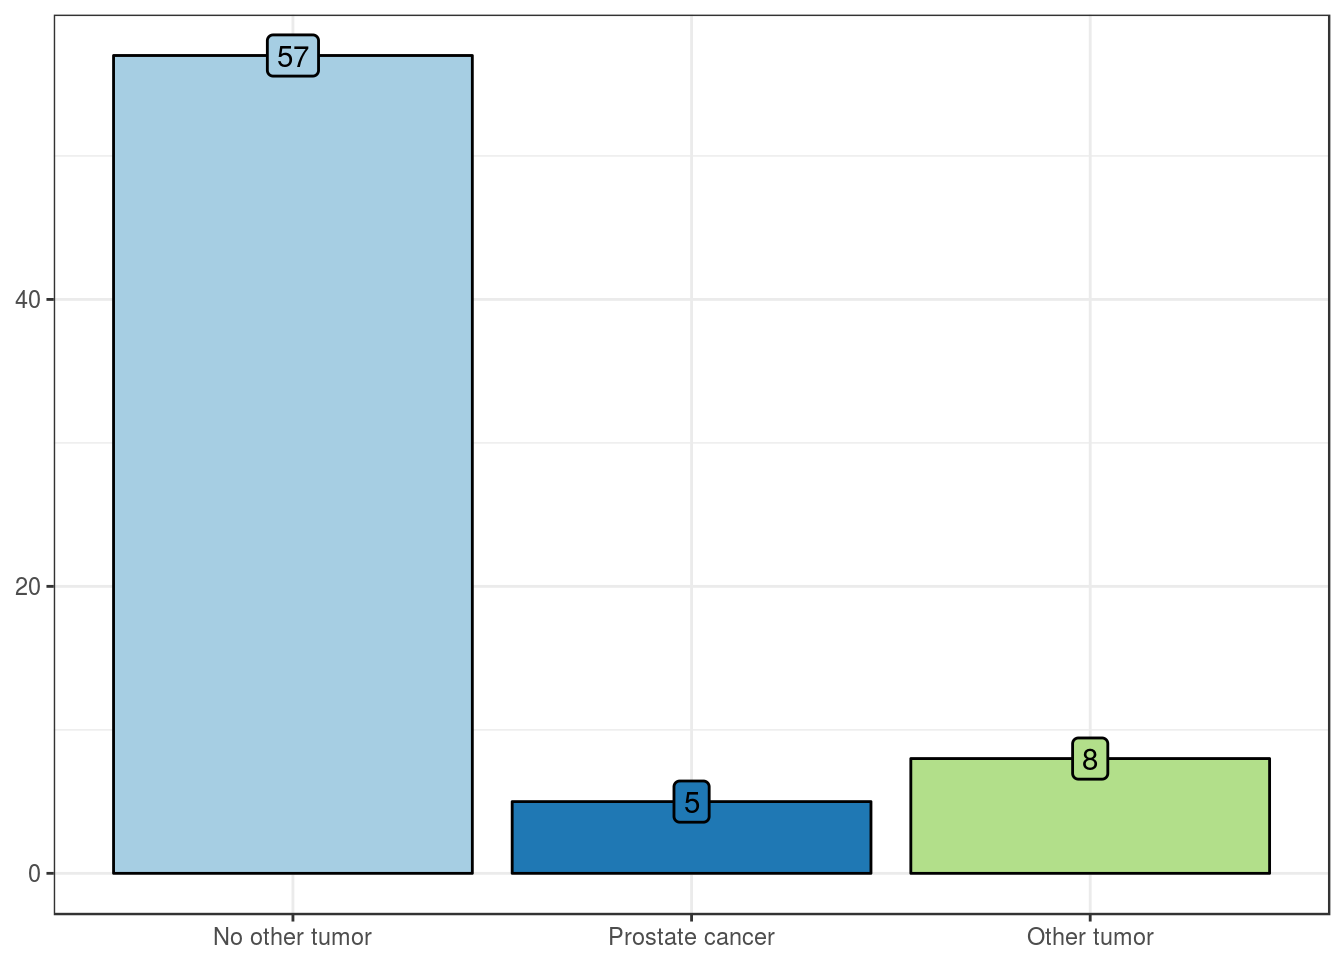
History of other malignancies
Summary table
| No other tumor |
57 (81) |
| Prostate cancer |
5 (7) |
| Other tumor |
8 (11) |
Pathologic features
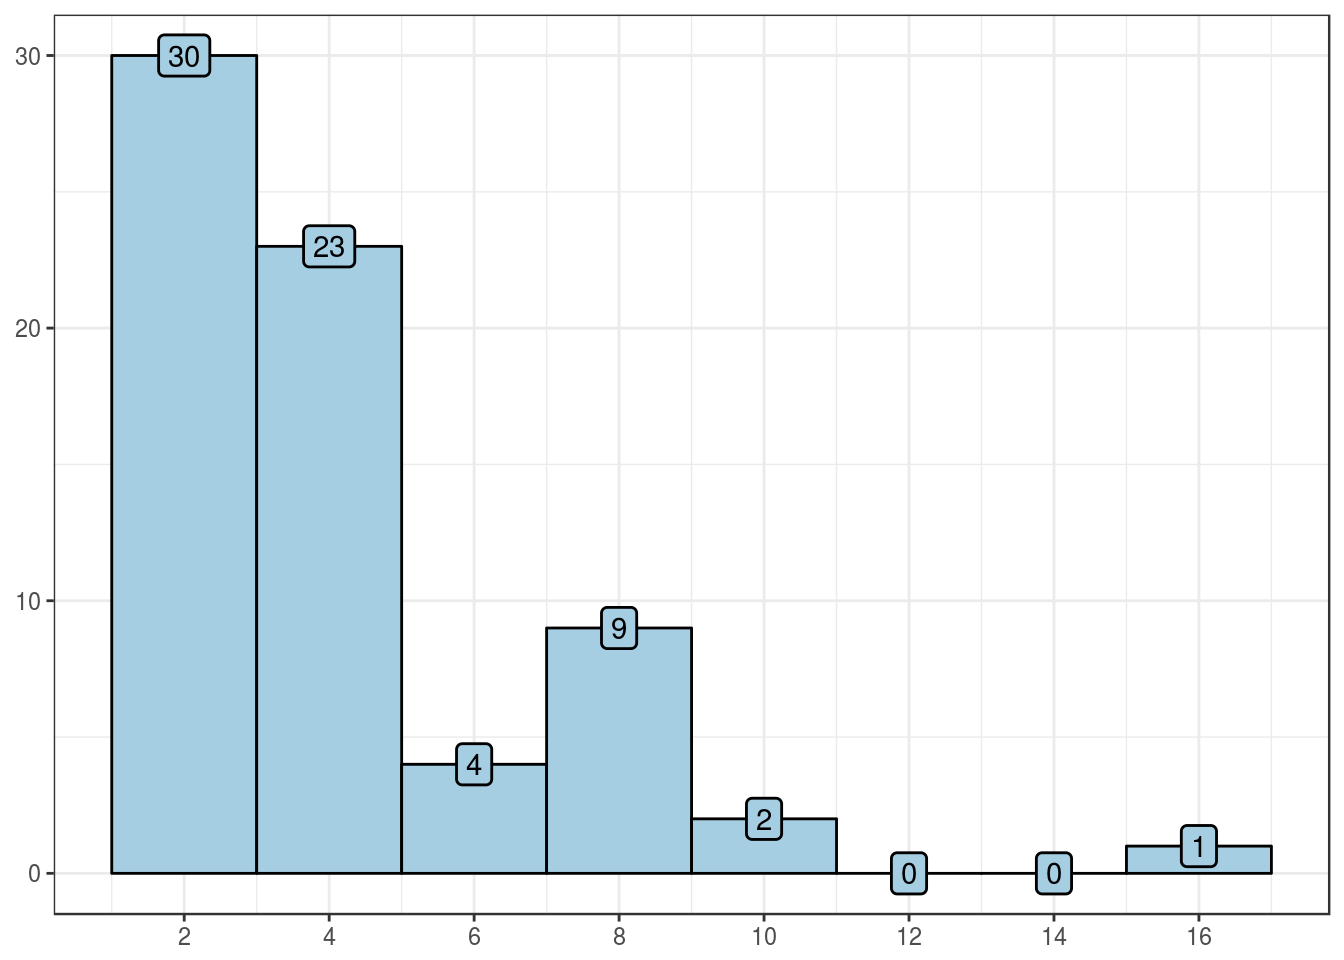
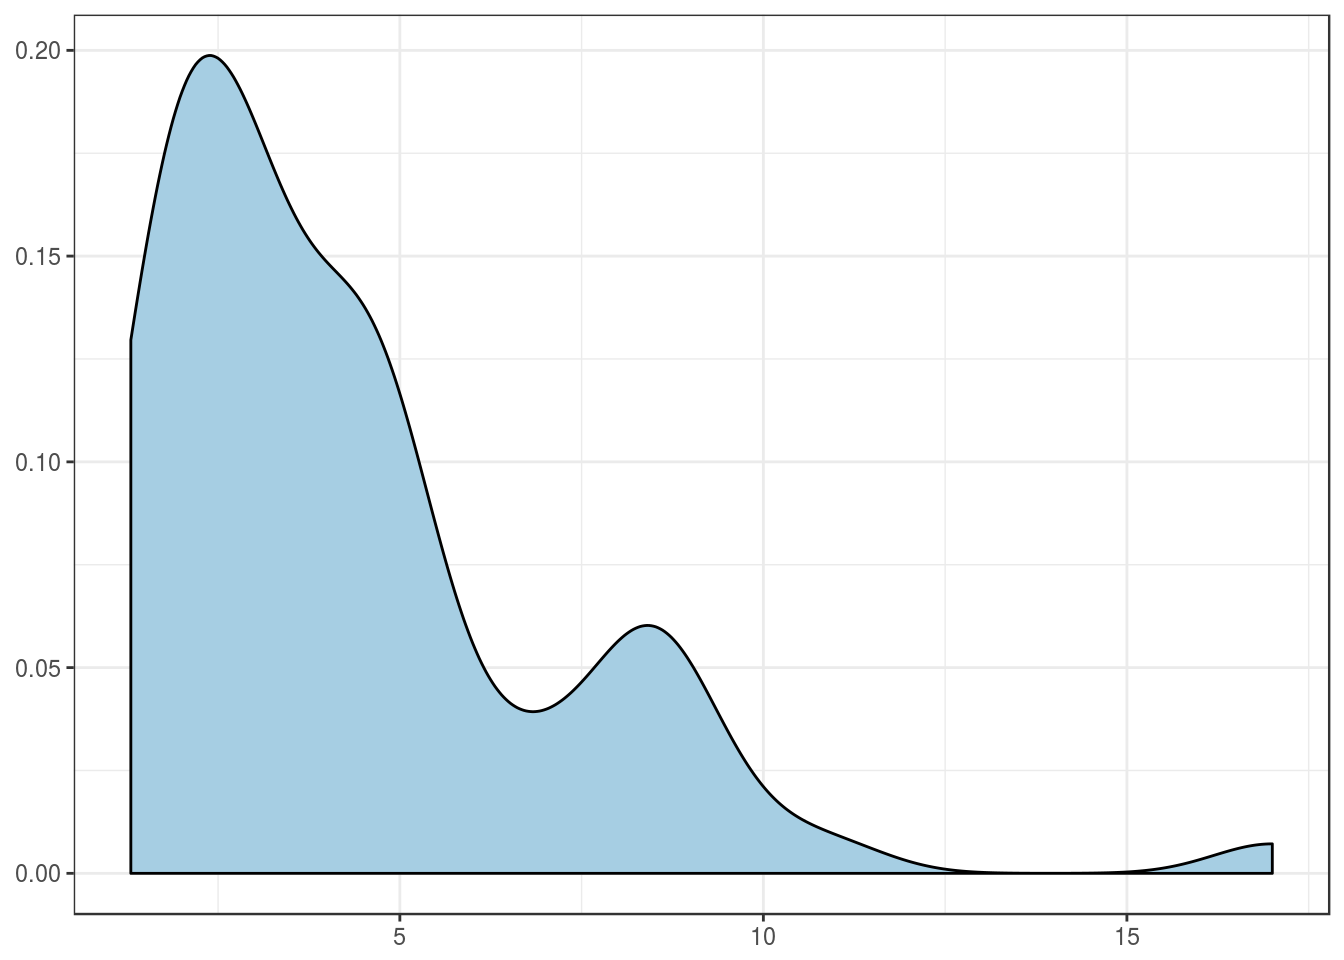
Tumor size, in cm
Summary table
| Mean |
4.3 |
| Standard deviation |
2.9 |
| Median |
3.5 |
| Interquartile range |
2.8 |
| Mininum |
1.3 |
| Maximum |
17 |
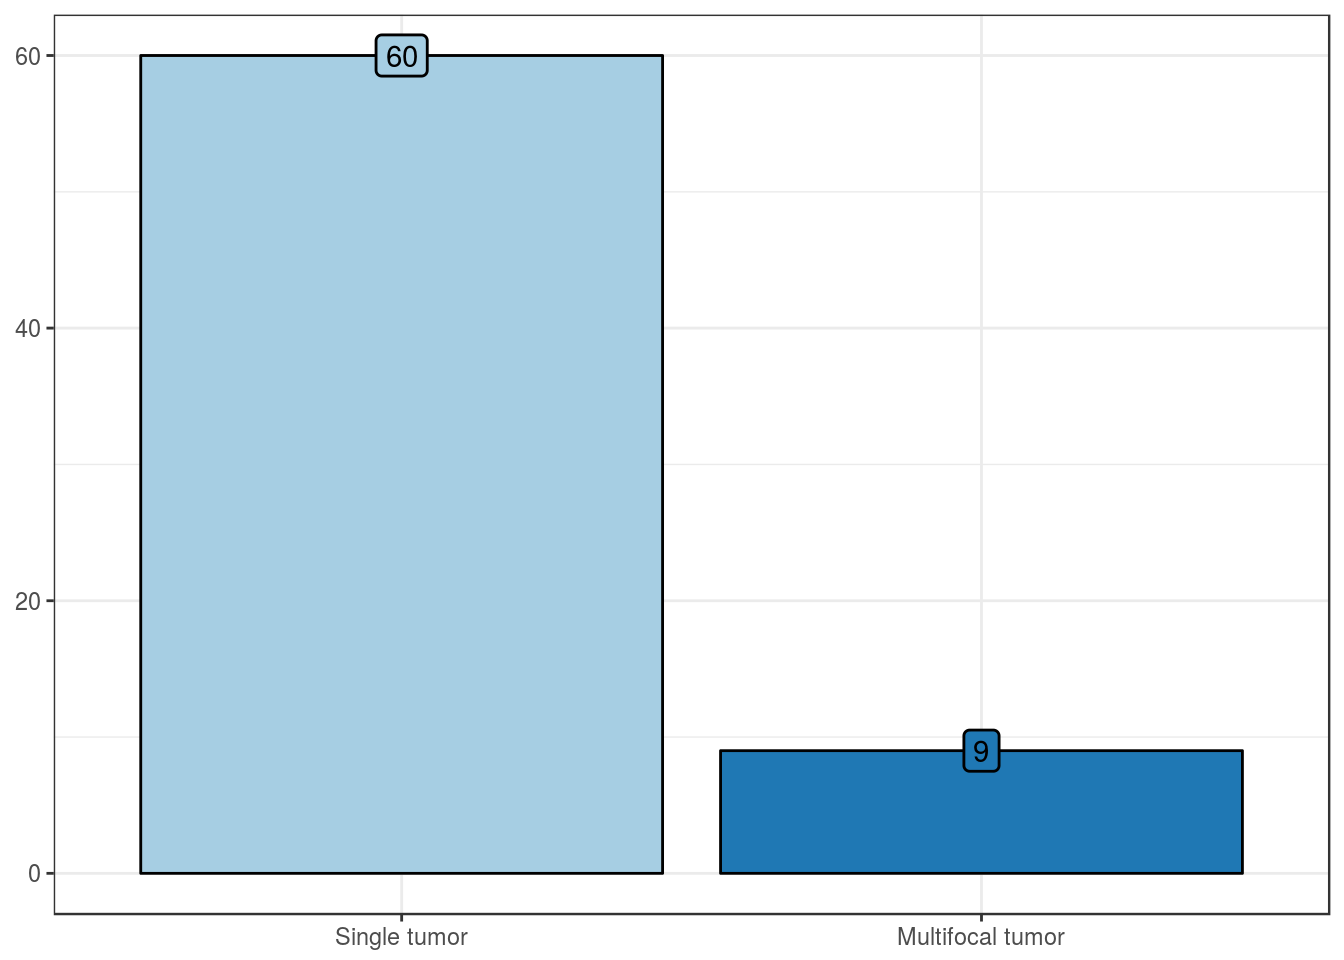
Multifocality
Summary table
| Single tumor |
60 (87) |
| Multifocal tumor |
9 (13) |
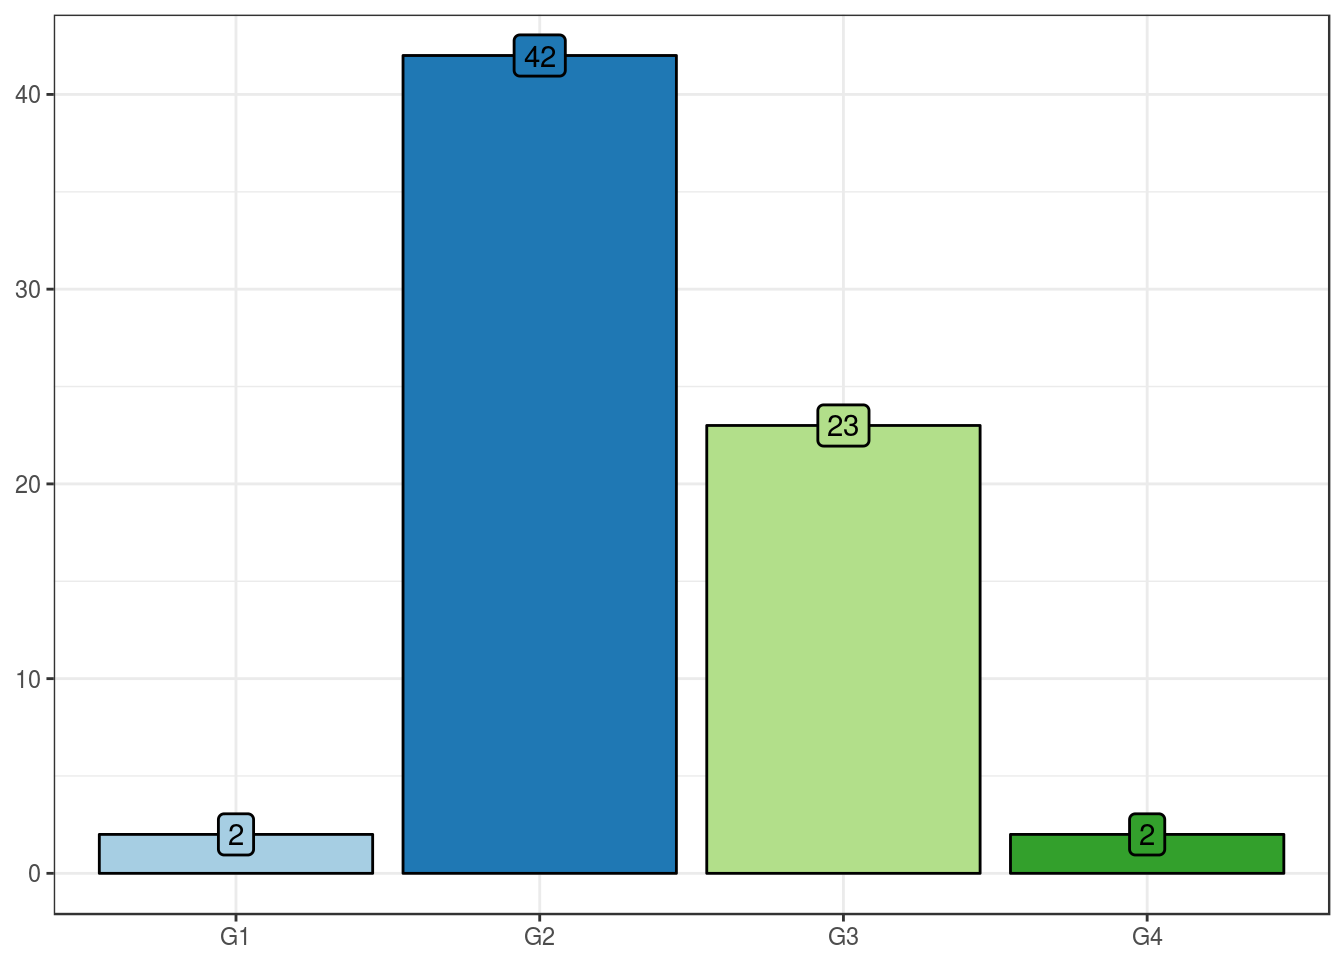
Fuhrman grade
Summary table
| G1 |
2 (3) |
| G2 |
42 (61) |
| G3 |
23 (33) |
| G4 |
2 (3) |
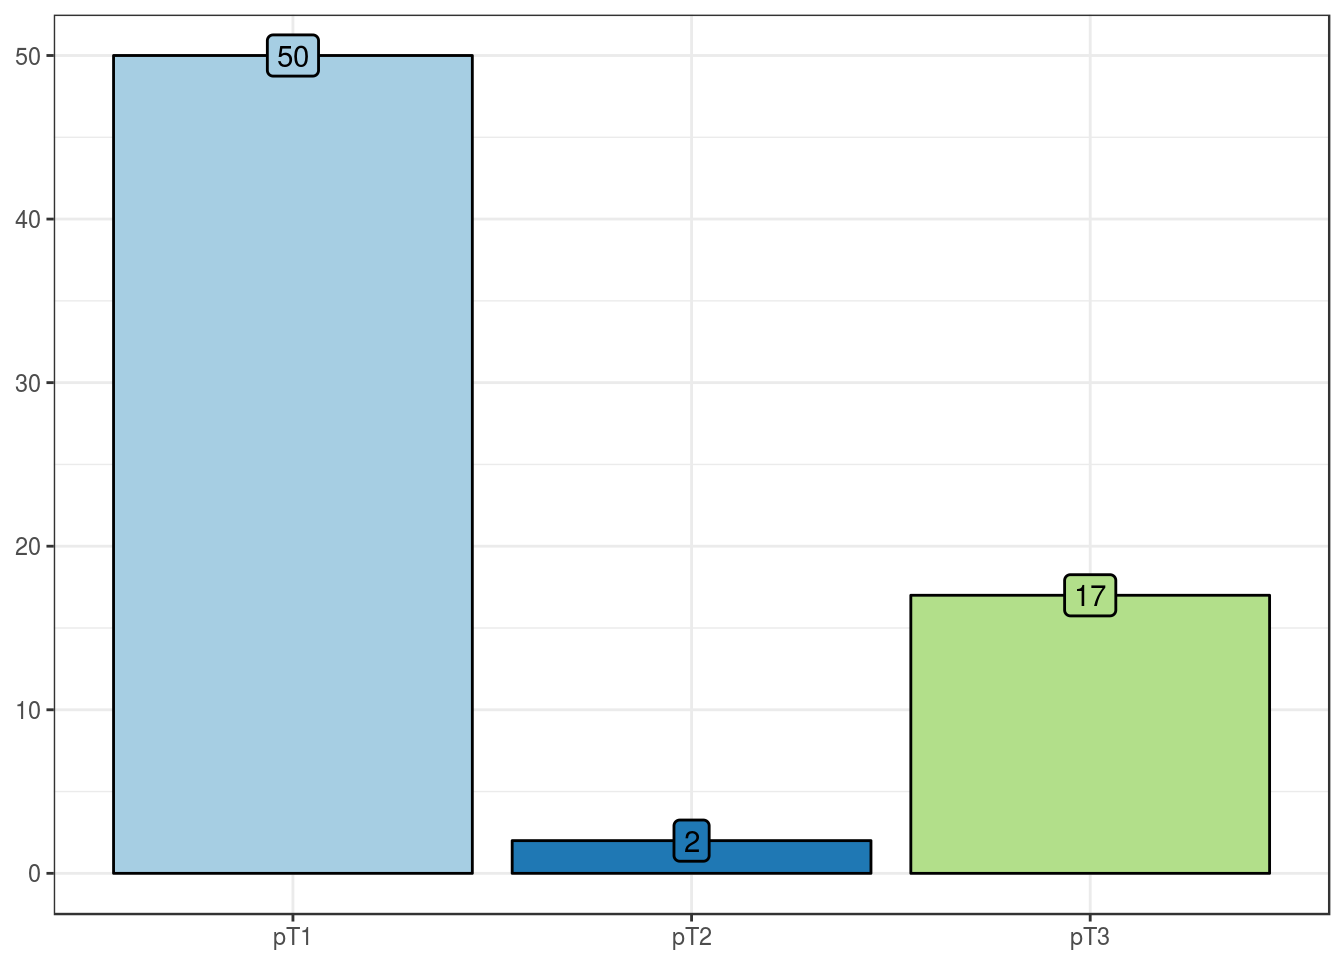
pT stage
Summary table
| pT1 |
50 (72) |
| pT2 |
2 (3) |
| pT3 |
17 (25) |
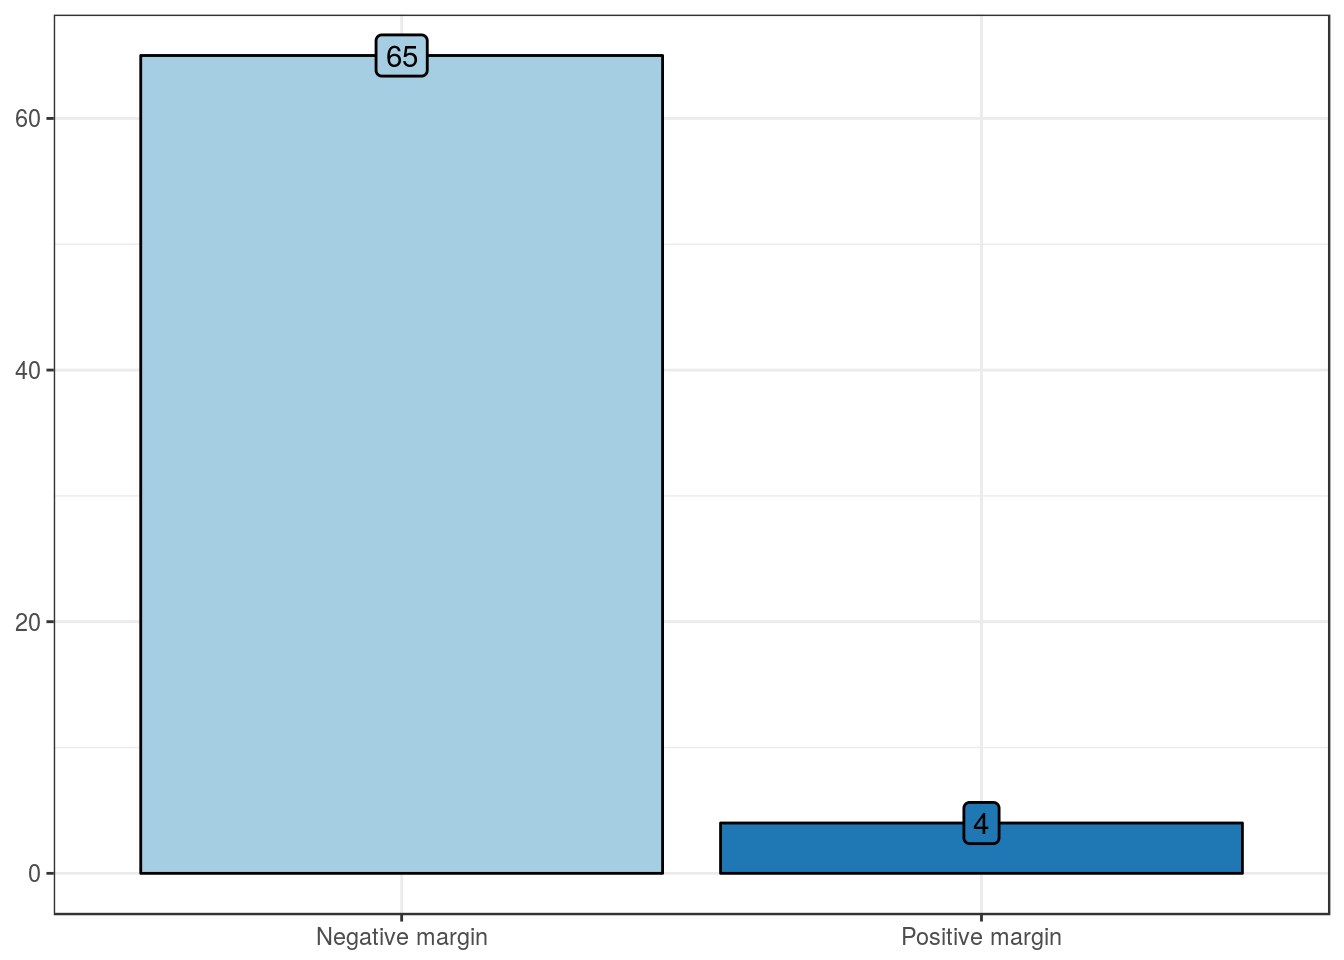
Surgical margin
Summary table
| Negative margin |
65 (94) |
| Positive margin |
4 (6) |
Outcome features
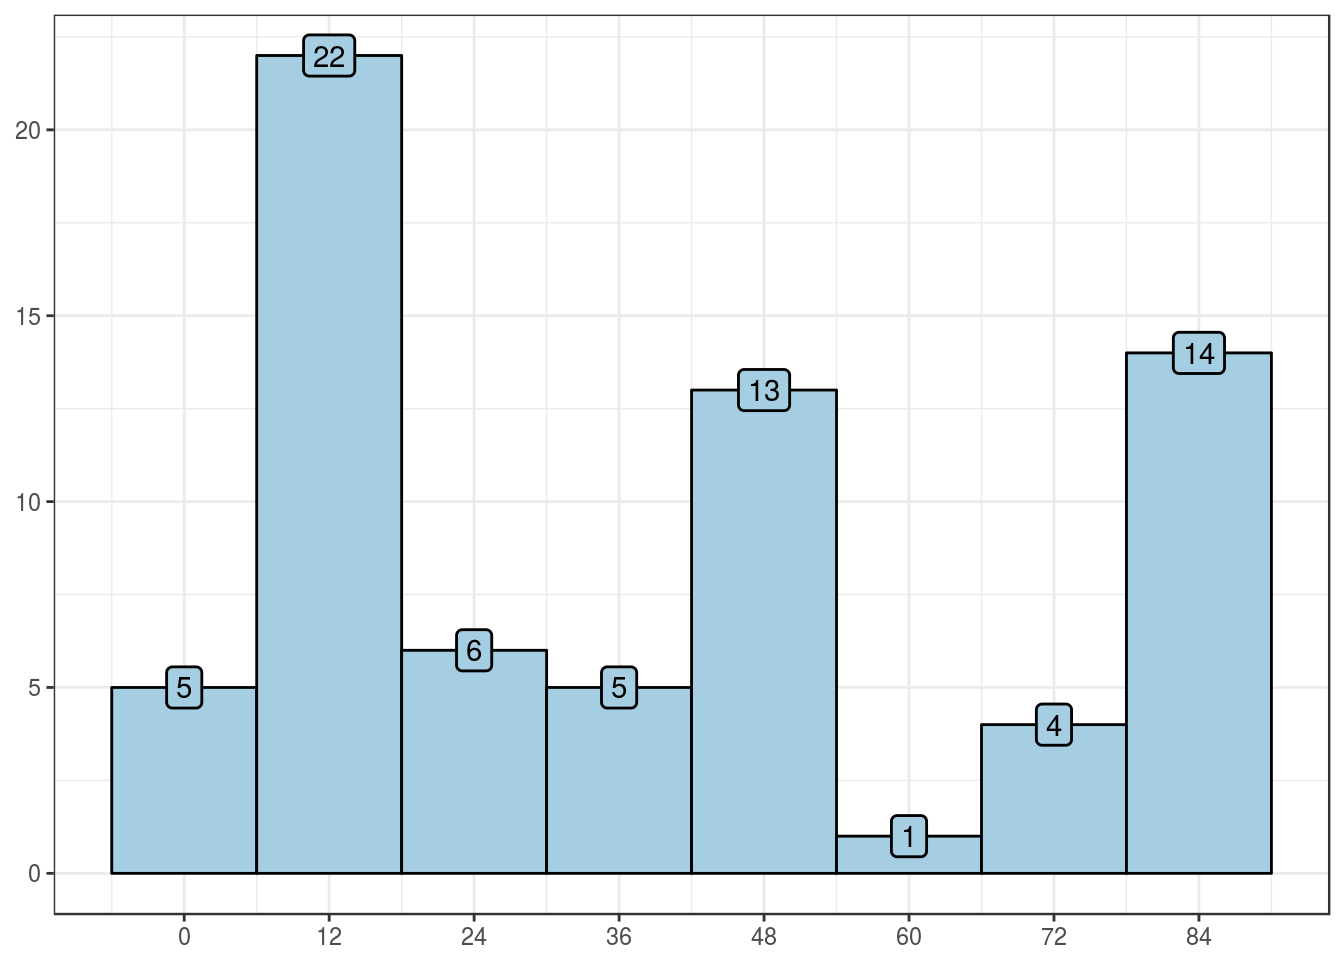
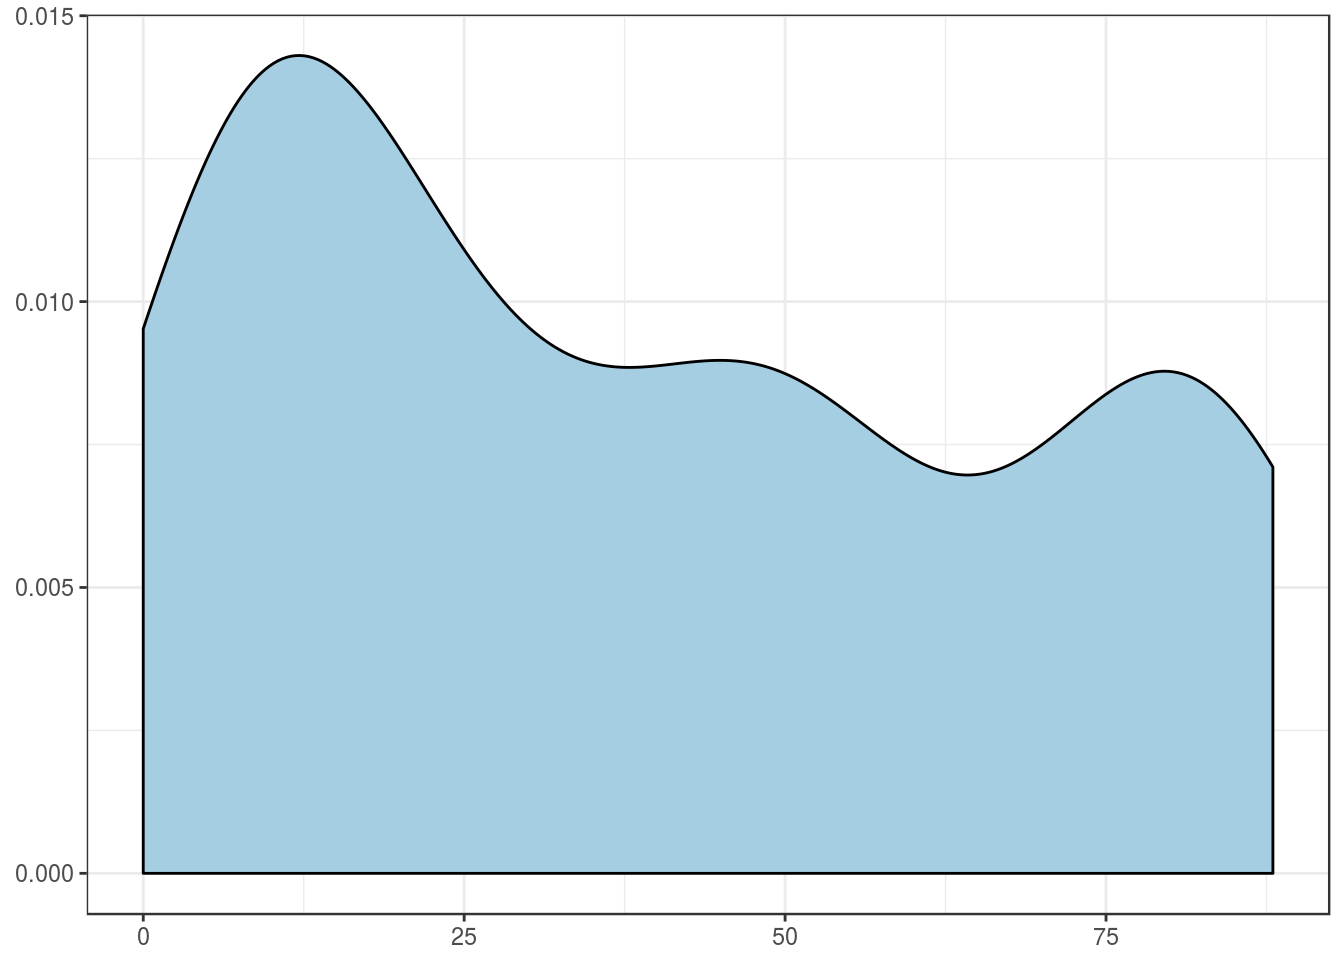
Follow-up length, in months,
Summary table
| Mean |
39.3 |
| Standard deviation |
29 |
| Median |
34.5 |
| Interquartile range |
53 |
| Mininum |
0 |
| Maximum |
88 |
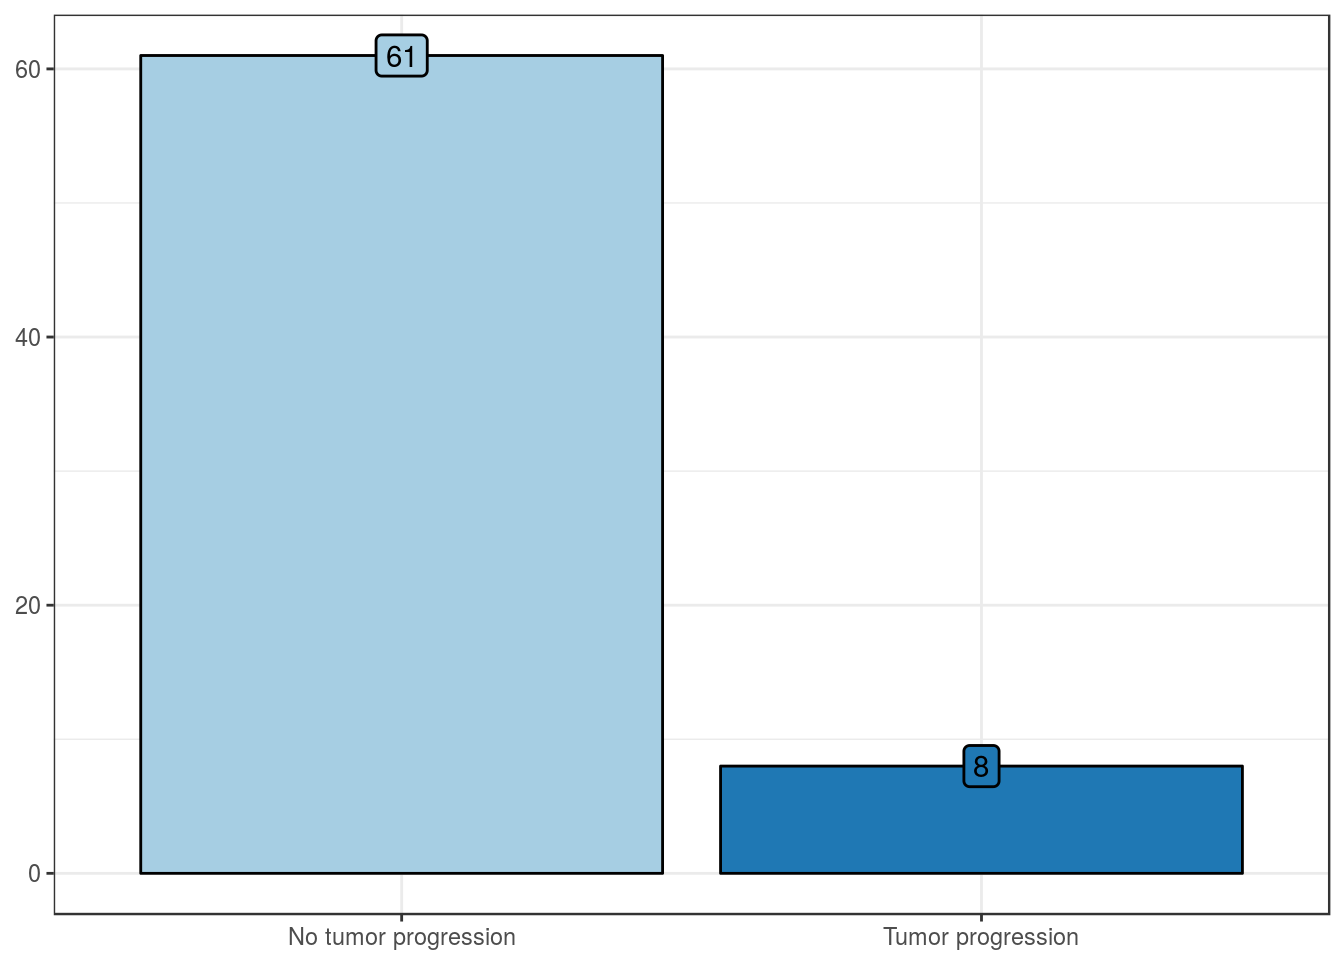
Tumor progression
Summary table
| No tumor progression |
61 (88) |
| Tumor progression |
8 (12) |
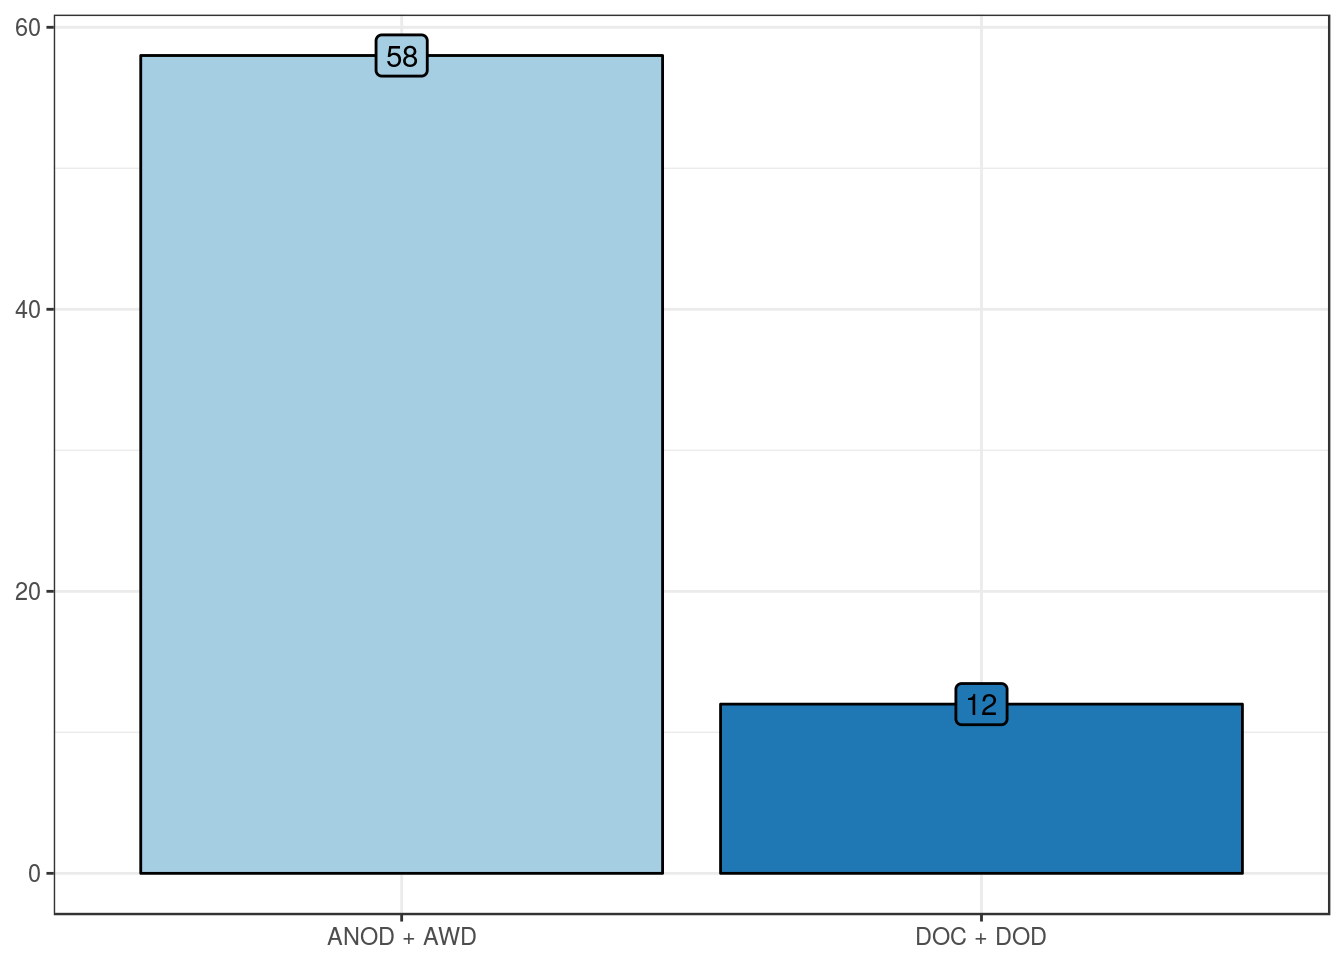
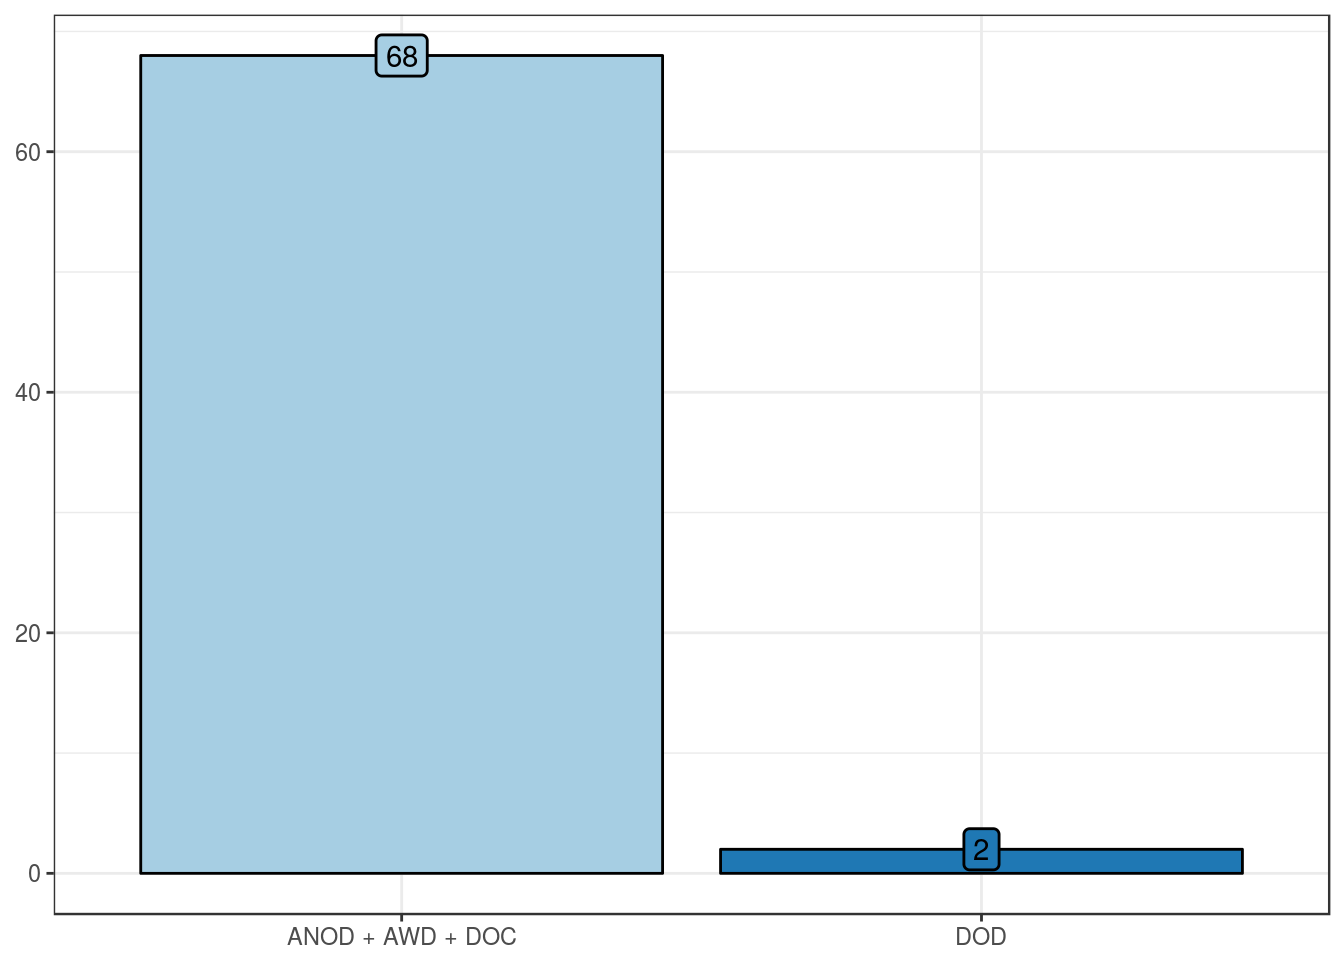
Overall mortality
Summary table
| ANOD + AWD |
58 (83) |
| DOC + DOD |
12 (17) |