PD-L1 expression in primary tumors
PD-L1 positivity in tumor cells
Clinical features
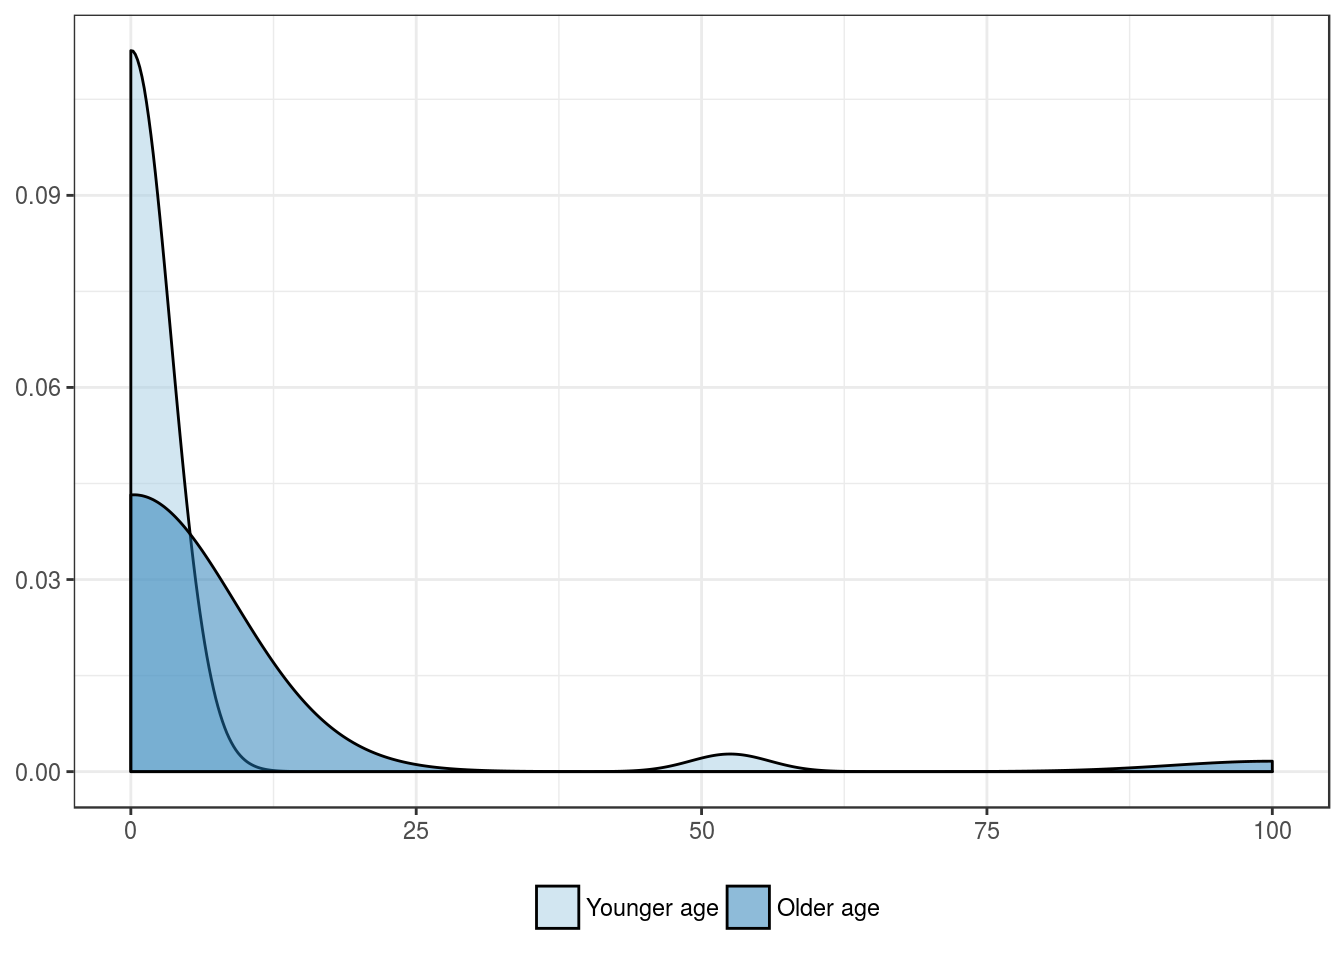
Patients’ age group, in years
| Younger age | Older age | |
|---|---|---|
| Mean | 1.3 | 4.0 |
| Standard deviation | 8.1 | 18.9 |
| Median | 0.0 | 0.0 |
| Interquartile range | 0.0 | 0.0 |
| Minimum | 0.0 | 0.0 |
| Maximum | 52.5 | 100.0 |
| Value | |
|---|---|
| U-statistic | 526 |
| P statistic | 1.8e-01 |


Patients’ sex
| Female | Male | |
|---|---|---|
| Mean | 5.3 | 1.3 |
| Standard deviation | 22.9 | 7.5 |
| Median | 0.0 | 0.0 |
| Interquartile range | 0.0 | 0.0 |
| Minimum | 0.0 | 0.0 |
| Maximum | 100.0 | 52.5 |
| Value | |
|---|---|
| U-statistic | 515 |
| P statistic | 4.7e-01 |
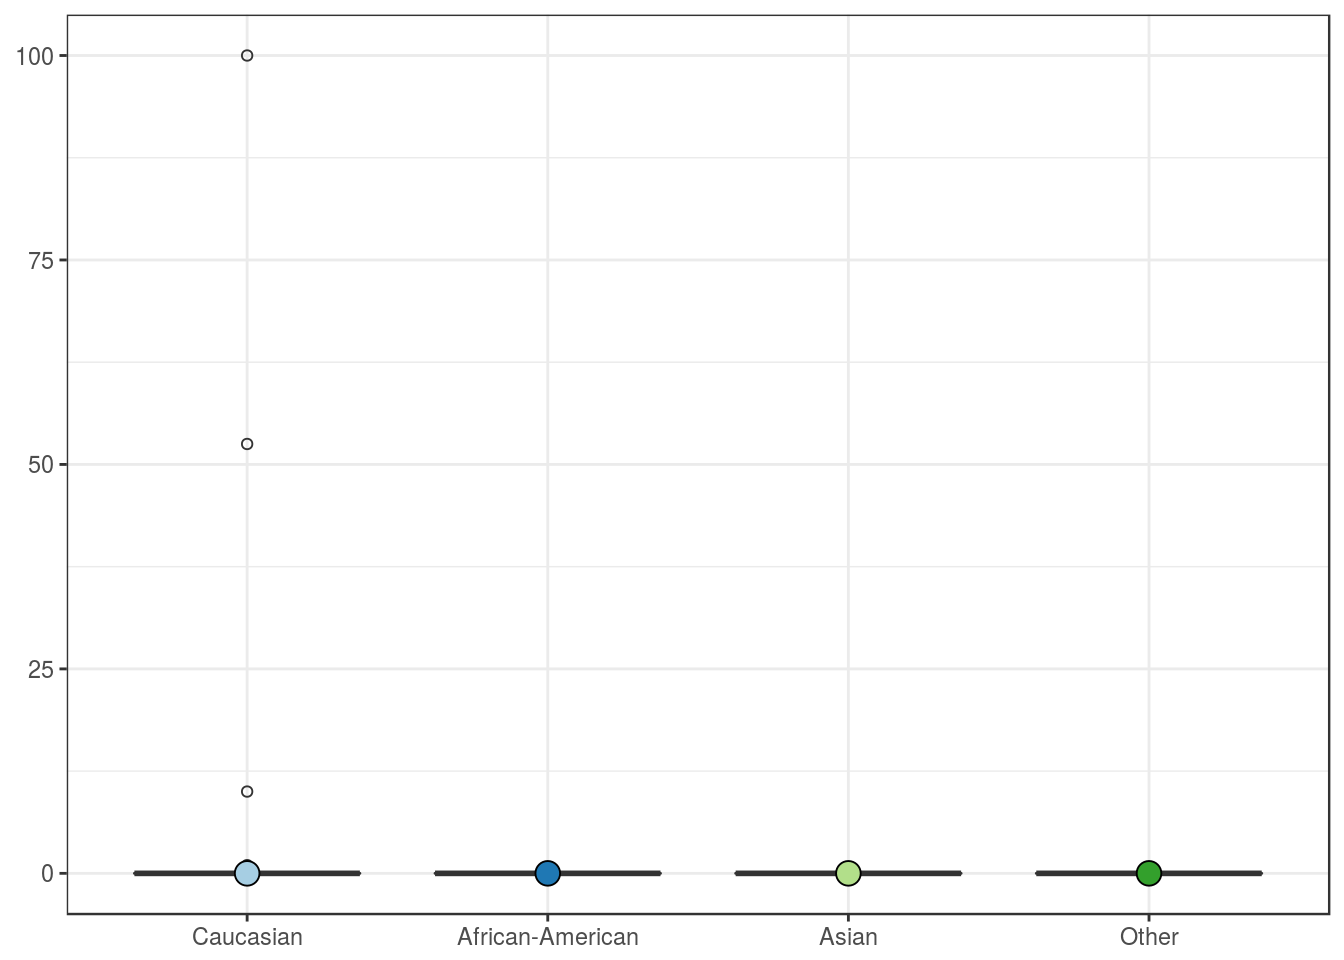
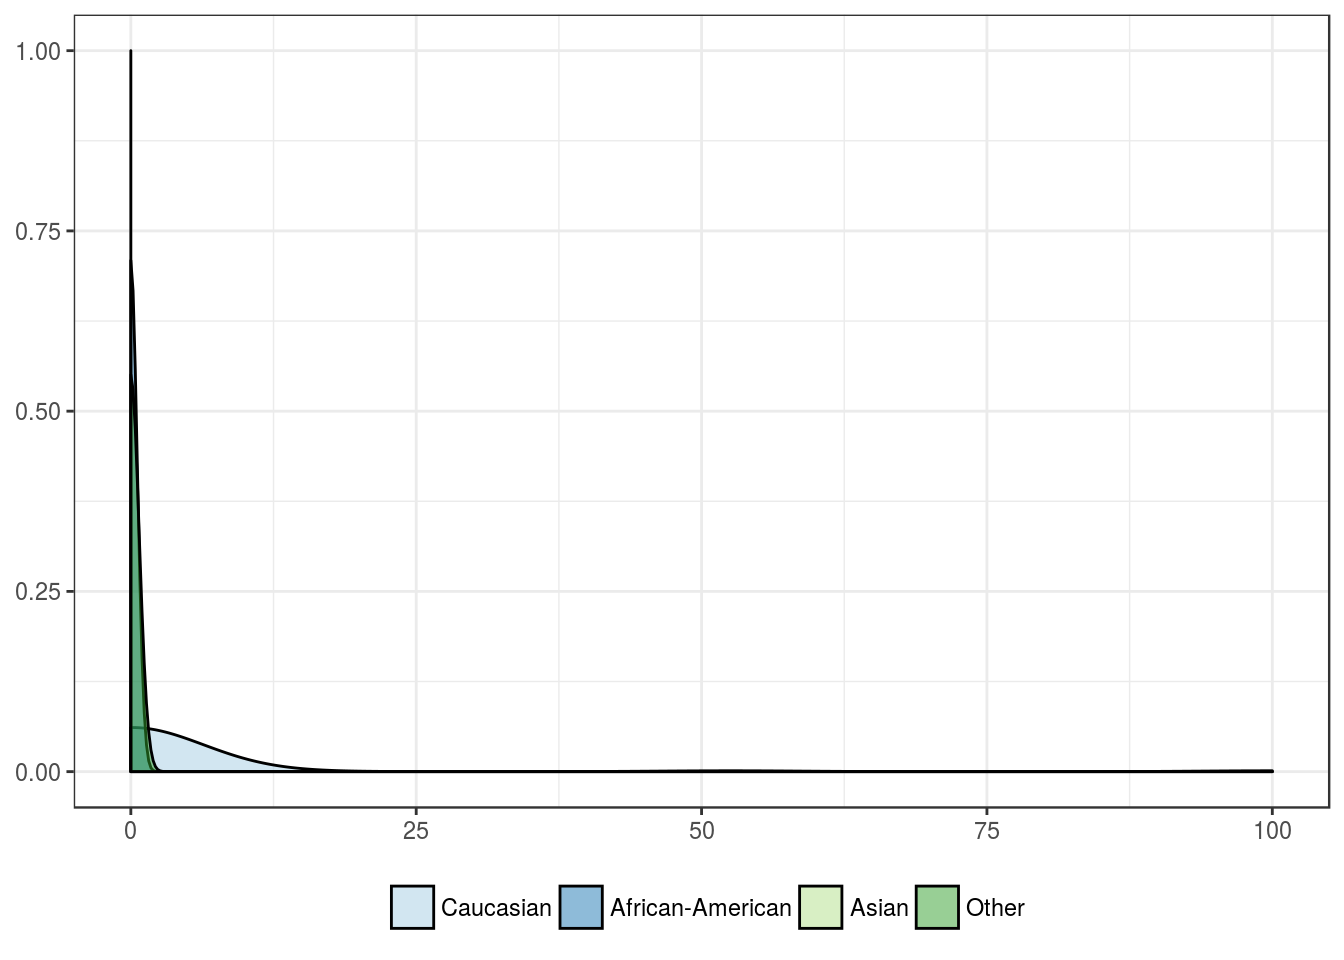
Patients’ race
| Caucasian | African-American | Asian | Other | |
|---|---|---|---|---|
| Mean | 3.1 | 0 | 0 | 0 |
| Standard deviation | 15.3 | 0 | NA | 0 |
| Median | 0.0 | 0 | 0 | 0 |
| Interquartile range | 0.0 | 0 | 0 | 0 |
| Minimum | 0.0 | 0 | 0 | 0 |
| Maximum | 100.0 | 0 | 0 | 0 |
| Value | |
|---|---|
| Statistic | 2.626 |
| Parameter | 3 |
| P statistic | 0.45 |

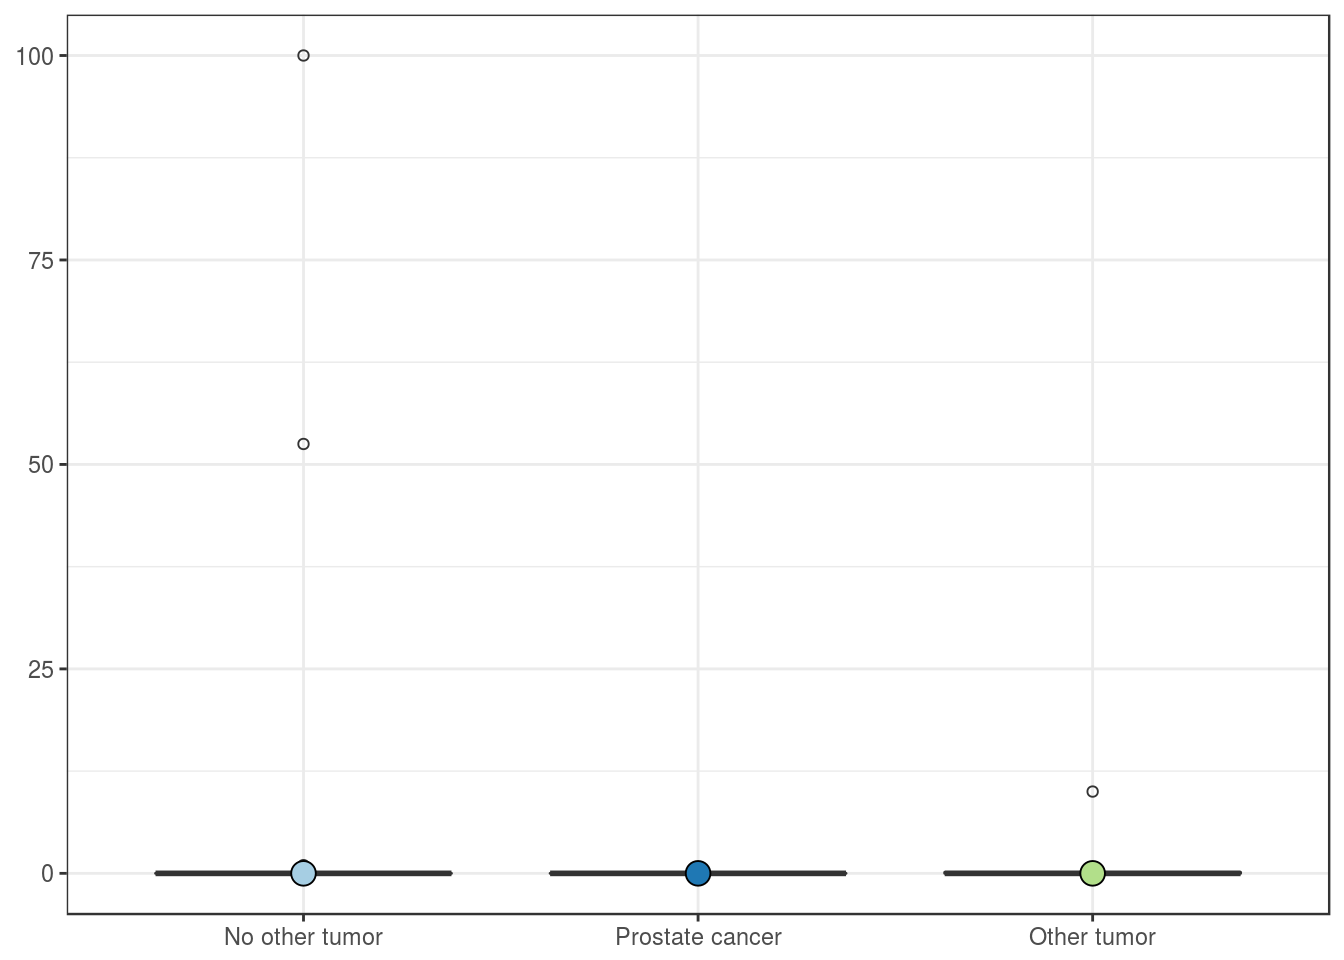
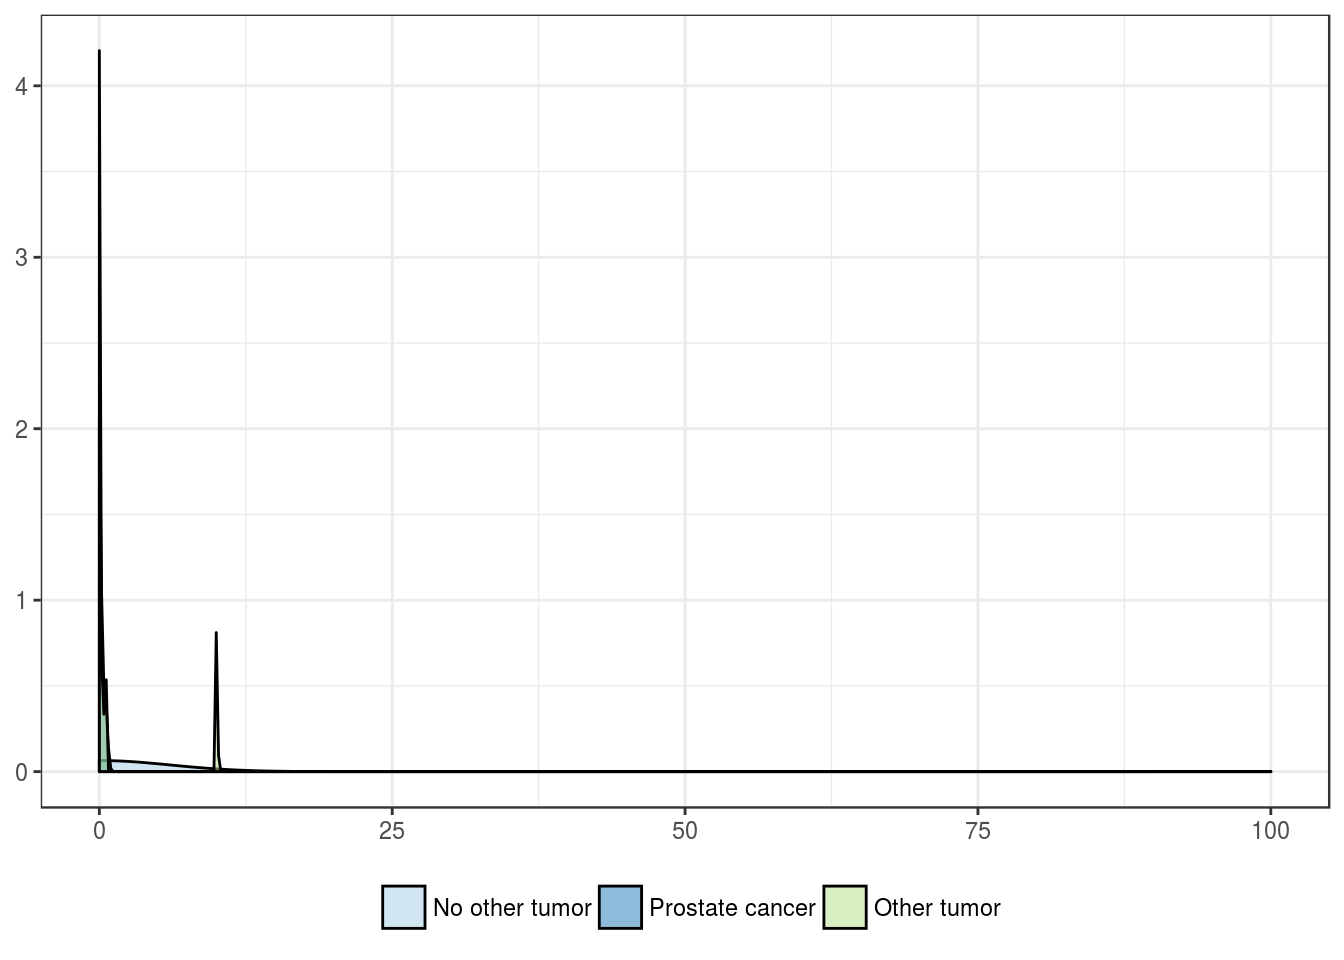
History of other malignancies
| No other tumor | Prostate cancer | Other tumor | |
|---|---|---|---|
| Mean | 2.7 | 0.1 | 1.3 |
| Standard deviation | 14.8 | 0.2 | 3.5 |
| Median | 0.0 | 0.0 | 0.0 |
| Interquartile range | 0.0 | 0.0 | 0.1 |
| Minimum | 0.0 | 0.0 | 0.0 |
| Maximum | 100.0 | 0.5 | 10.0 |
| Value | |
|---|---|
| Statistic | 1.942 |
| Parameter | 2 |
| P statistic | 0.38 |


Pathologic features
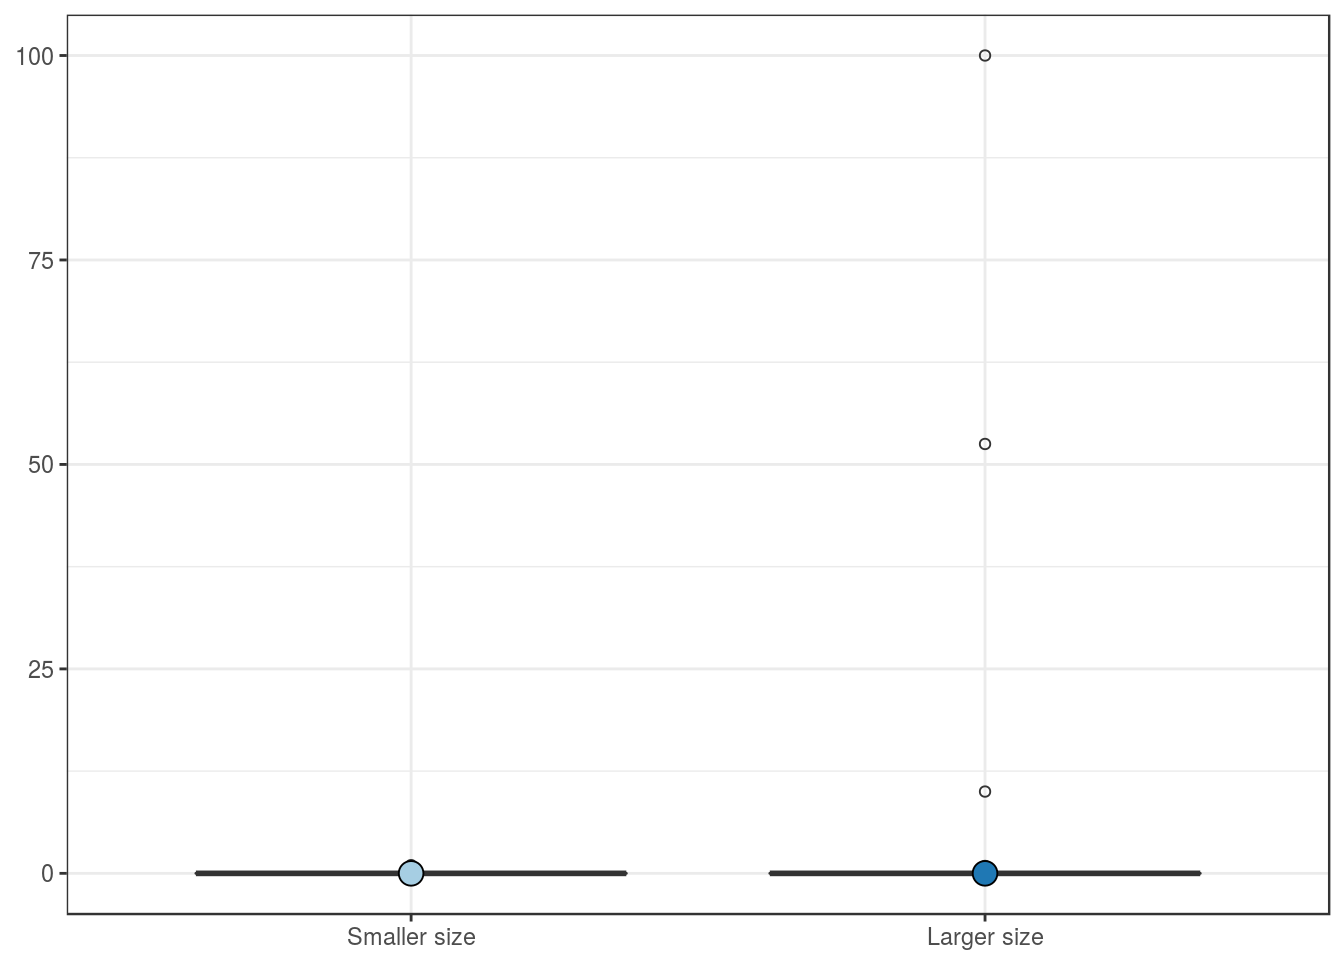
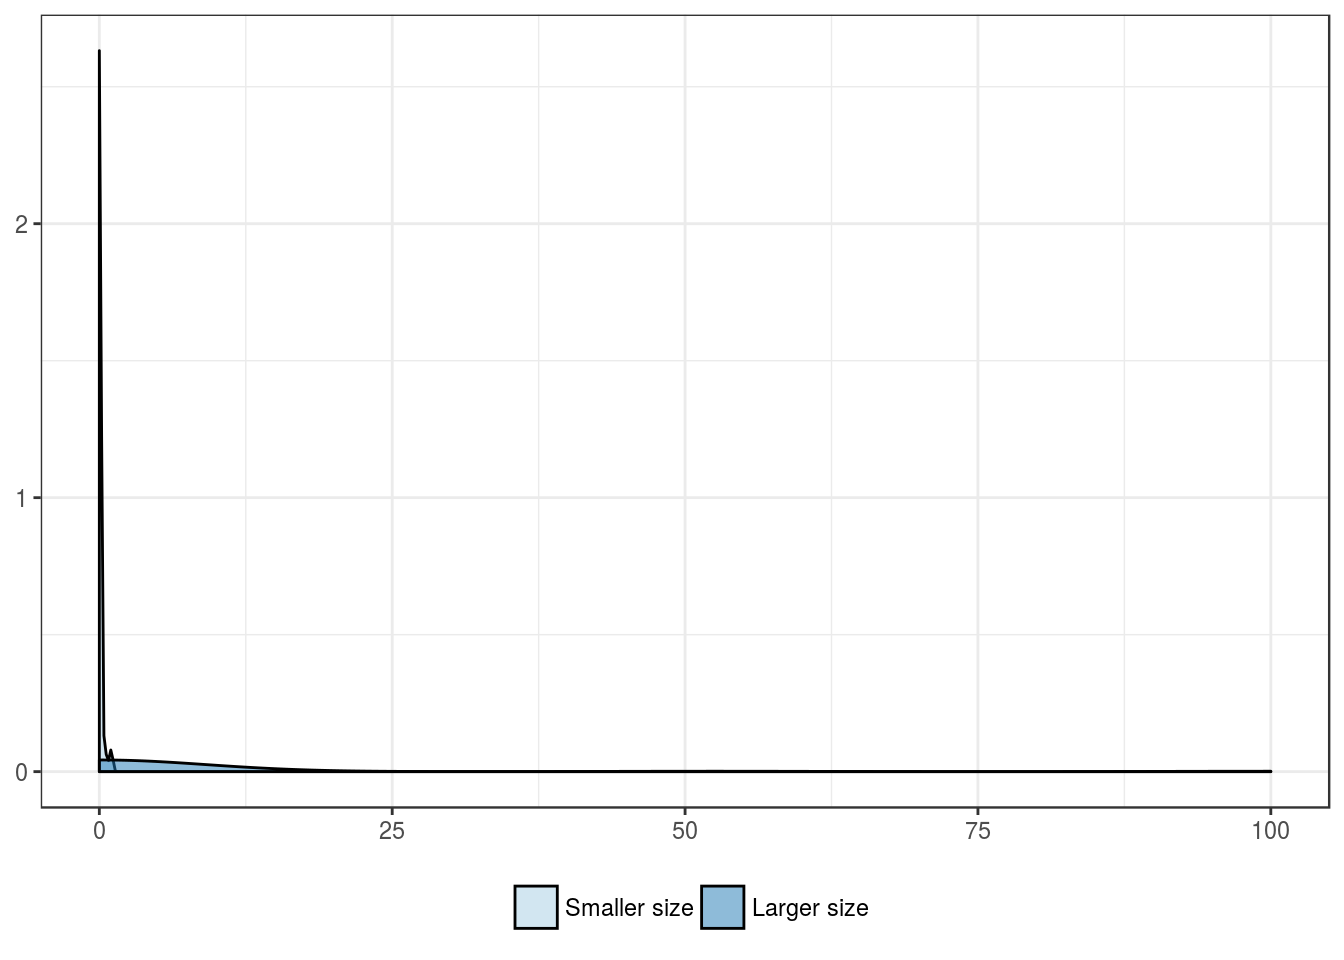
Tumor size group
| Smaller size | Larger size | |
|---|---|---|
| Mean | 0.0 | 5.0 |
| Standard deviation | 0.2 | 19.4 |
| Median | 0.0 | 0.0 |
| Interquartile range | 0.0 | 0.0 |
| Minimum | 0.0 | 0.0 |
| Maximum | 1.0 | 100.0 |
| Value | |
|---|---|
| U-statistic | 517 |
| P statistic | 9.8e-02 |


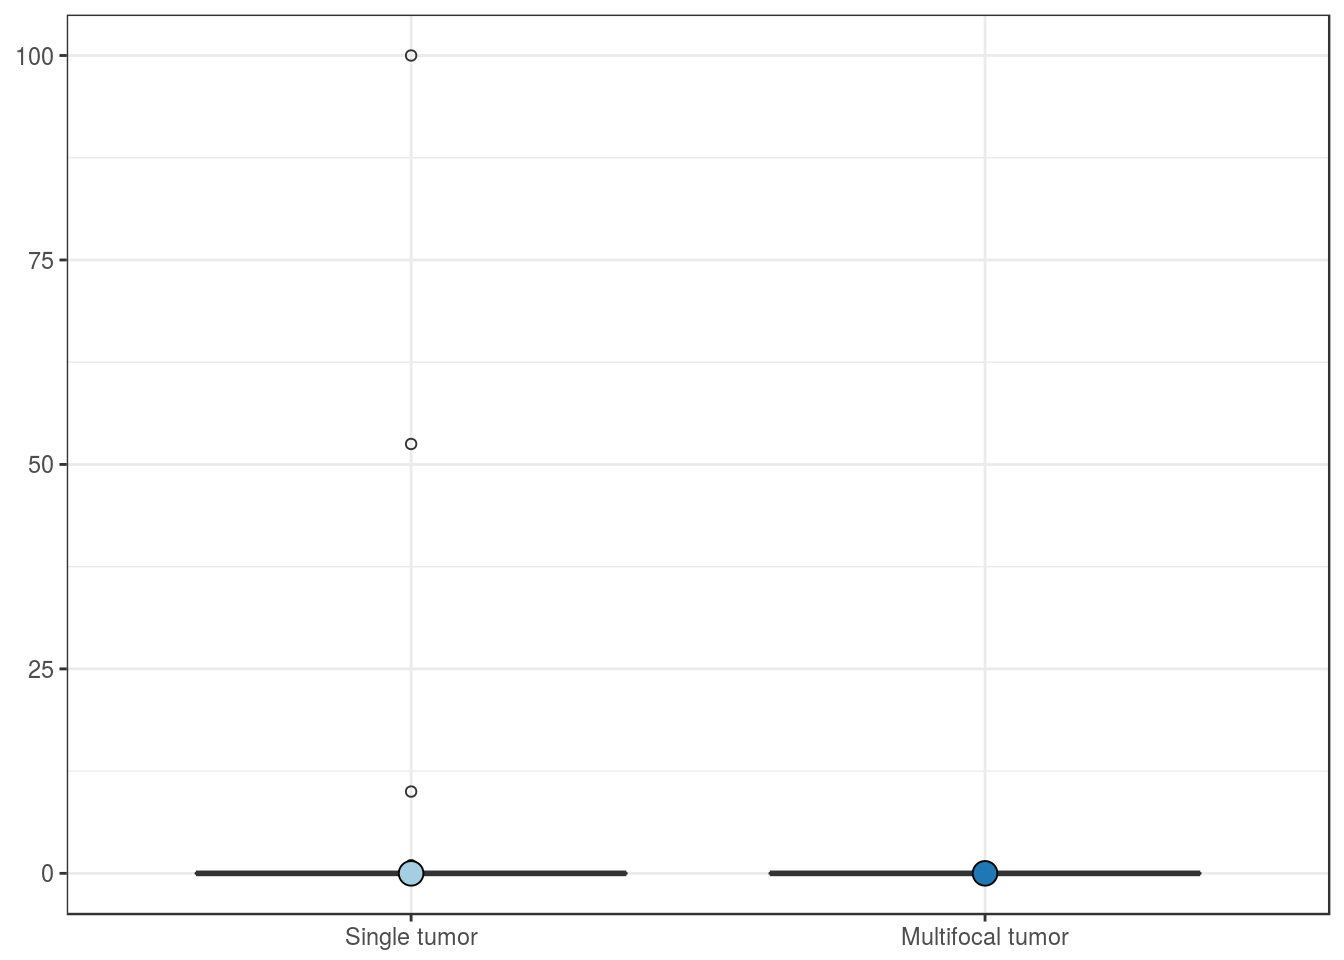
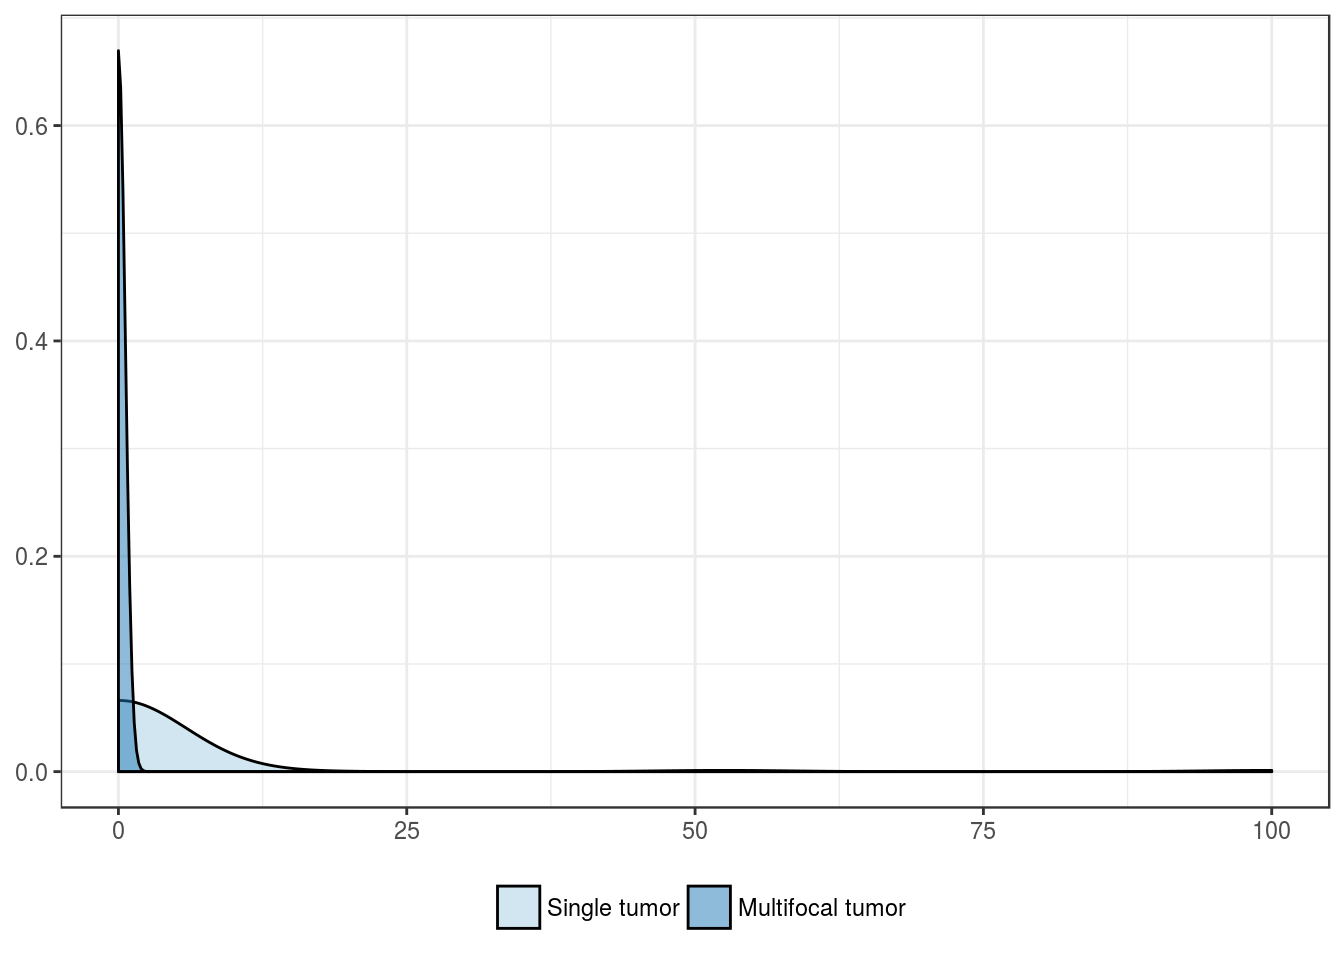
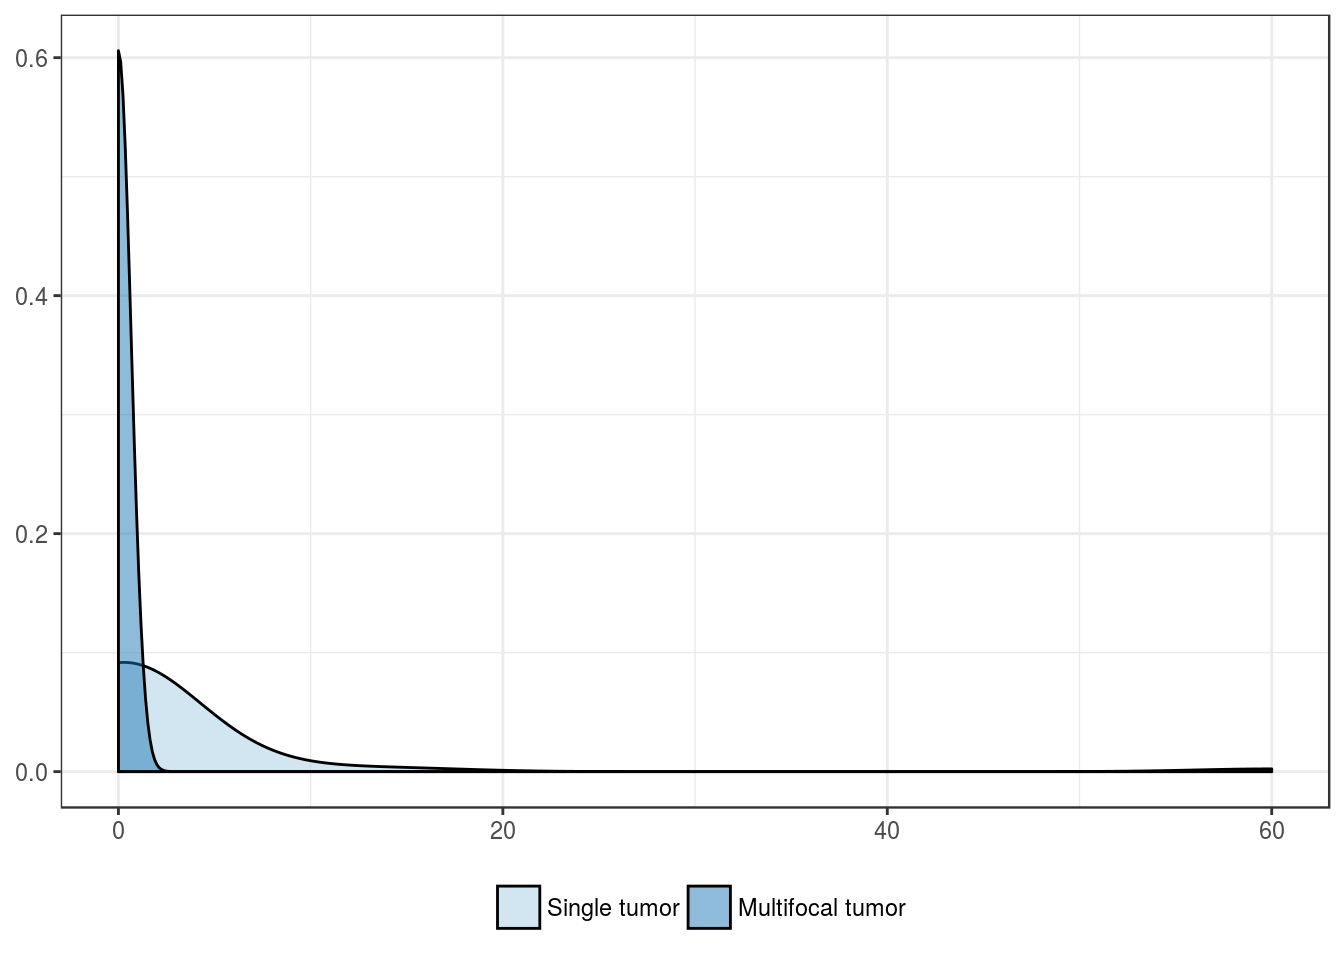
Multifocality
| Single tumor | Multifocal tumor | |
|---|---|---|
| Mean | 2.8 | 0 |
| Standard deviation | 14.5 | 0 |
| Median | 0.0 | 0 |
| Interquartile range | 0.0 | 0 |
| Minimum | 0.0 | 0 |
| Maximum | 100.0 | 0 |
| Value | |
|---|---|
| U-statistic | 306 |
| P statistic | 2.6e-01 |

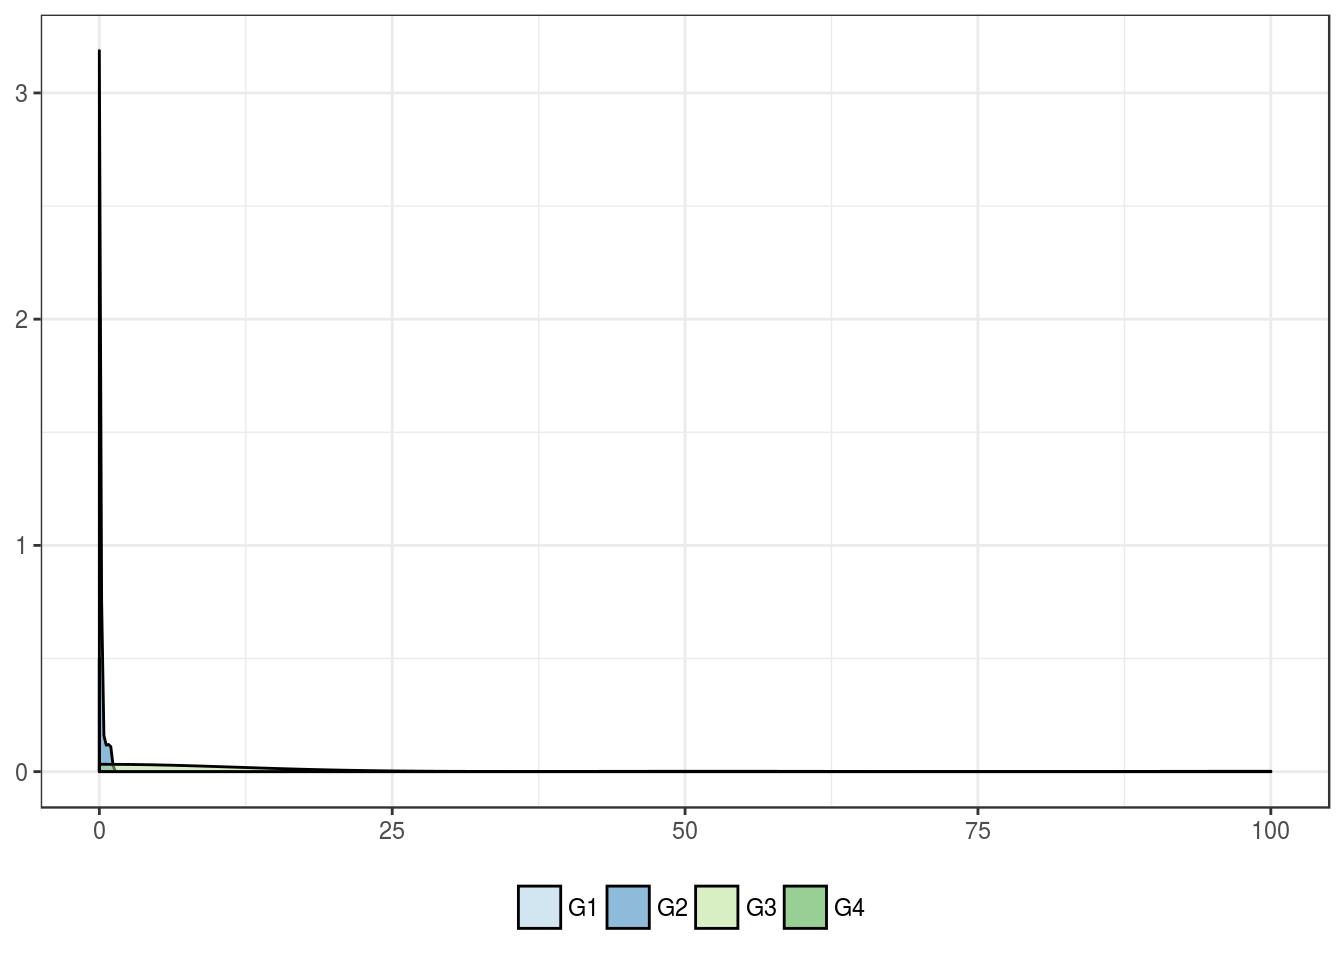
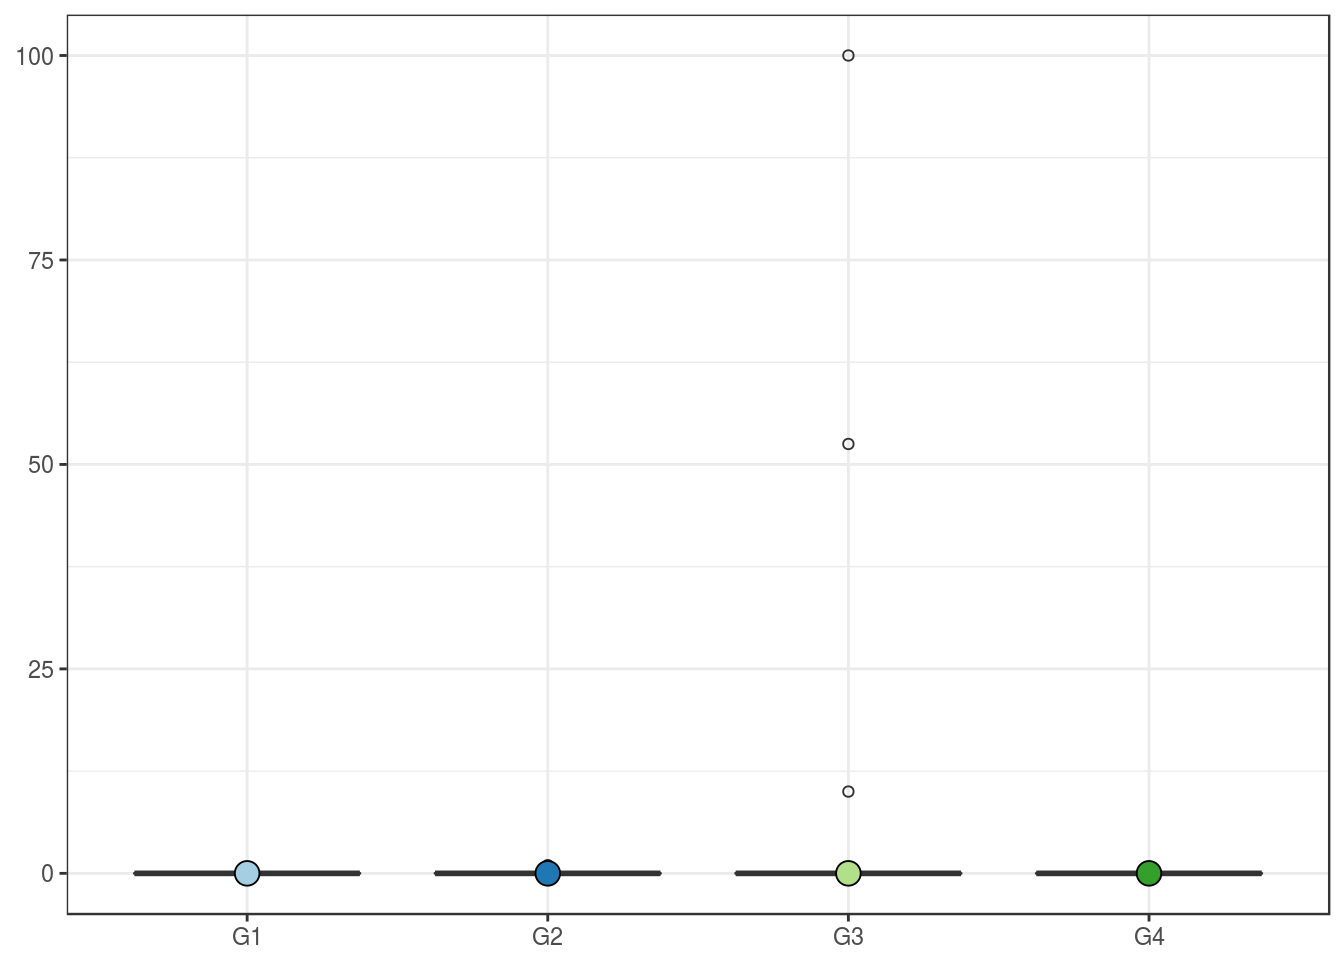
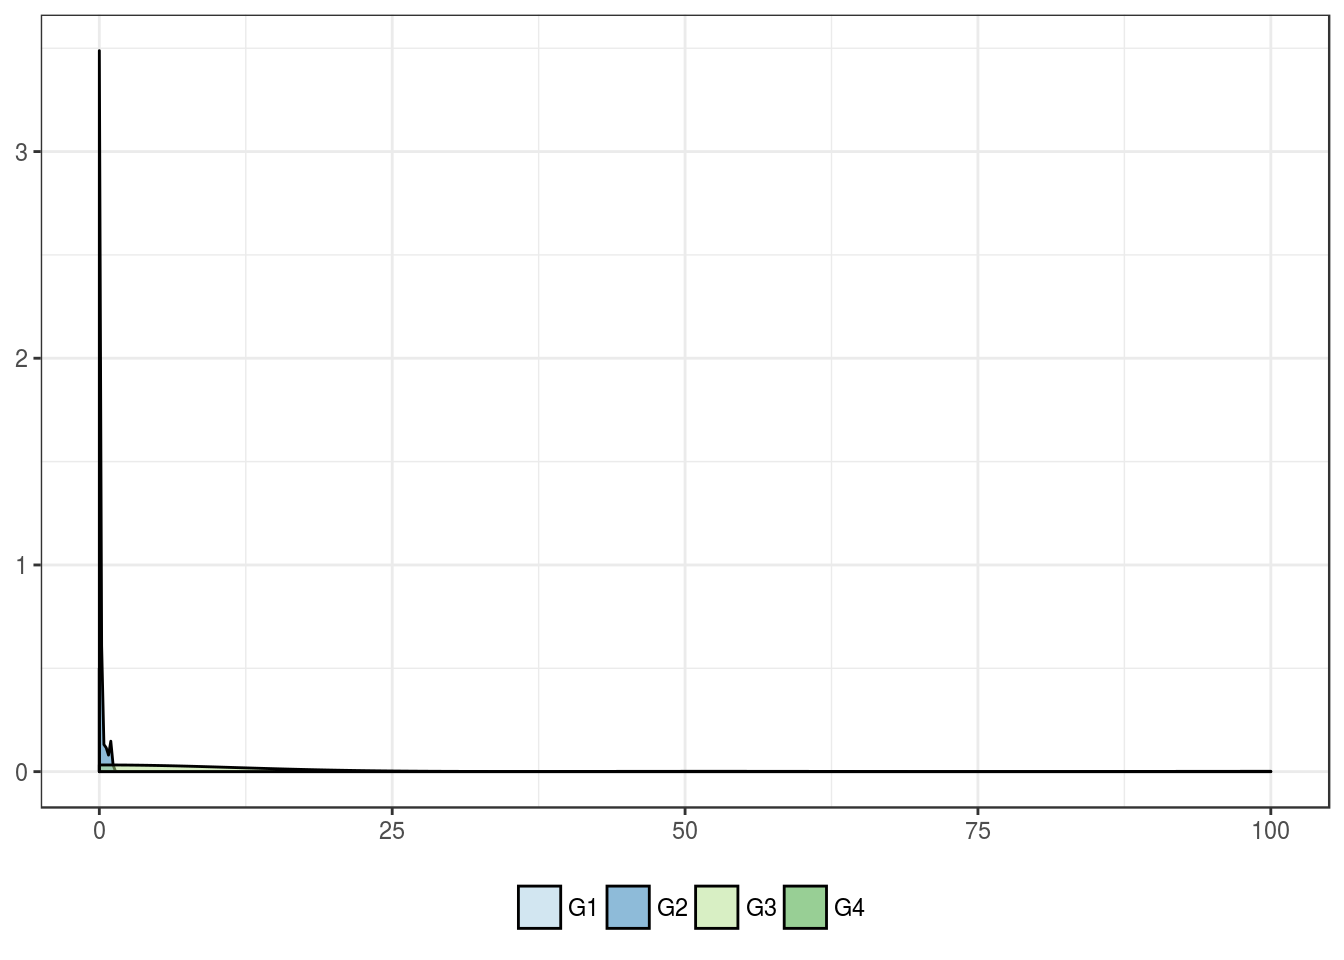
Fuhrman grade
| G1 | G2 | G3 | G4 | |
|---|---|---|---|---|
| Mean | 0 | 0.1 | 7.1 | 0 |
| Standard deviation | 0 | 0.2 | 23.1 | 0 |
| Median | 0 | 0.0 | 0.0 | 0 |
| Interquartile range | 0 | 0.0 | 0.0 | 0 |
| Minimum | 0 | 0.0 | 0.0 | 0 |
| Maximum | 0 | 1.0 | 100.0 | 0 |
| Value | |
|---|---|
| Statistic | 1.658 |
| Parameter | 3 |
| P statistic | 0.65 |

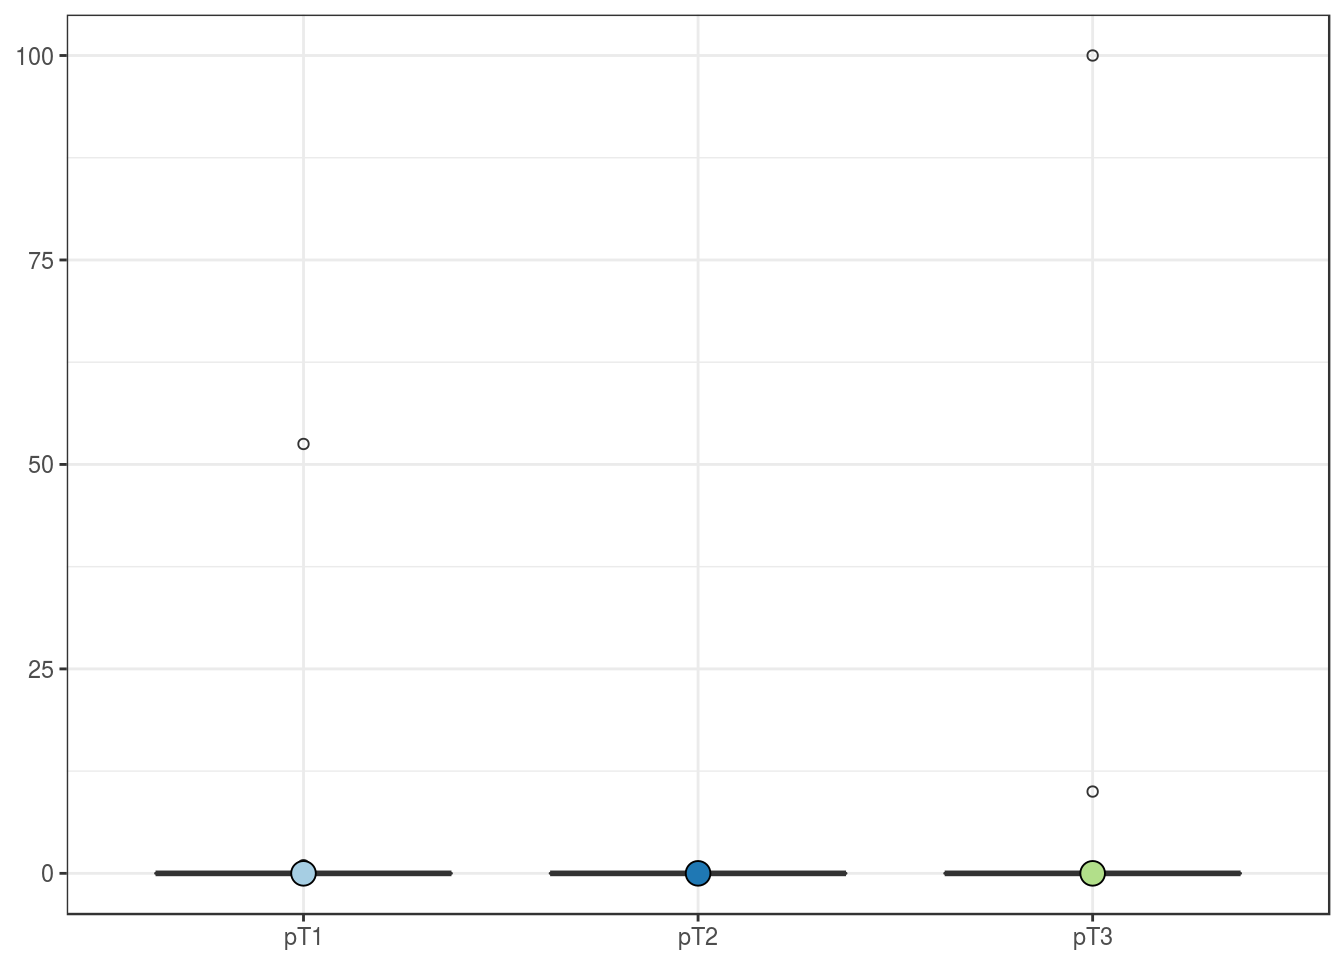
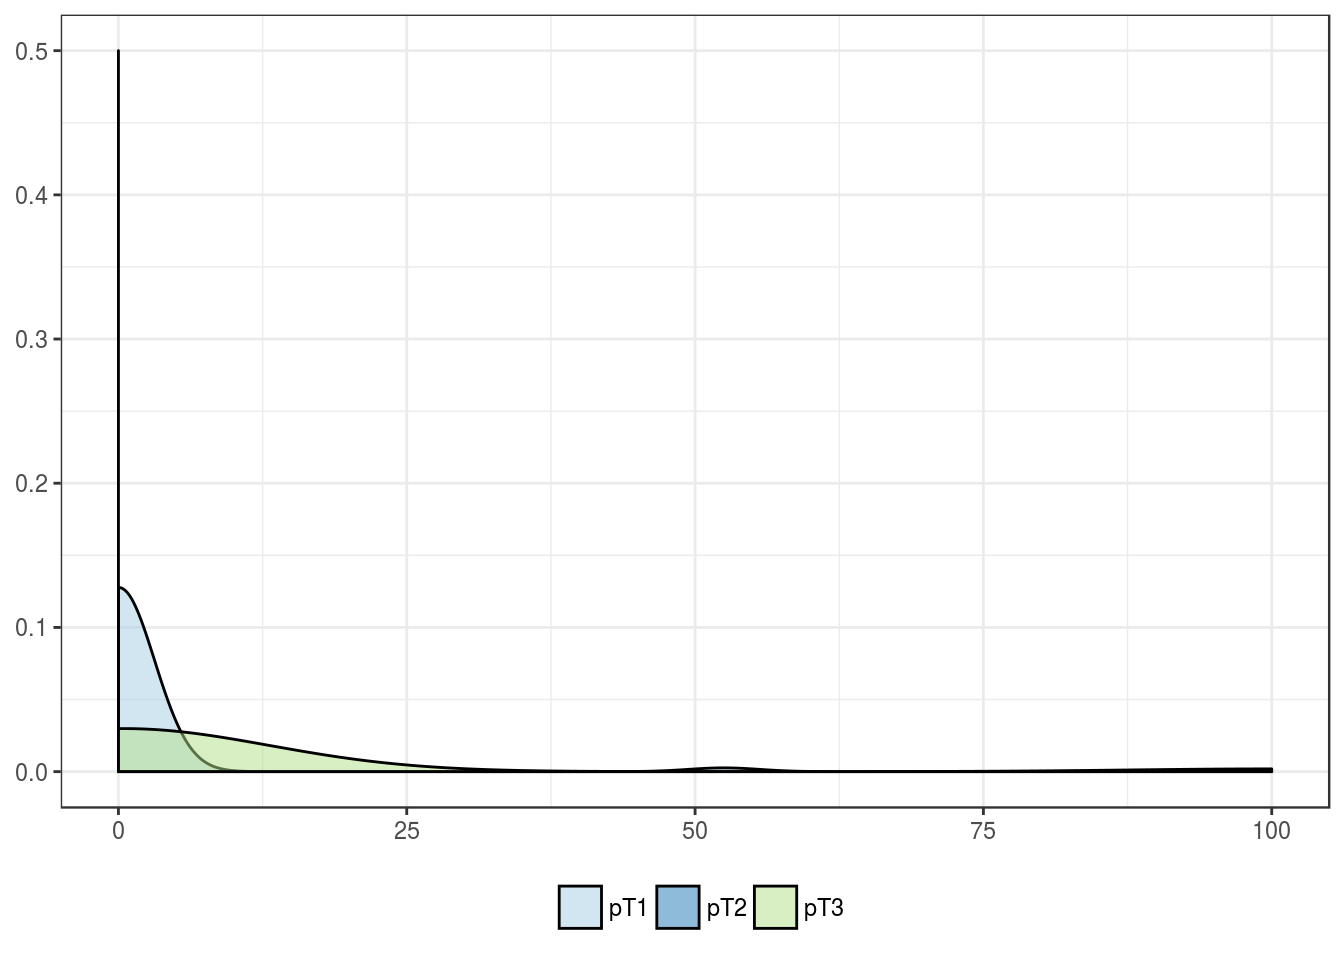
pT stage
| pT1 | pT2 | pT3 | |
|---|---|---|---|
| Mean | 1.1 | 0 | 6.5 |
| Standard deviation | 7.4 | 0 | 24.2 |
| Median | 0.0 | 0 | 0.0 |
| Interquartile range | 0.0 | 0 | 0.0 |
| Minimum | 0.0 | 0 | 0.0 |
| Maximum | 52.5 | 0 | 100.0 |
| Value | |
|---|---|
| Statistic | 1.085 |
| Parameter | 2 |
| P statistic | 0.58 |

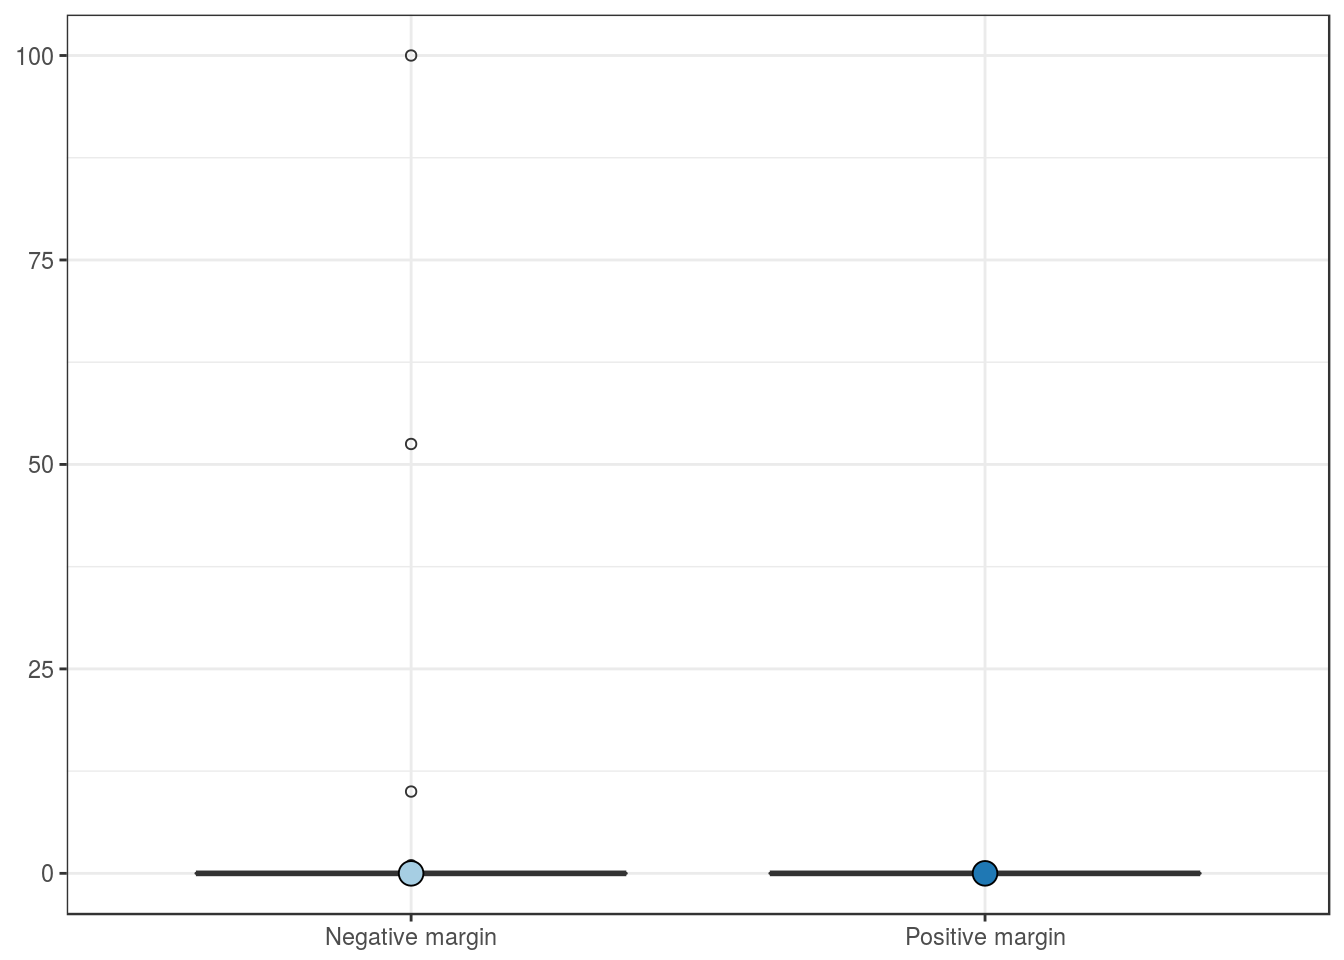
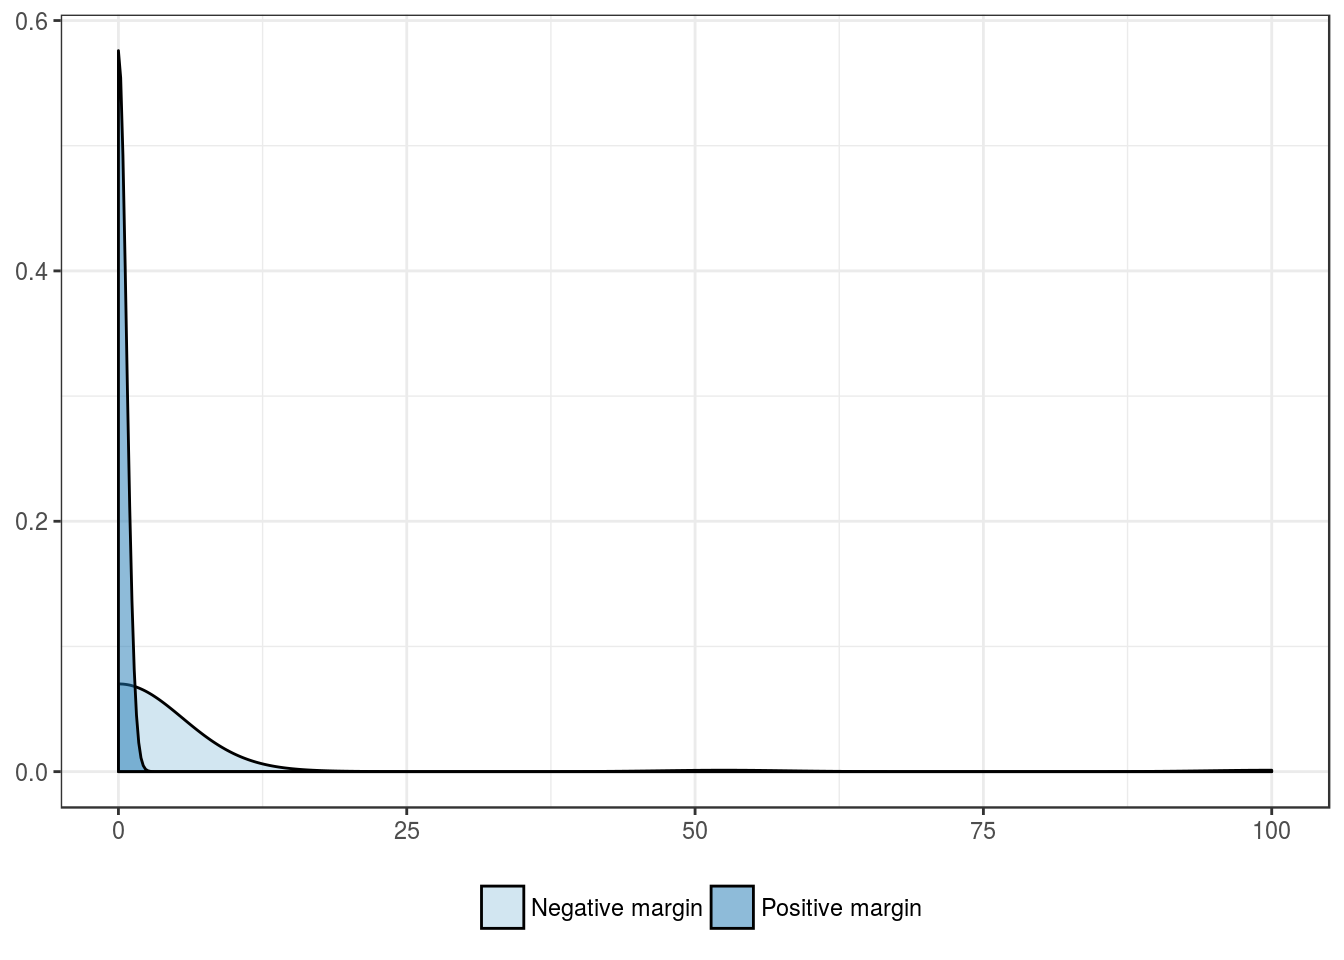
Surgical margin
| Negative margin | Positive margin | |
|---|---|---|
| Mean | 2.6 | 0 |
| Standard deviation | 13.9 | 0 |
| Median | 0.0 | 0 |
| Interquartile range | 0.0 | 0 |
| Minimum | 0.0 | 0 |
| Maximum | 100.0 | 0 |
| Value | |
|---|---|
| U-statistic | 146 |
| P statistic | 4.7e-01 |
Outcome features
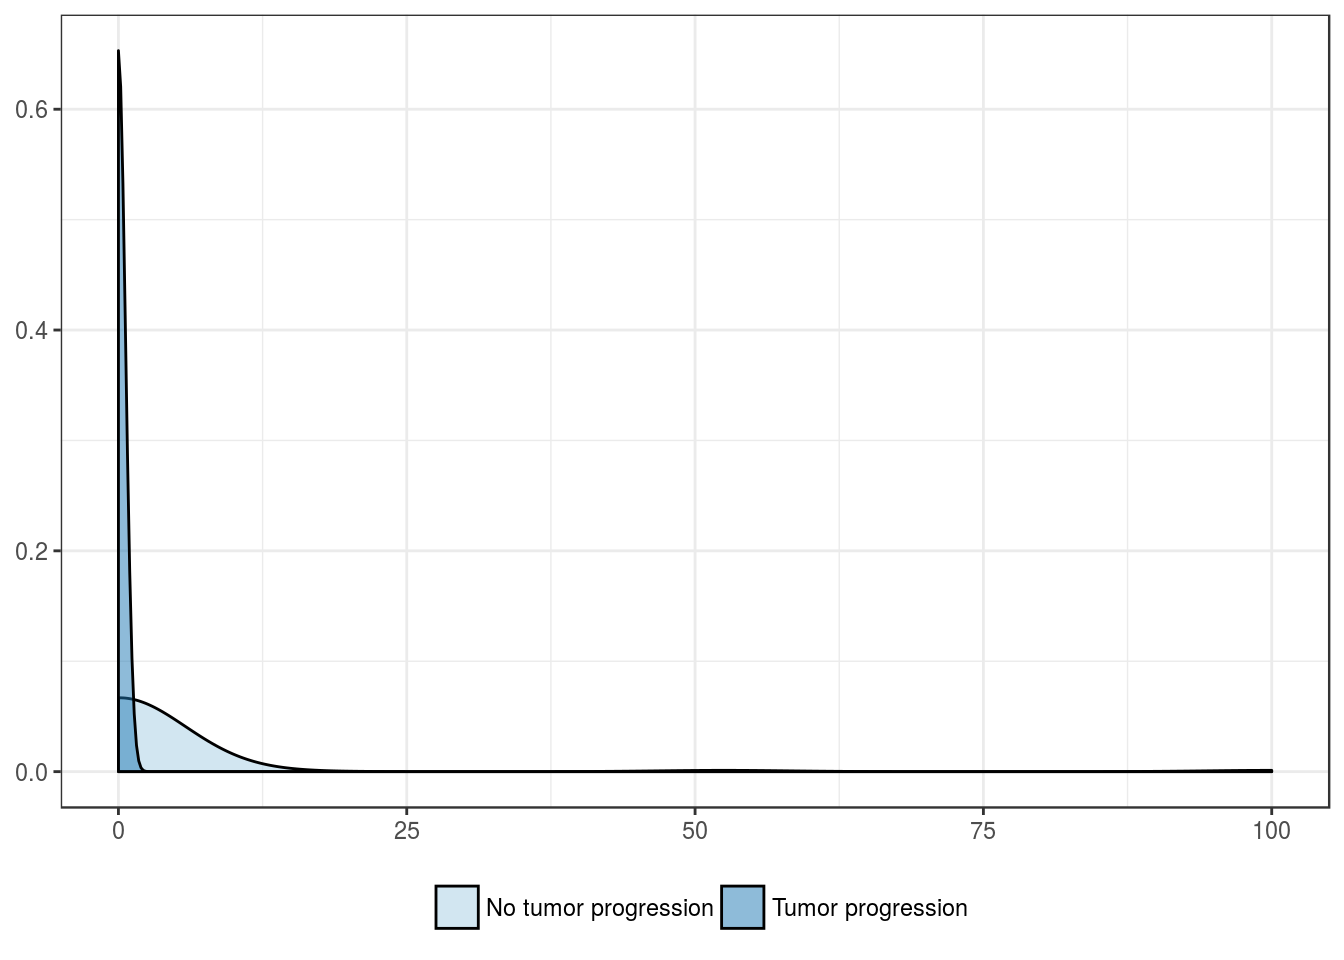
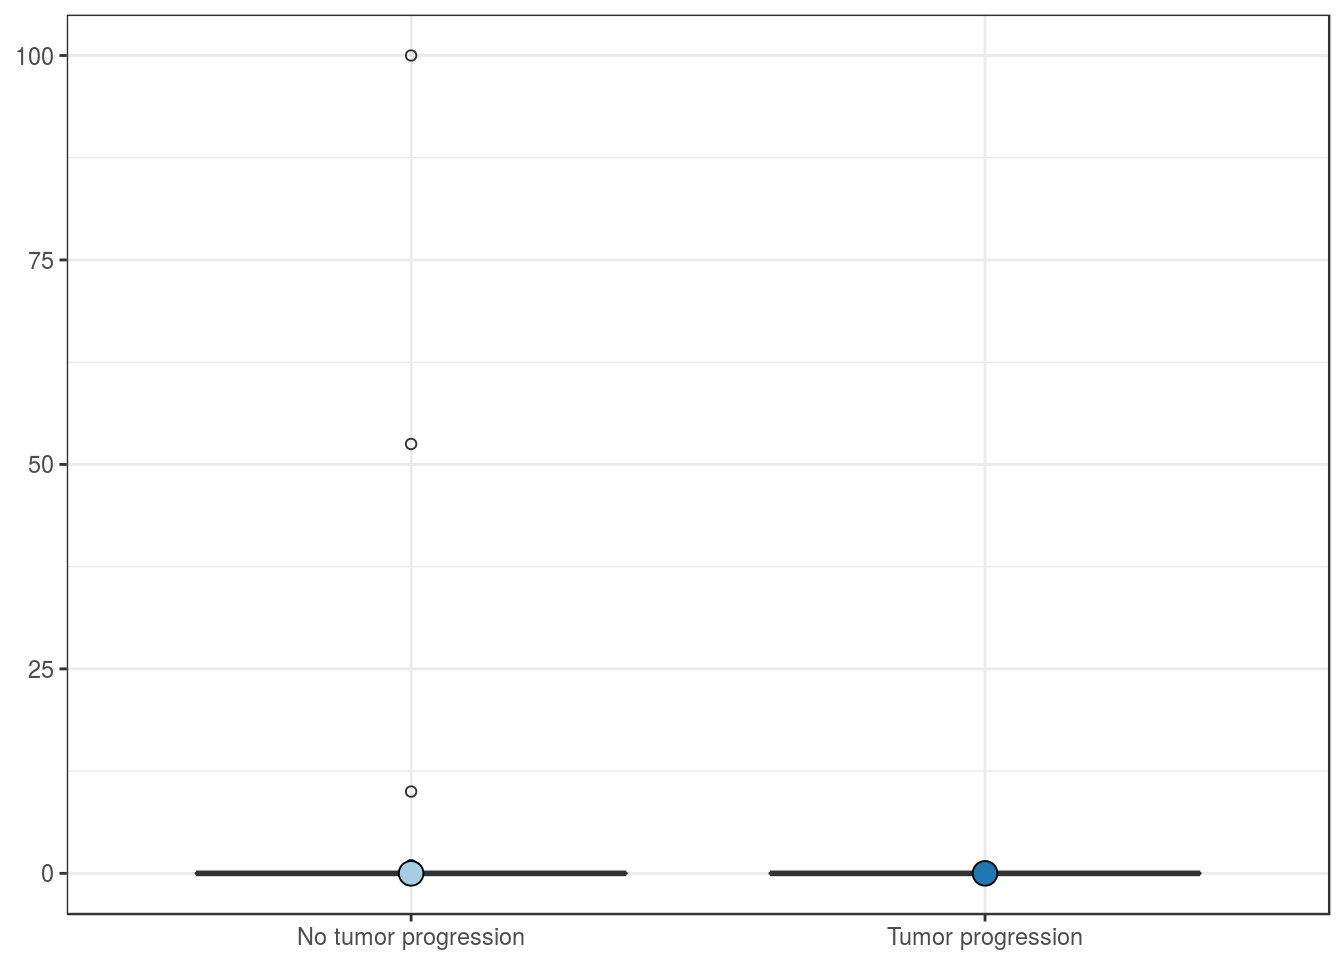
Tumor progression
| No tumor progression | Tumor progression | |
|---|---|---|
| Mean | 2.7 | 0 |
| Standard deviation | 14.4 | 0 |
| Median | 0.0 | 0 |
| Interquartile range | 0.0 | 0 |
| Minimum | 0.0 | 0 |
| Maximum | 100.0 | 0 |
| Value | |
|---|---|
| U-statistic | 276 |
| P statistic | 2.9e-01 |

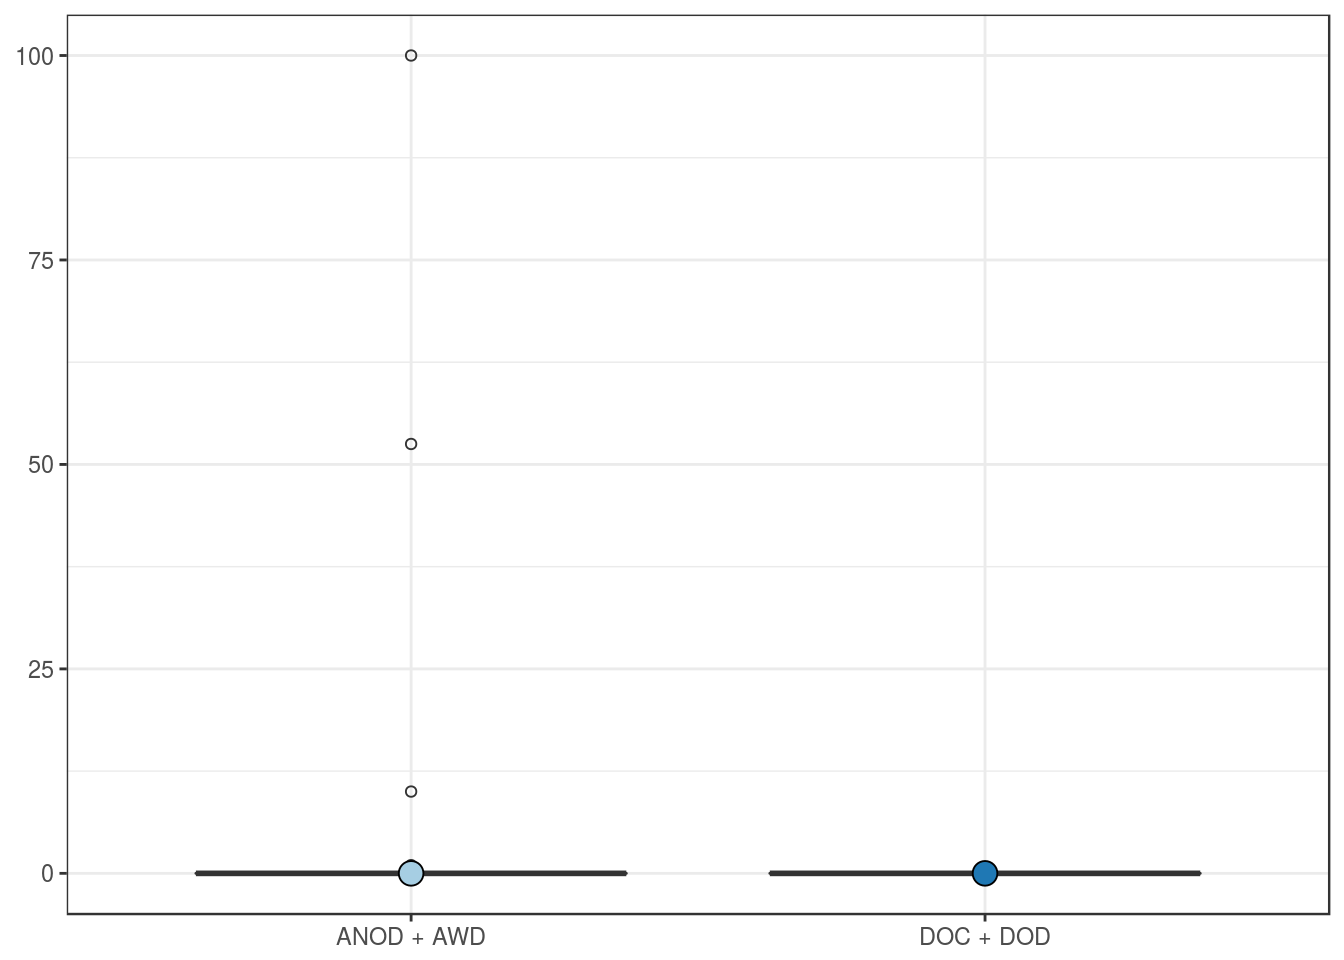
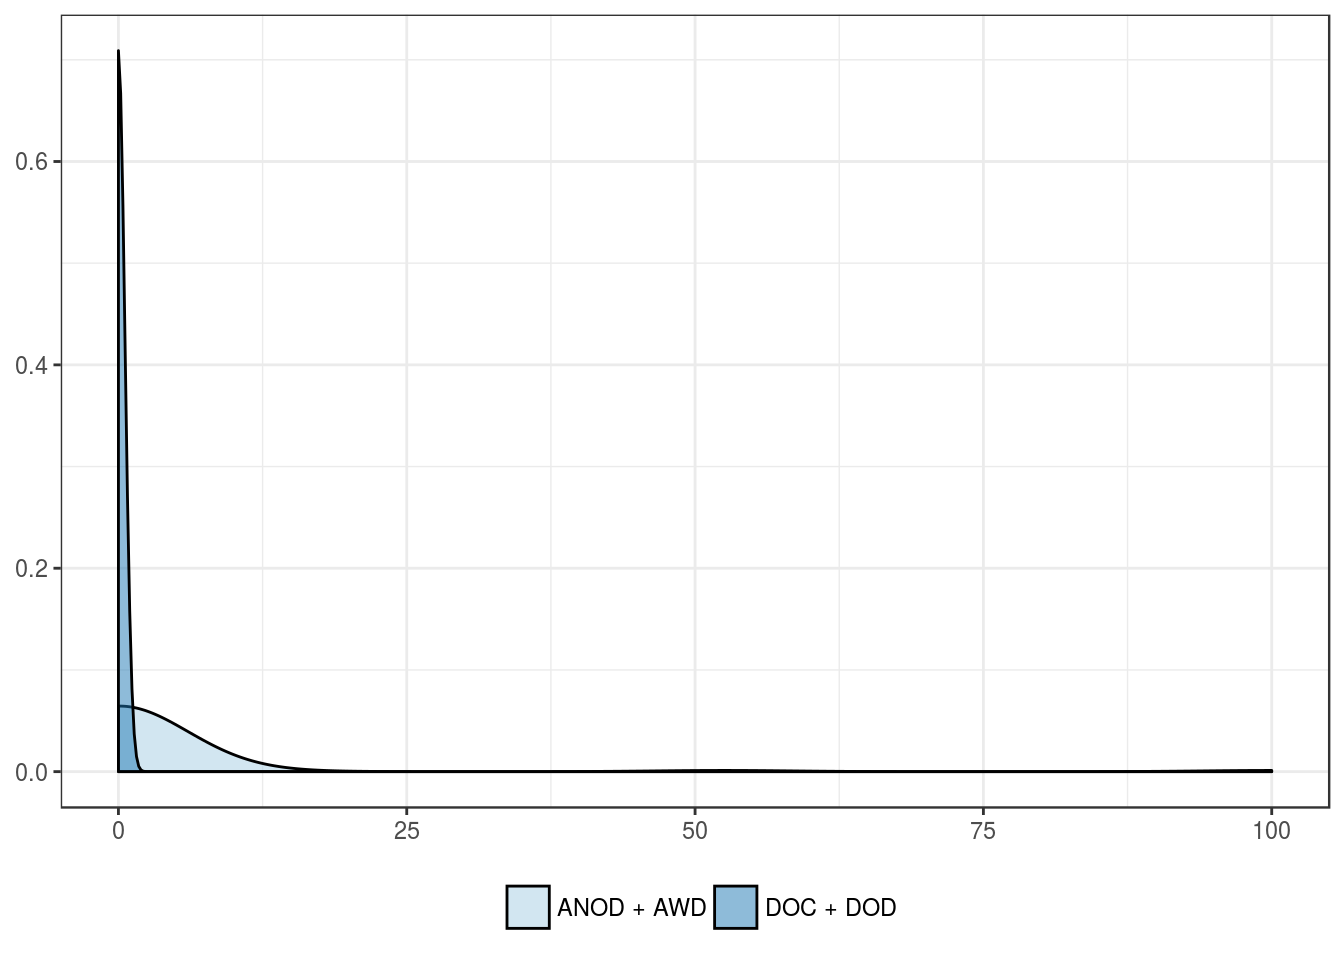
Overall mortality
| ANOD + AWD | DOC + DOD | |
|---|---|---|
| Mean | 2.9 | 0 |
| Standard deviation | 14.7 | 0 |
| Median | 0.0 | 0 |
| Interquartile range | 0.0 | 0 |
| Minimum | 0.0 | 0 |
| Maximum | 100.0 | 0 |
| Value | |
|---|---|
| U-statistic | 396 |
| P statistic | 1.8e-01 |

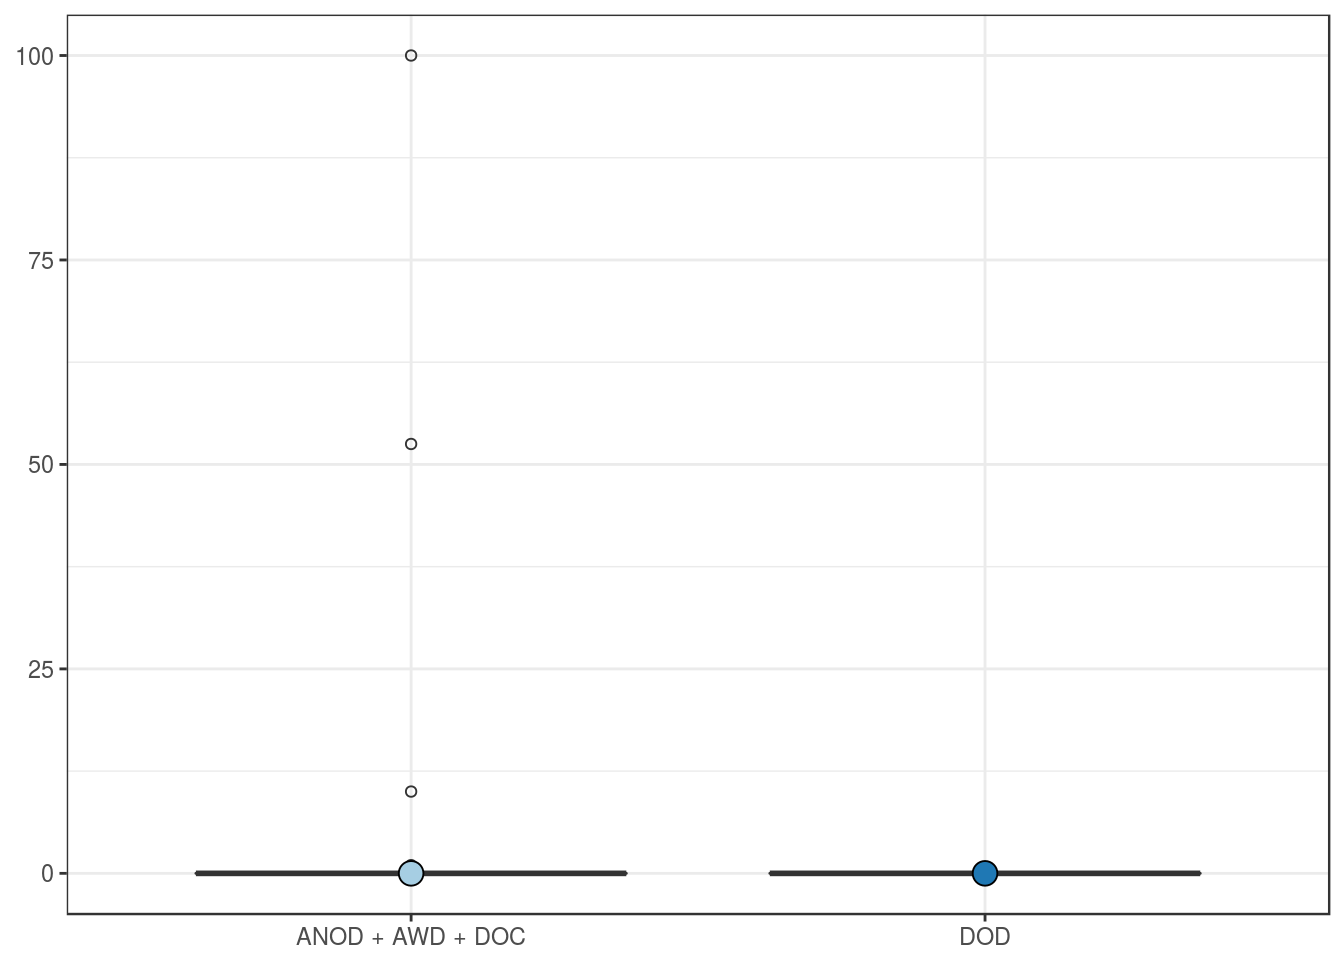
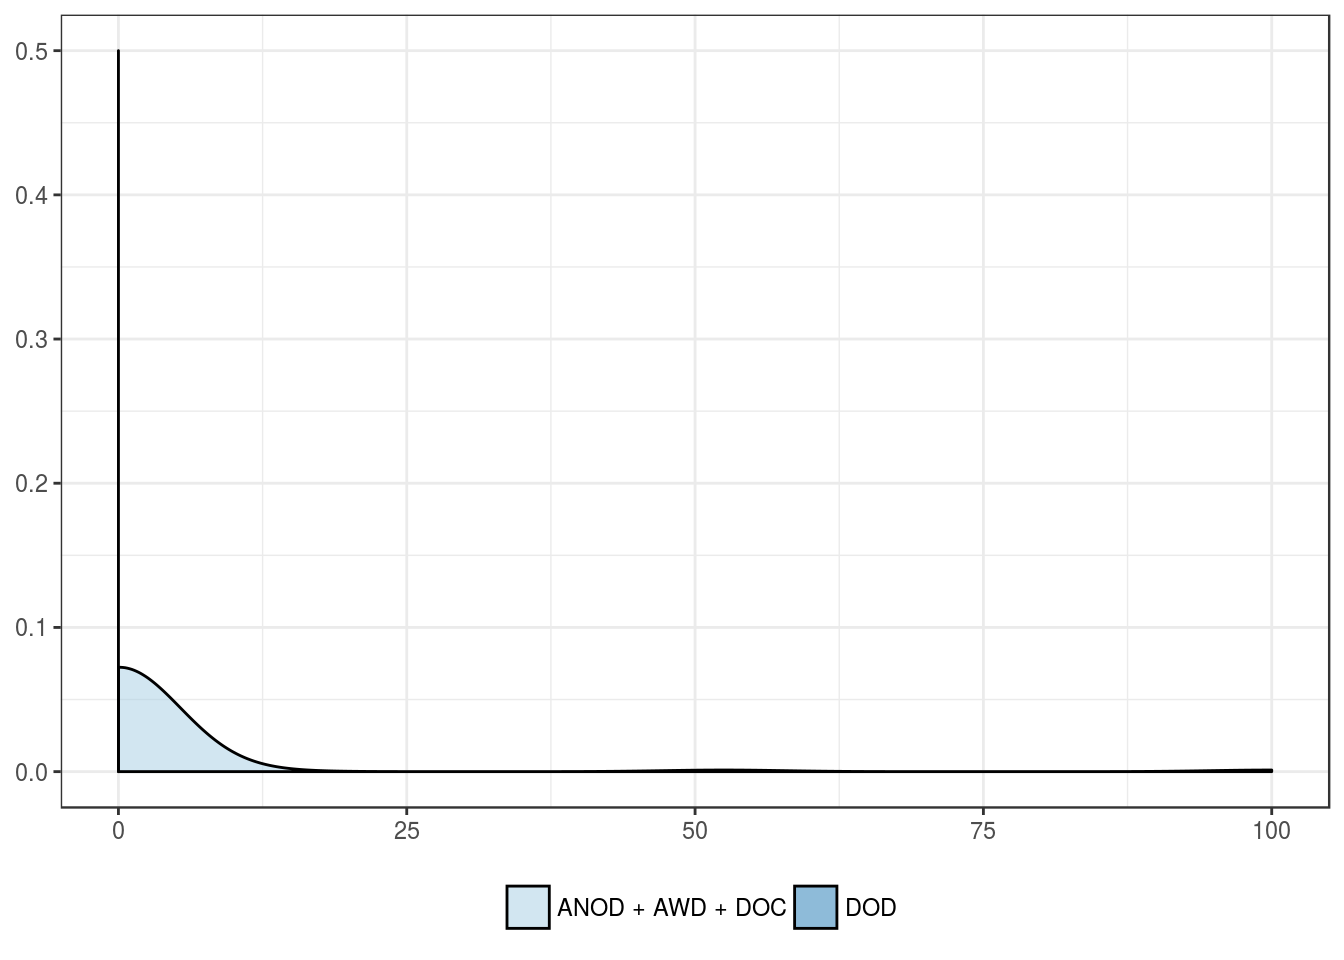
Cancer-related mortality
| ANOD + AWD + DOC | DOD | |
|---|---|---|
| Mean | 2.4 | 0 |
| Standard deviation | 13.6 | 0 |
| Median | 0.0 | 0 |
| Interquartile range | 0.0 | 0 |
| Minimum | 0.0 | 0 |
| Maximum | 100.0 | 0 |
| Value | |
|---|---|
| U-statistic | 76 |
| P statistic | 6.3e-01 |
PD-L1 H-score in tumor cells
Clinical features
Patients’ age group, in years
| Younger age | Older age | |
|---|---|---|
| Mean | 1.3 | 4.0 |
| Standard deviation | 8.1 | 18.9 |
| Median | 0.0 | 0.0 |
| Interquartile range | 0.0 | 0.0 |
| Minimum | 0.0 | 0.0 |
| Maximum | 52.5 | 100.0 |
| Value | |
|---|---|
| U-statistic | 526 |
| P statistic | 1.8e-01 |

Patients’ sex
| Female | Male | |
|---|---|---|
| Mean | 5.3 | 1.3 |
| Standard deviation | 22.9 | 7.5 |
| Median | 0.0 | 0.0 |
| Interquartile range | 0.0 | 0.0 |
| Minimum | 0.0 | 0.0 |
| Maximum | 100.0 | 52.5 |
| Value | |
|---|---|
| U-statistic | 515 |
| P statistic | 4.7e-01 |


Patients’ race
| Caucasian | African-American | Asian | Other | |
|---|---|---|---|---|
| Mean | 3.1 | 0 | 0 | 0 |
| Standard deviation | 15.3 | 0 | NA | 0 |
| Median | 0.0 | 0 | 0 | 0 |
| Interquartile range | 0.0 | 0 | 0 | 0 |
| Minimum | 0.0 | 0 | 0 | 0 |
| Maximum | 100.0 | 0 | 0 | 0 |
| Value | |
|---|---|
| Statistic | 2.626 |
| Parameter | 3 |
| P statistic | 0.45 |

History of other malignancies
| No other tumor | Prostate cancer | Other tumor | |
|---|---|---|---|
| Mean | 2.7 | 0.1 | 1.3 |
| Standard deviation | 14.8 | 0.2 | 3.5 |
| Median | 0.0 | 0.0 | 0.0 |
| Interquartile range | 0.0 | 0.0 | 0.1 |
| Minimum | 0.0 | 0.0 | 0.0 |
| Maximum | 100.0 | 0.5 | 10.0 |
| Value | |
|---|---|
| Statistic | 1.942 |
| Parameter | 2 |
| P statistic | 0.38 |
Pathologic features
Tumor size group
| Smaller size | Larger size | |
|---|---|---|
| Mean | 0.0 | 5.0 |
| Standard deviation | 0.2 | 19.4 |
| Median | 0.0 | 0.0 |
| Interquartile range | 0.0 | 0.0 |
| Minimum | 0.0 | 0.0 |
| Maximum | 1.0 | 100.0 |
| Value | |
|---|---|
| U-statistic | 517 |
| P statistic | 9.8e-02 |
Multifocality
| Single tumor | Multifocal tumor | |
|---|---|---|
| Mean | 2.8 | 0 |
| Standard deviation | 14.5 | 0 |
| Median | 0.0 | 0 |
| Interquartile range | 0.0 | 0 |
| Minimum | 0.0 | 0 |
| Maximum | 100.0 | 0 |
| Value | |
|---|---|
| U-statistic | 306 |
| P statistic | 2.6e-01 |

Fuhrman grade
| G1 | G2 | G3 | G4 | |
|---|---|---|---|---|
| Mean | 0 | 0.1 | 7.1 | 0 |
| Standard deviation | 0 | 0.2 | 23.1 | 0 |
| Median | 0 | 0.0 | 0.0 | 0 |
| Interquartile range | 0 | 0.0 | 0.0 | 0 |
| Minimum | 0 | 0.0 | 0.0 | 0 |
| Maximum | 0 | 1.0 | 100.0 | 0 |
| Value | |
|---|---|
| Statistic | 1.658 |
| Parameter | 3 |
| P statistic | 0.65 |
pT stage
| pT1 | pT2 | pT3 | |
|---|---|---|---|
| Mean | 1.1 | 0 | 6.5 |
| Standard deviation | 7.4 | 0 | 24.2 |
| Median | 0.0 | 0 | 0.0 |
| Interquartile range | 0.0 | 0 | 0.0 |
| Minimum | 0.0 | 0 | 0.0 |
| Maximum | 52.5 | 0 | 100.0 |
| Value | |
|---|---|
| Statistic | 1.085 |
| Parameter | 2 |
| P statistic | 0.58 |

Surgical margin
| Negative margin | Positive margin | |
|---|---|---|
| Mean | 2.6 | 0 |
| Standard deviation | 13.9 | 0 |
| Median | 0.0 | 0 |
| Interquartile range | 0.0 | 0 |
| Minimum | 0.0 | 0 |
| Maximum | 100.0 | 0 |
| Value | |
|---|---|
| U-statistic | 146 |
| P statistic | 4.7e-01 |


Outcome features
Tumor progression
| No tumor progression | Tumor progression | |
|---|---|---|
| Mean | 2.7 | 0 |
| Standard deviation | 14.4 | 0 |
| Median | 0.0 | 0 |
| Interquartile range | 0.0 | 0 |
| Minimum | 0.0 | 0 |
| Maximum | 100.0 | 0 |
| Value | |
|---|---|
| U-statistic | 276 |
| P statistic | 2.9e-01 |

Overall mortality
| ANOD + AWD | DOC + DOD | |
|---|---|---|
| Mean | 2.9 | 0 |
| Standard deviation | 14.7 | 0 |
| Median | 0.0 | 0 |
| Interquartile range | 0.0 | 0 |
| Minimum | 0.0 | 0 |
| Maximum | 100.0 | 0 |
| Value | |
|---|---|
| U-statistic | 396 |
| P statistic | 1.8e-01 |

Cancer-related mortality
| ANOD + AWD + DOC | DOD | |
|---|---|---|
| Mean | 2.4 | 0 |
| Standard deviation | 13.6 | 0 |
| Median | 0.0 | 0 |
| Interquartile range | 0.0 | 0 |
| Minimum | 0.0 | 0 |
| Maximum | 100.0 | 0 |
| Value | |
|---|---|
| U-statistic | 76 |
| P statistic | 6.3e-01 |


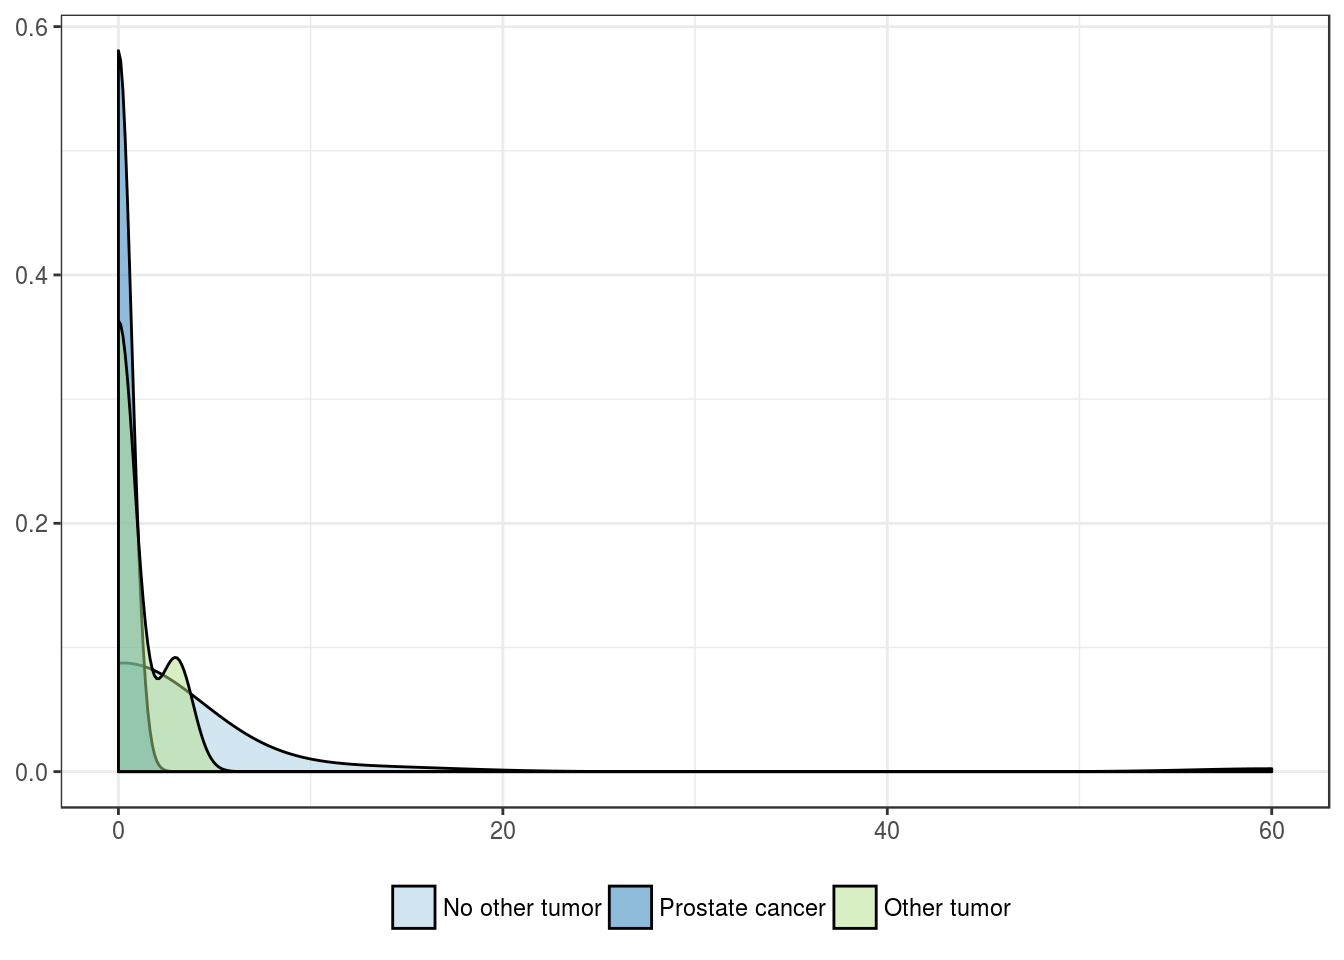
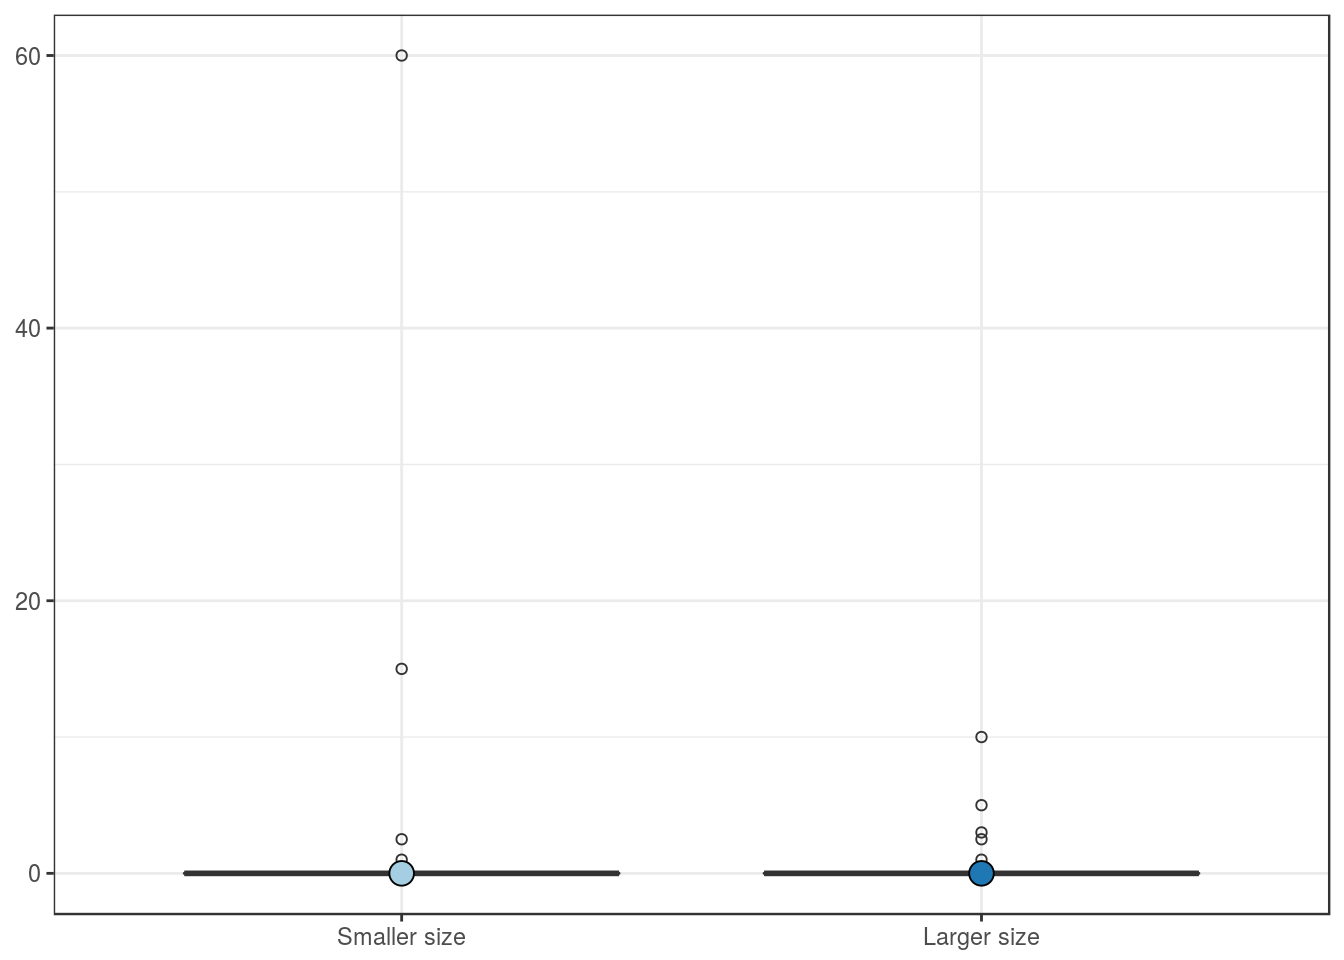
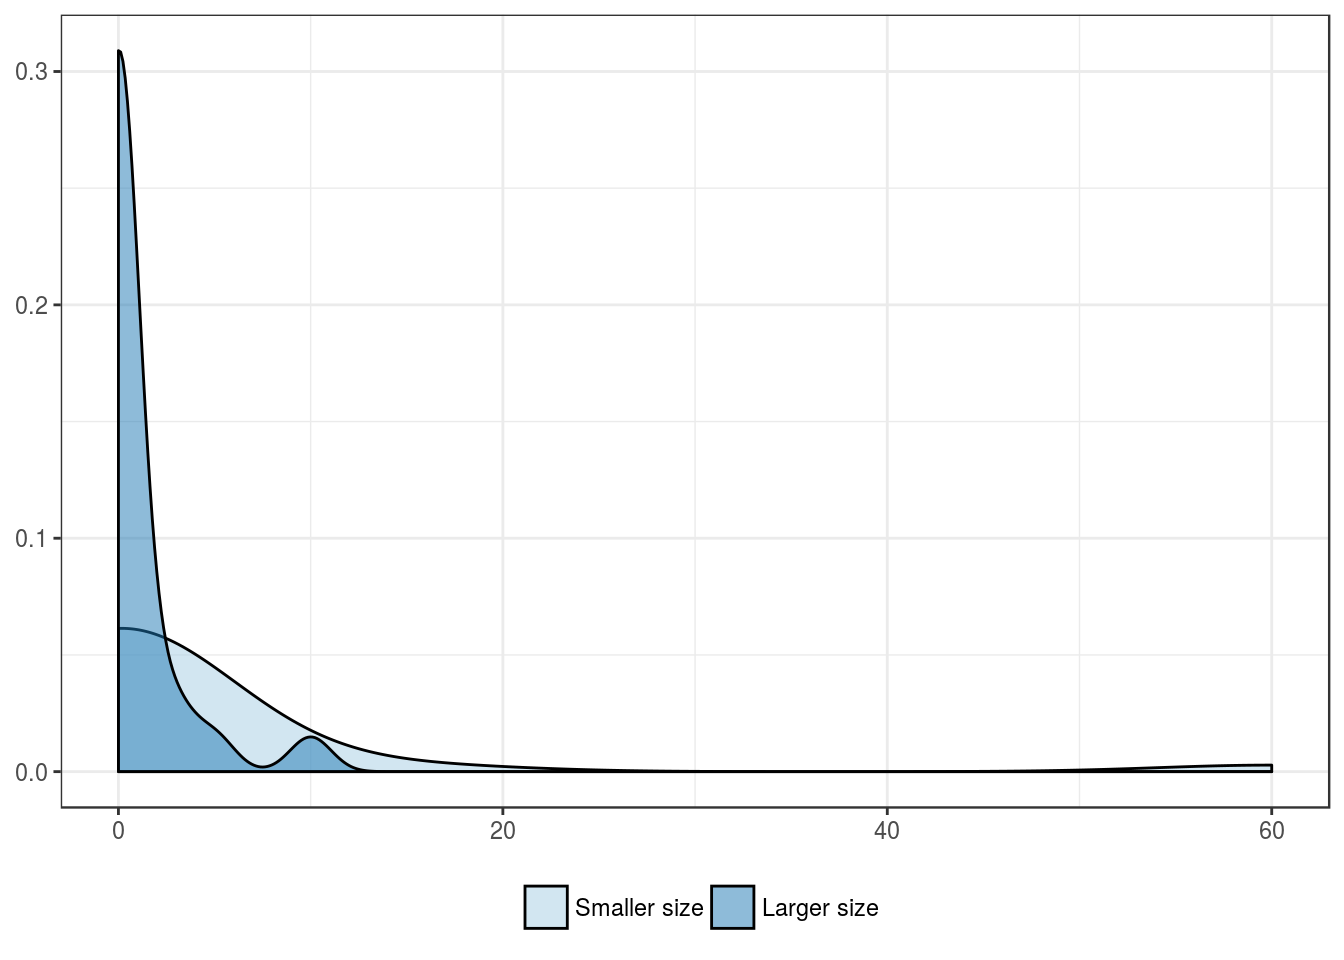
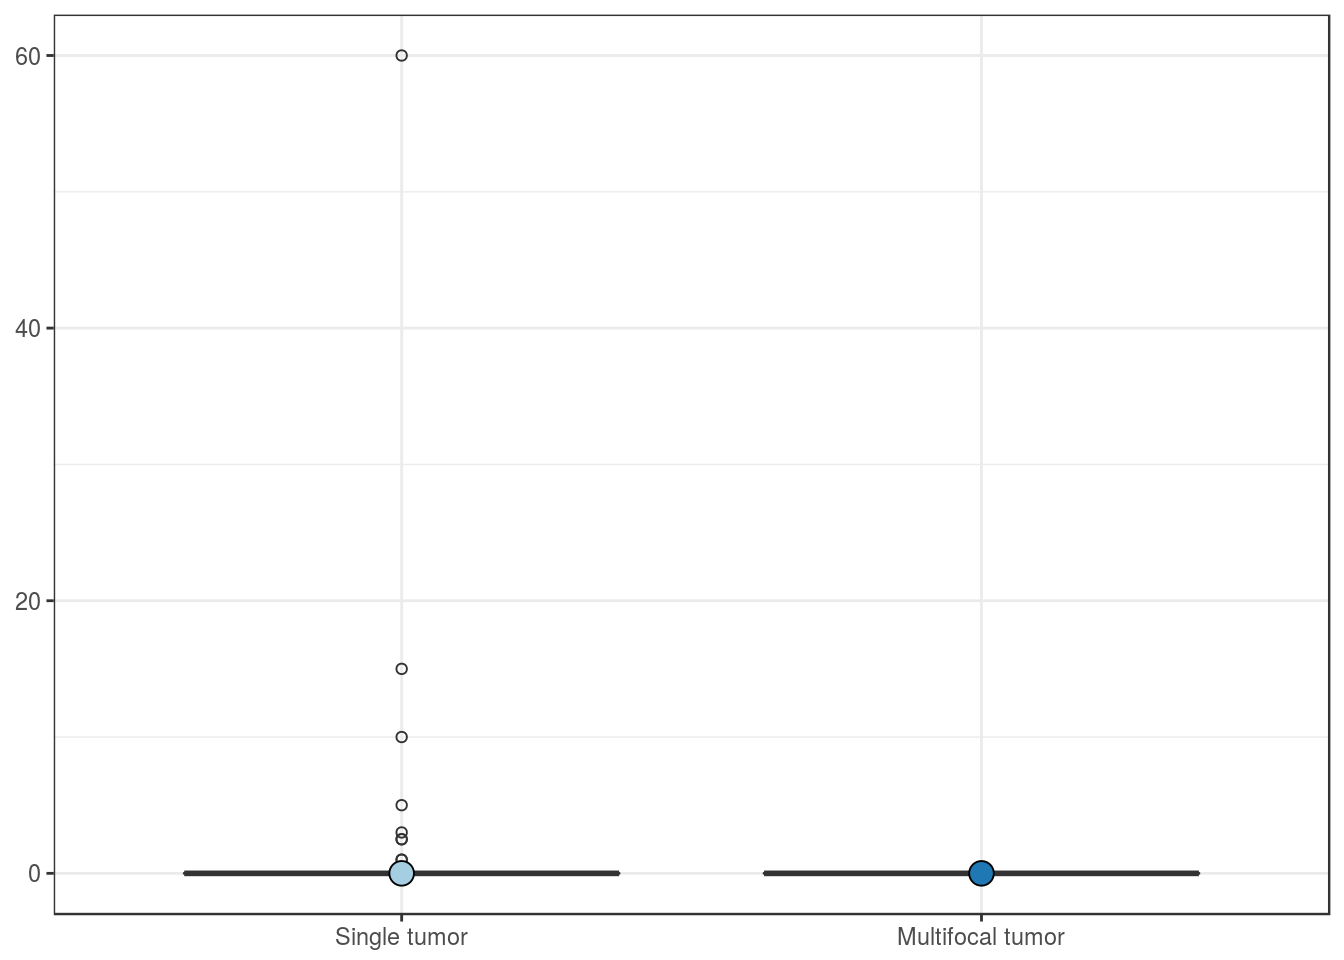
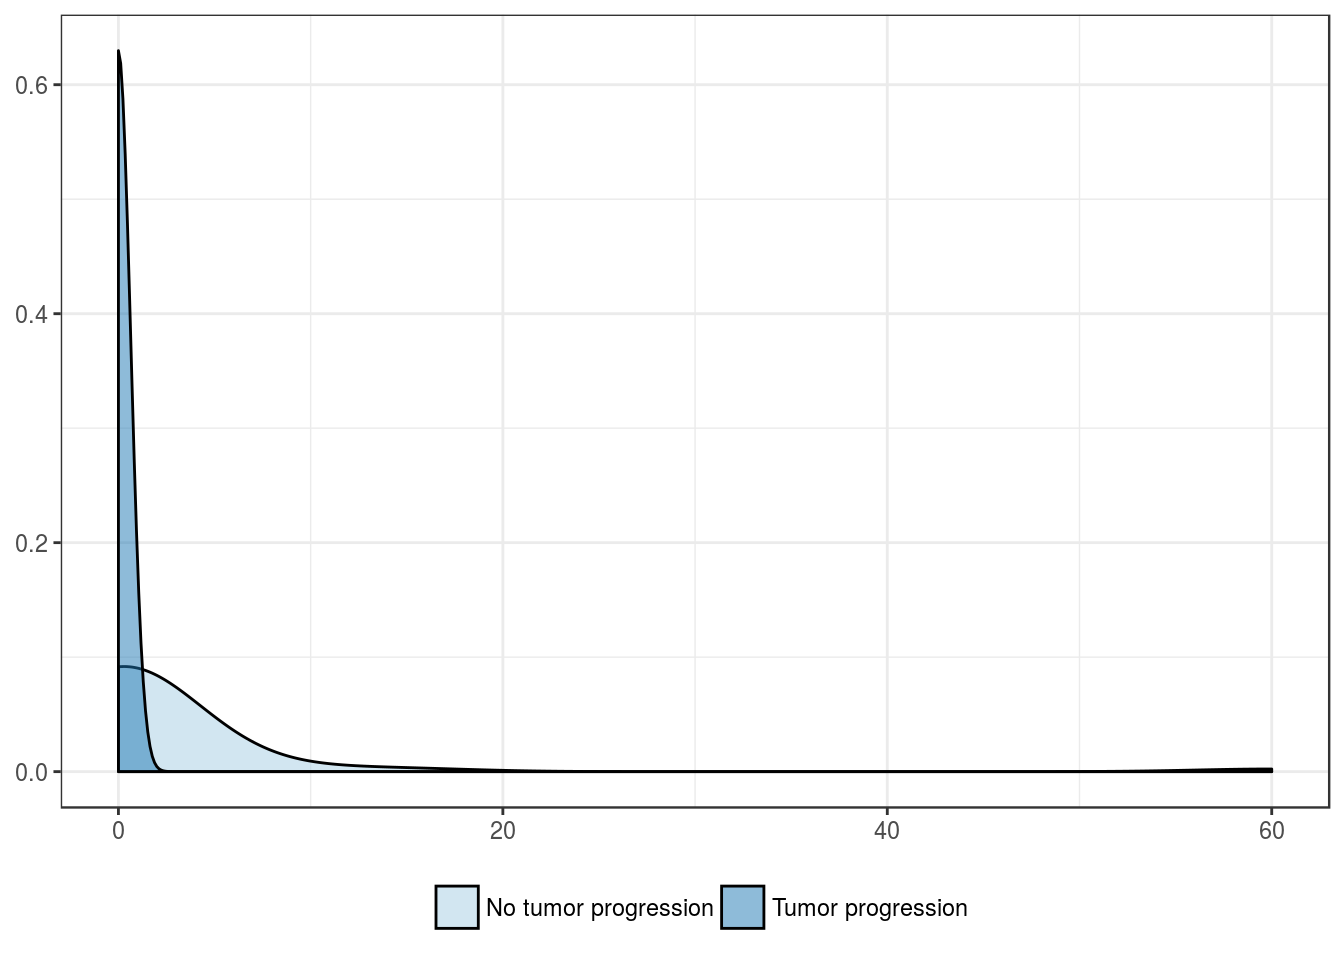
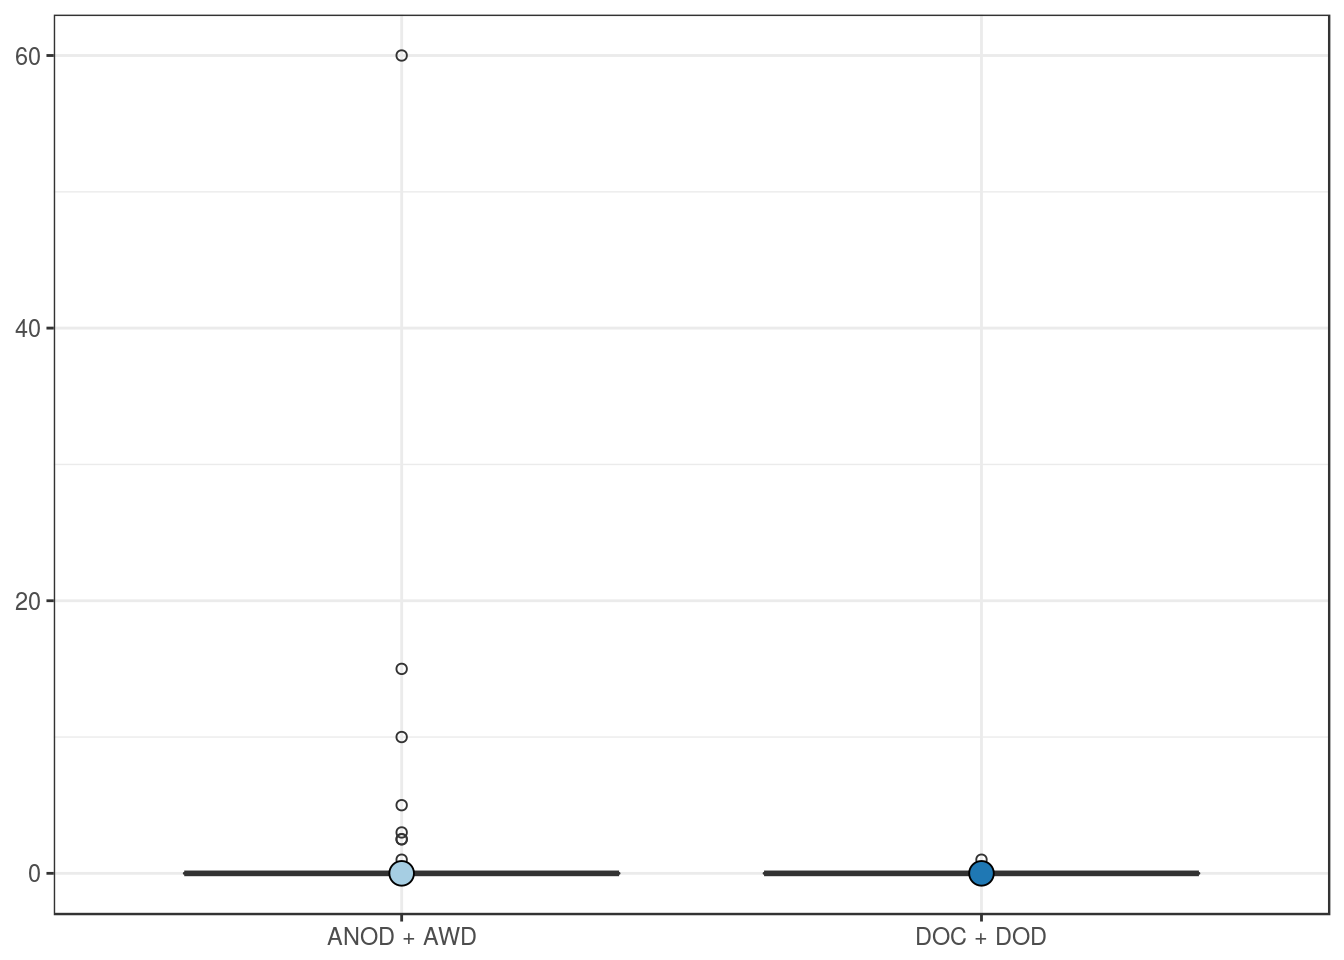
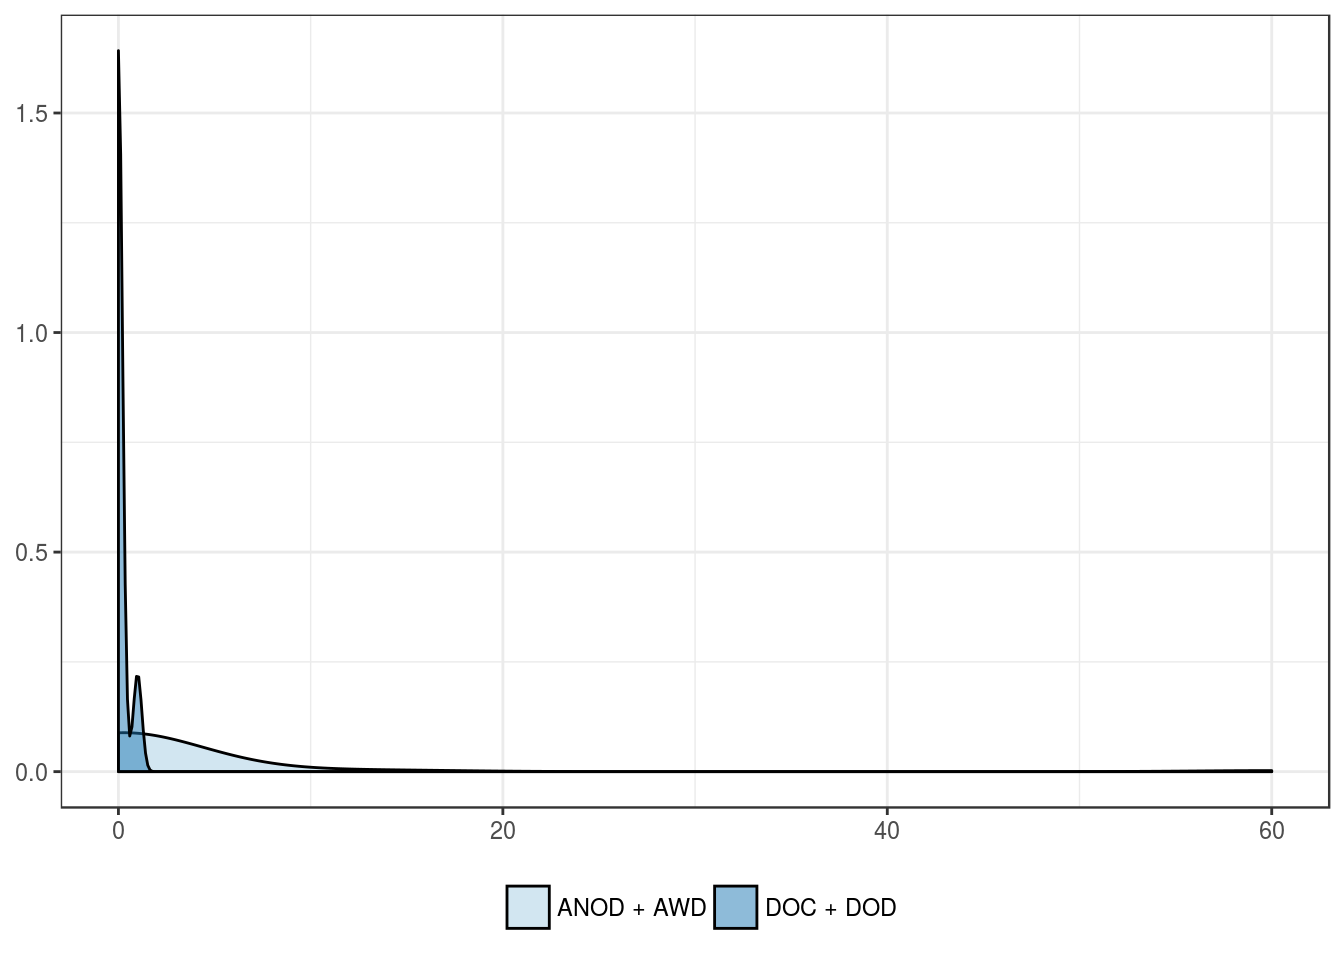
PD-L1 positivity in stromal cells
Clinical features
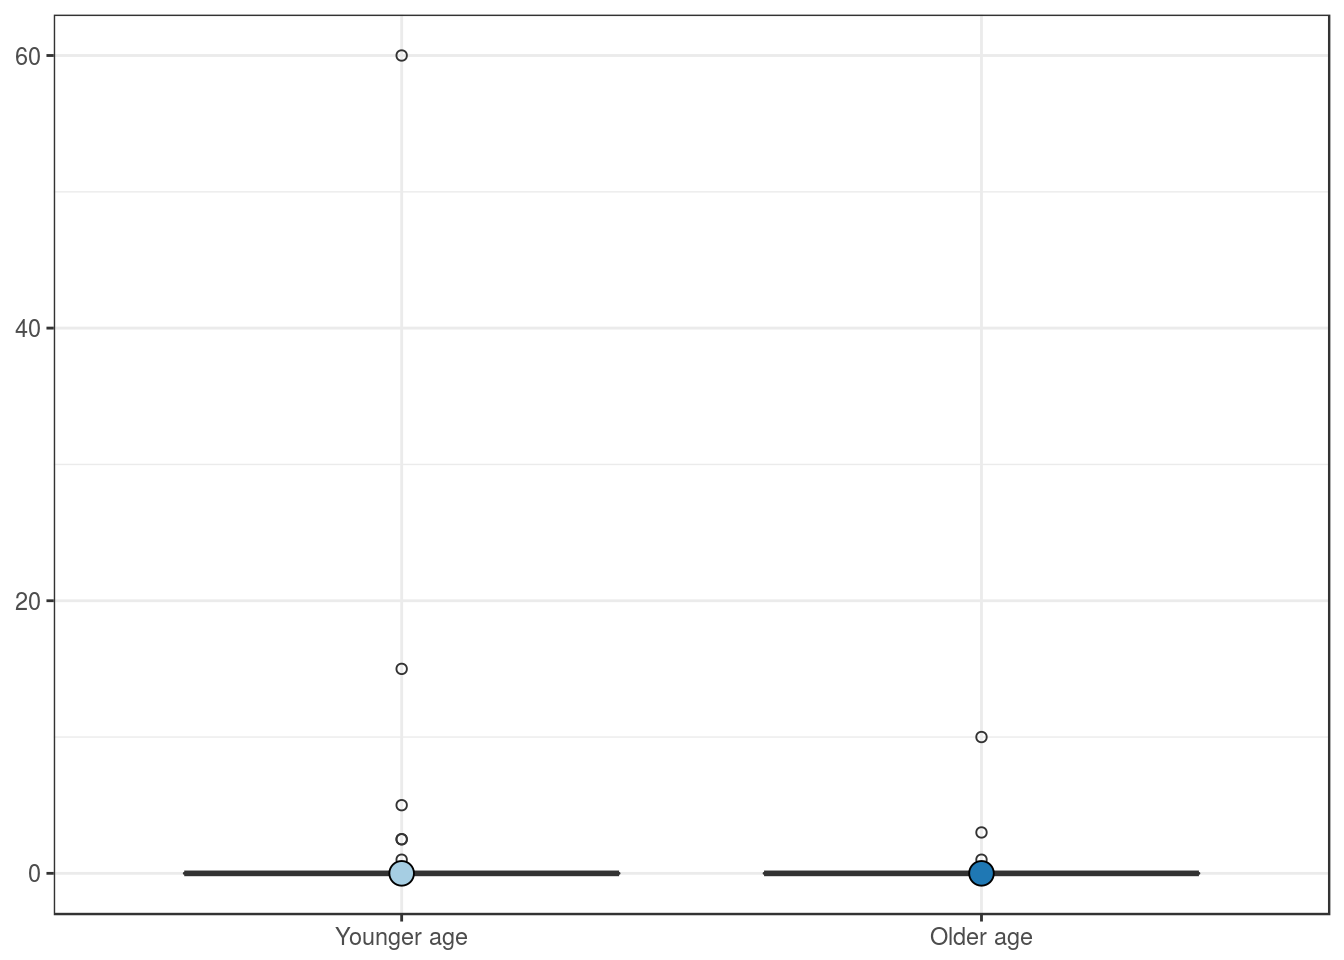
Patients’ age group, in years
| Younger age | Older age | |
|---|---|---|
| Mean | 2.8 | 0.7 |
| Standard deviation | 11.0 | 2.4 |
| Median | 0.0 | 0.0 |
| Interquartile range | 0.0 | 0.0 |
| Minimum | 0.0 | 0.0 |
| Maximum | 60.0 | 10.0 |
| Value | |
|---|---|
| U-statistic | 306 |
| P statistic | 7.3e-01 |

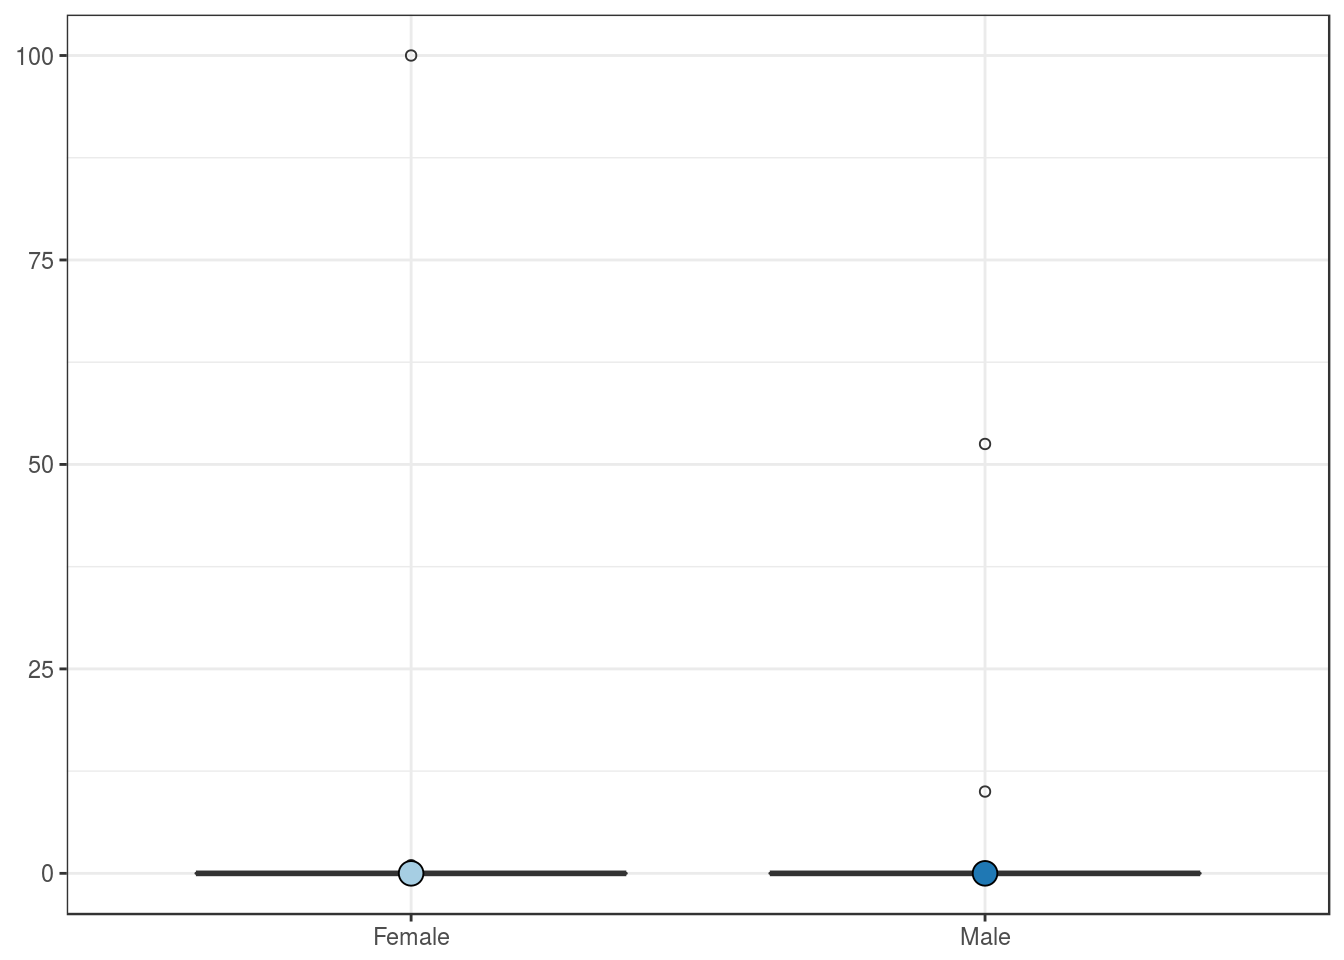
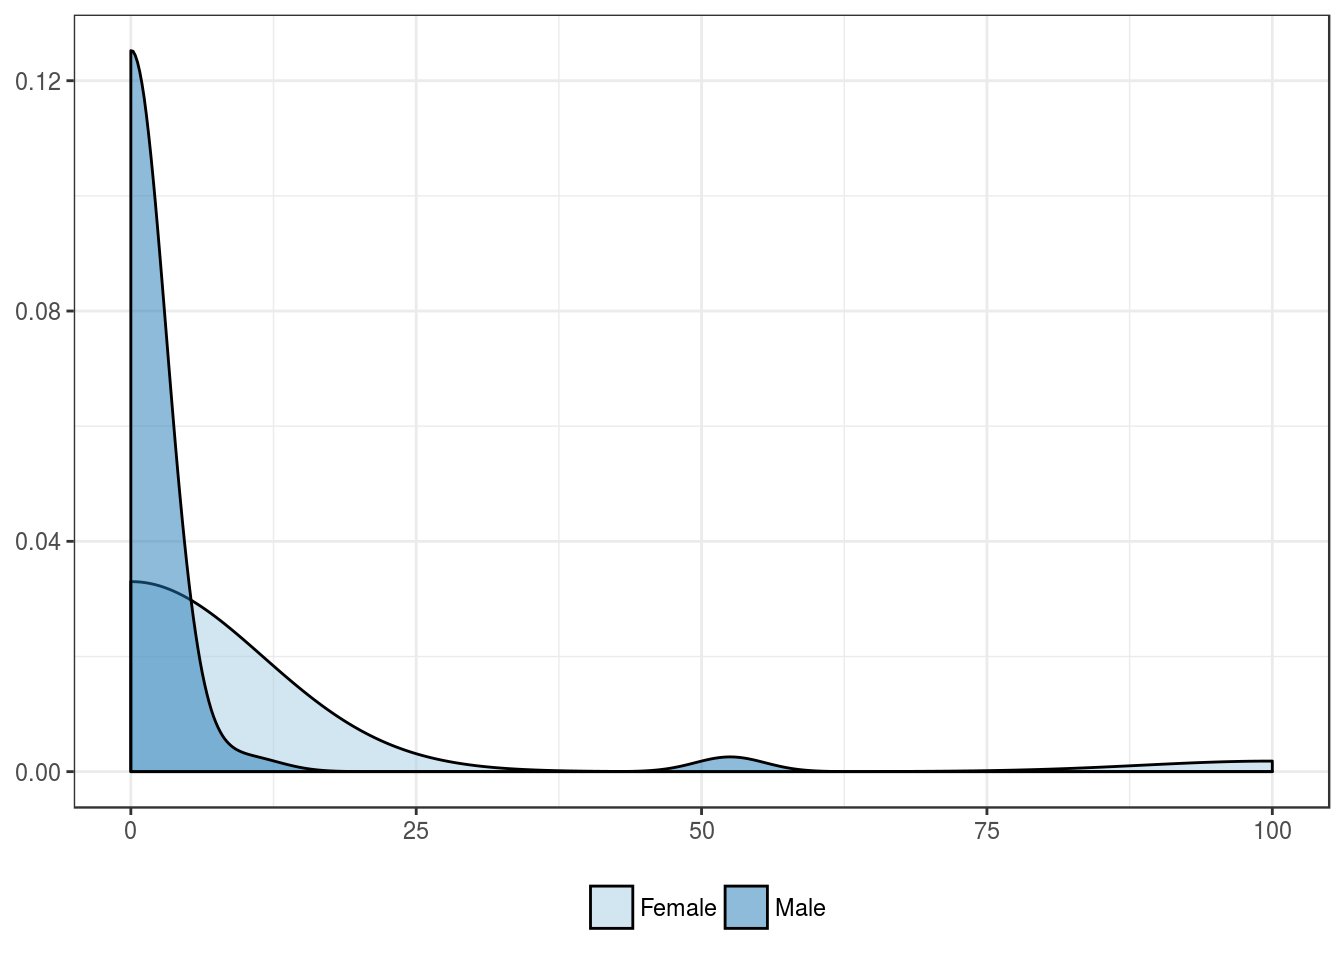
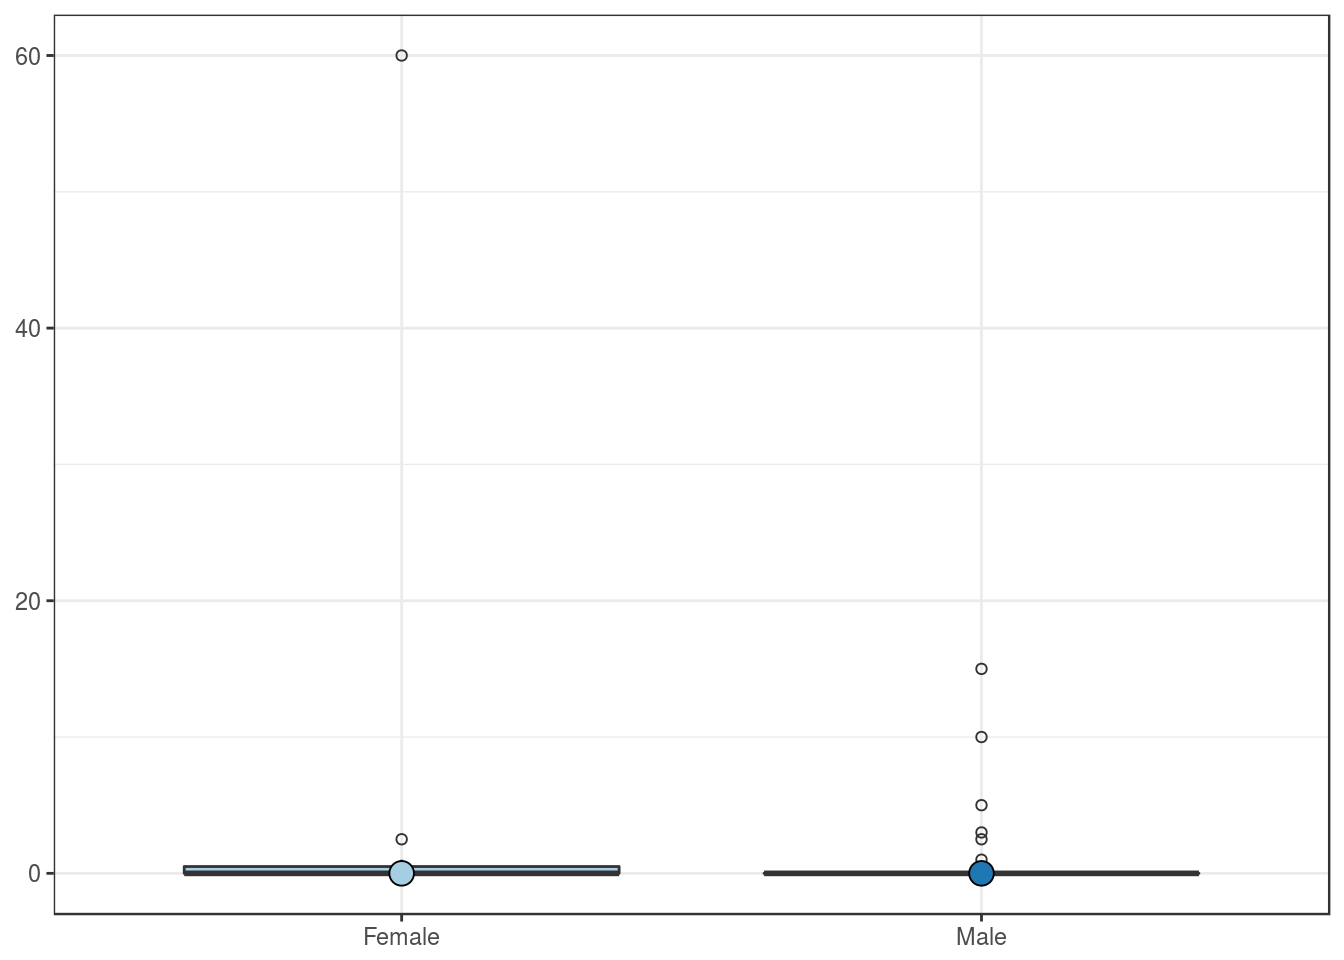
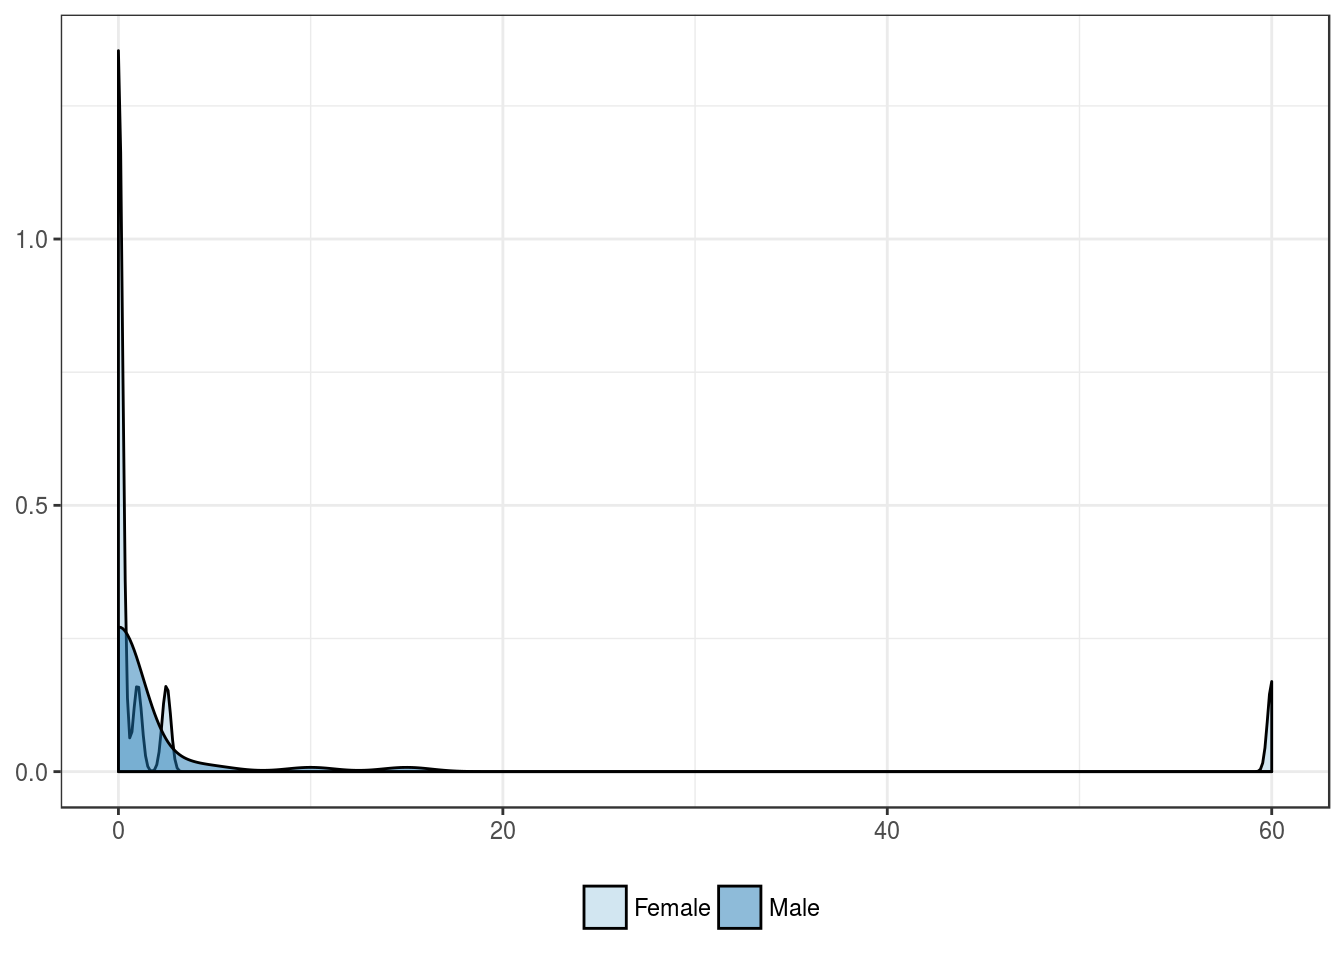
Patients’ sex
| Female | Male | |
|---|---|---|
| Mean | 5.8 | 0.9 |
| Standard deviation | 18.0 | 3.0 |
| Median | 0.0 | 0.0 |
| Interquartile range | 0.5 | 0.0 |
| Minimum | 0.0 | 0.0 |
| Maximum | 60.0 | 15.0 |
| Value | |
|---|---|
| U-statistic | 239 |
| P statistic | 4e-01 |
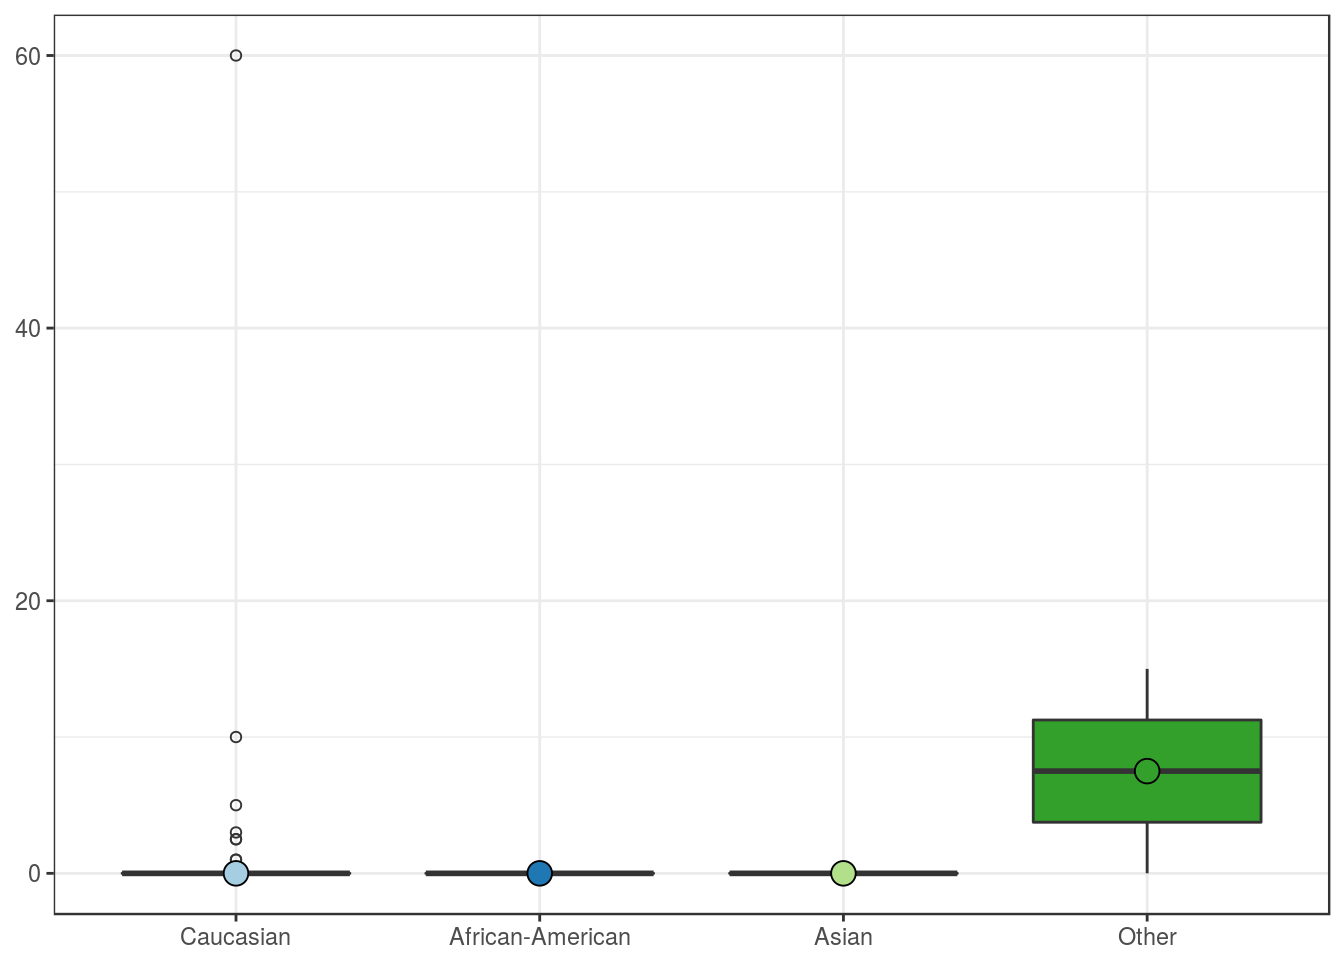
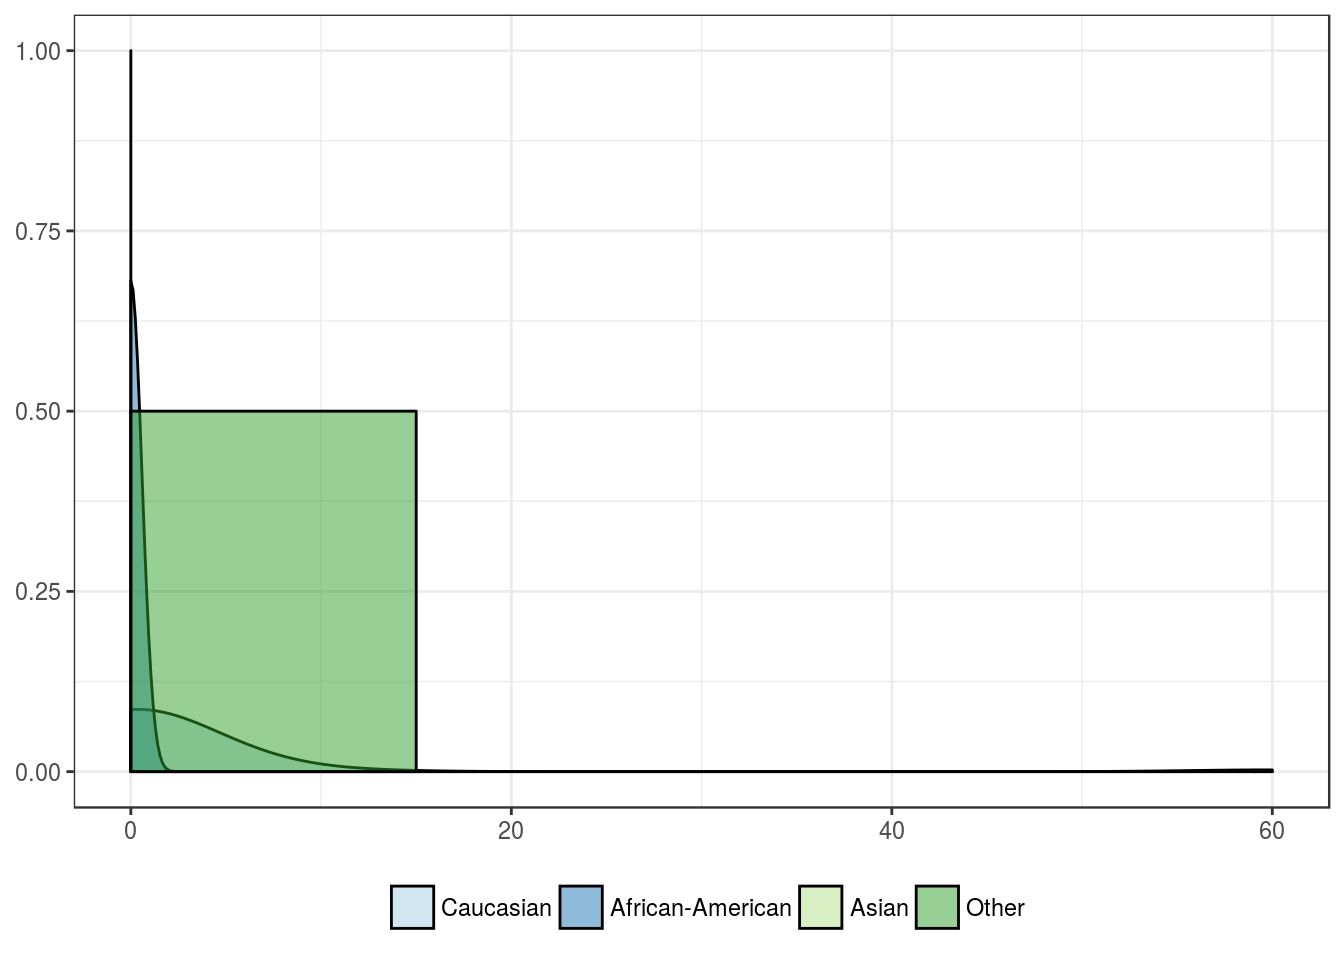
Patients’ race
| Caucasian | African-American | Asian | Other | |
|---|---|---|---|---|
| Mean | 2.2 | 0 | 0 | 7.5 |
| Standard deviation | 9.8 | 0 | NA | 10.6 |
| Median | 0.0 | 0 | 0 | 7.5 |
| Interquartile range | 0.0 | 0 | 0 | 7.5 |
| Minimum | 0.0 | 0 | 0 | 0.0 |
| Maximum | 60.0 | 0 | 0 | 15.0 |
| Value | |
|---|---|
| Statistic | 4.204 |
| Parameter | 3 |
| P statistic | 0.24 |
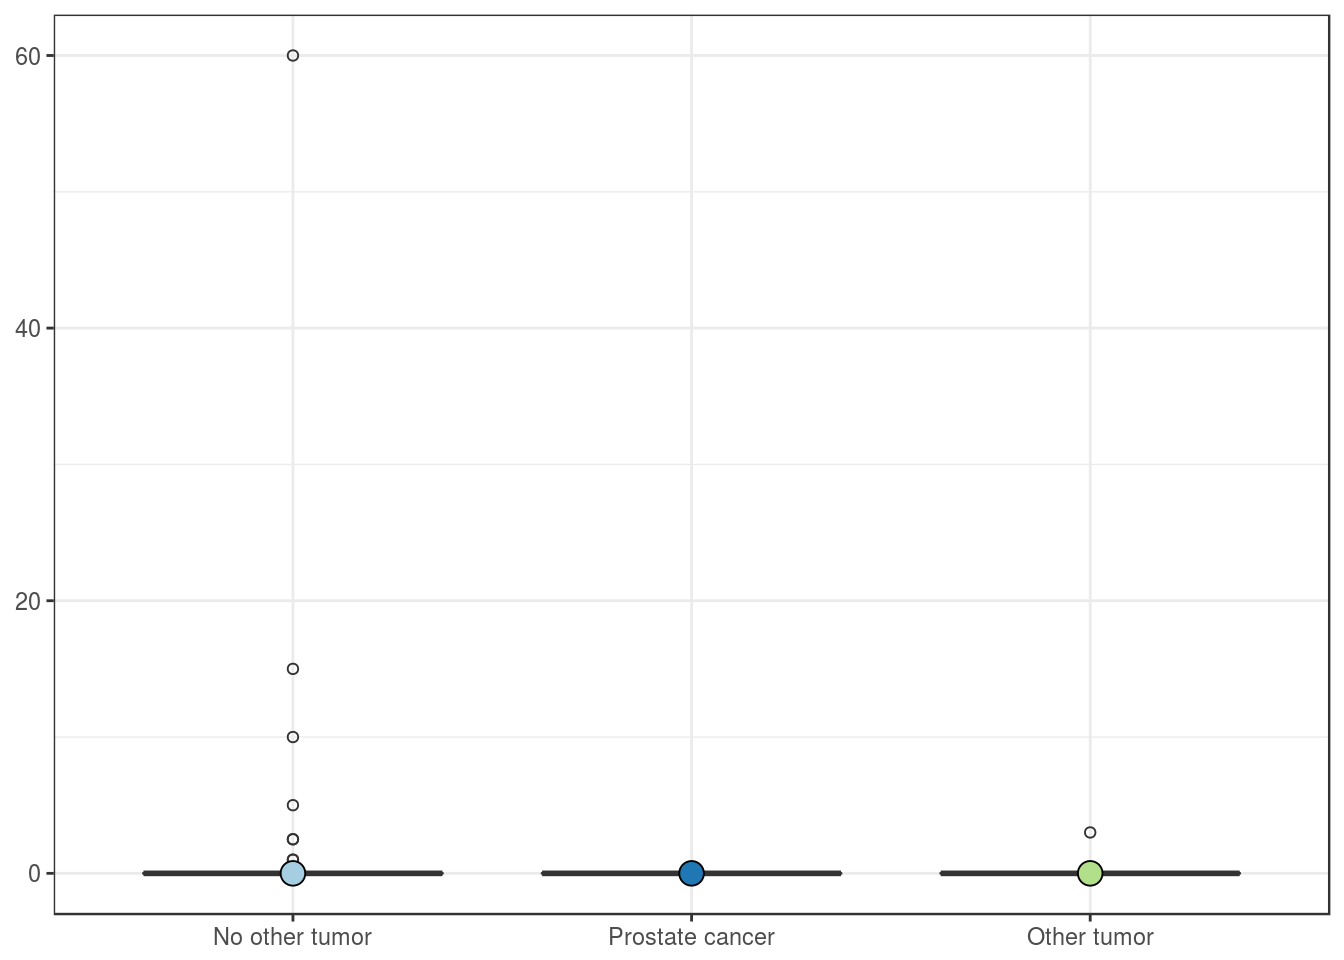
History of other malignancies
| No other tumor | Prostate cancer | Other tumor | |
|---|---|---|---|
| Mean | 2.4 | 0 | 0.6 |
| Standard deviation | 9.7 | 0 | 1.3 |
| Median | 0.0 | 0 | 0.0 |
| Interquartile range | 0.0 | 0 | 0.0 |
| Minimum | 0.0 | 0 | 0.0 |
| Maximum | 60.0 | 0 | 3.0 |
| Value | |
|---|---|
| Statistic | 0.9242 |
| Parameter | 2 |
| P statistic | 0.63 |
Pathologic features
Tumor size group
| Smaller size | Larger size | |
|---|---|---|
| Mean | 3.3 | 0.9 |
| Standard deviation | 12.5 | 2.3 |
| Median | 0.0 | 0.0 |
| Interquartile range | 0.0 | 0.0 |
| Minimum | 0.0 | 0.0 |
| Maximum | 60.0 | 10.0 |
| Value | |
|---|---|
| U-statistic | 292 |
| P statistic | 8.2e-01 |
Multifocality
| Single tumor | Multifocal tumor | |
|---|---|---|
| Mean | 2.3 | 0 |
| Standard deviation | 9.3 | 0 |
| Median | 0.0 | 0 |
| Interquartile range | 0.0 | 0 |
| Minimum | 0.0 | 0 |
| Maximum | 60.0 | 0 |
| Value | |
|---|---|
| U-statistic | 132 |
| P statistic | 2.8e-01 |
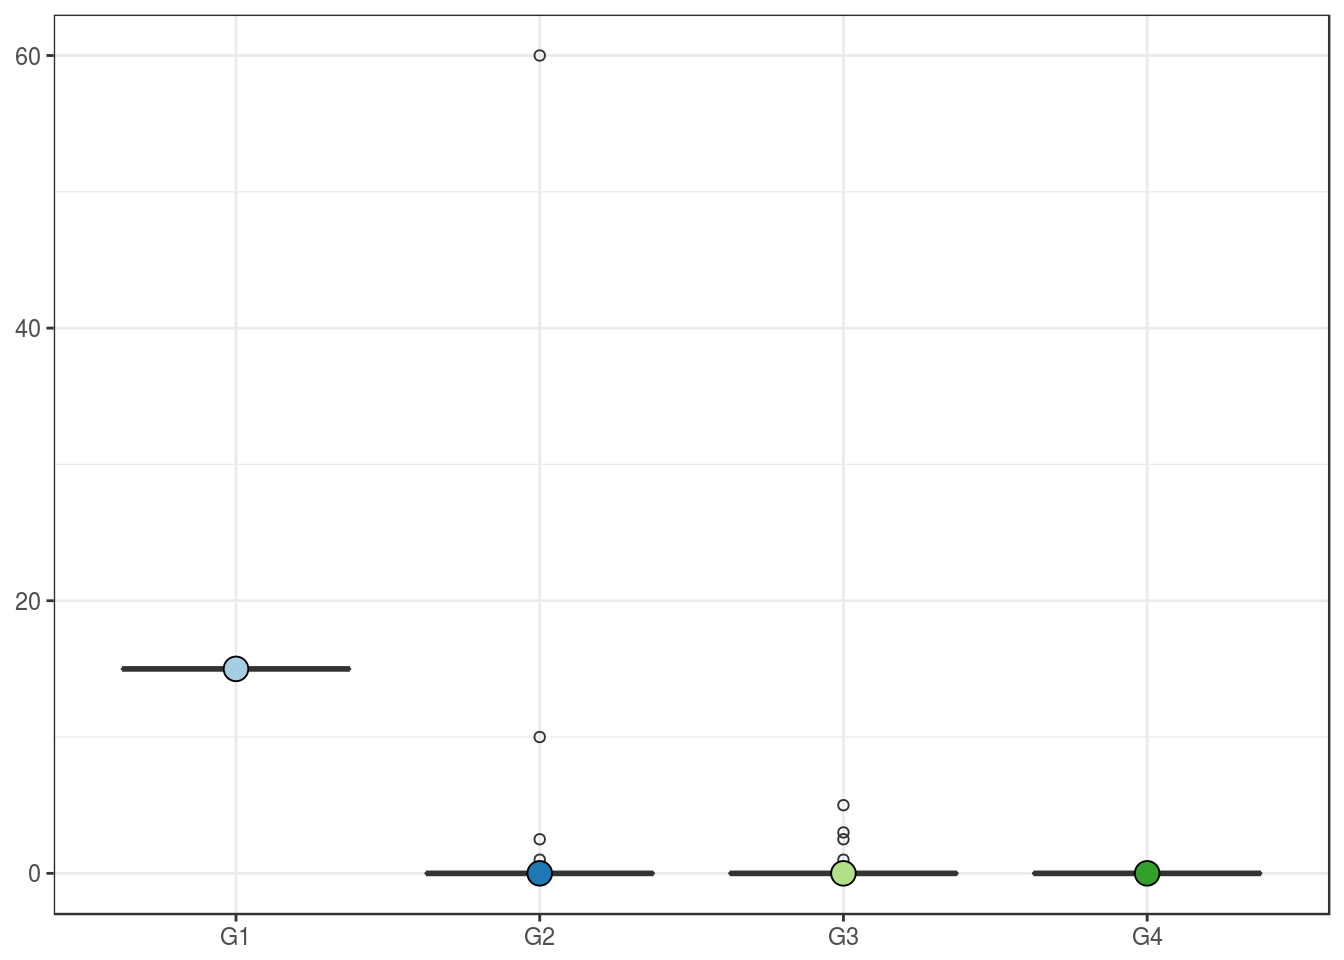
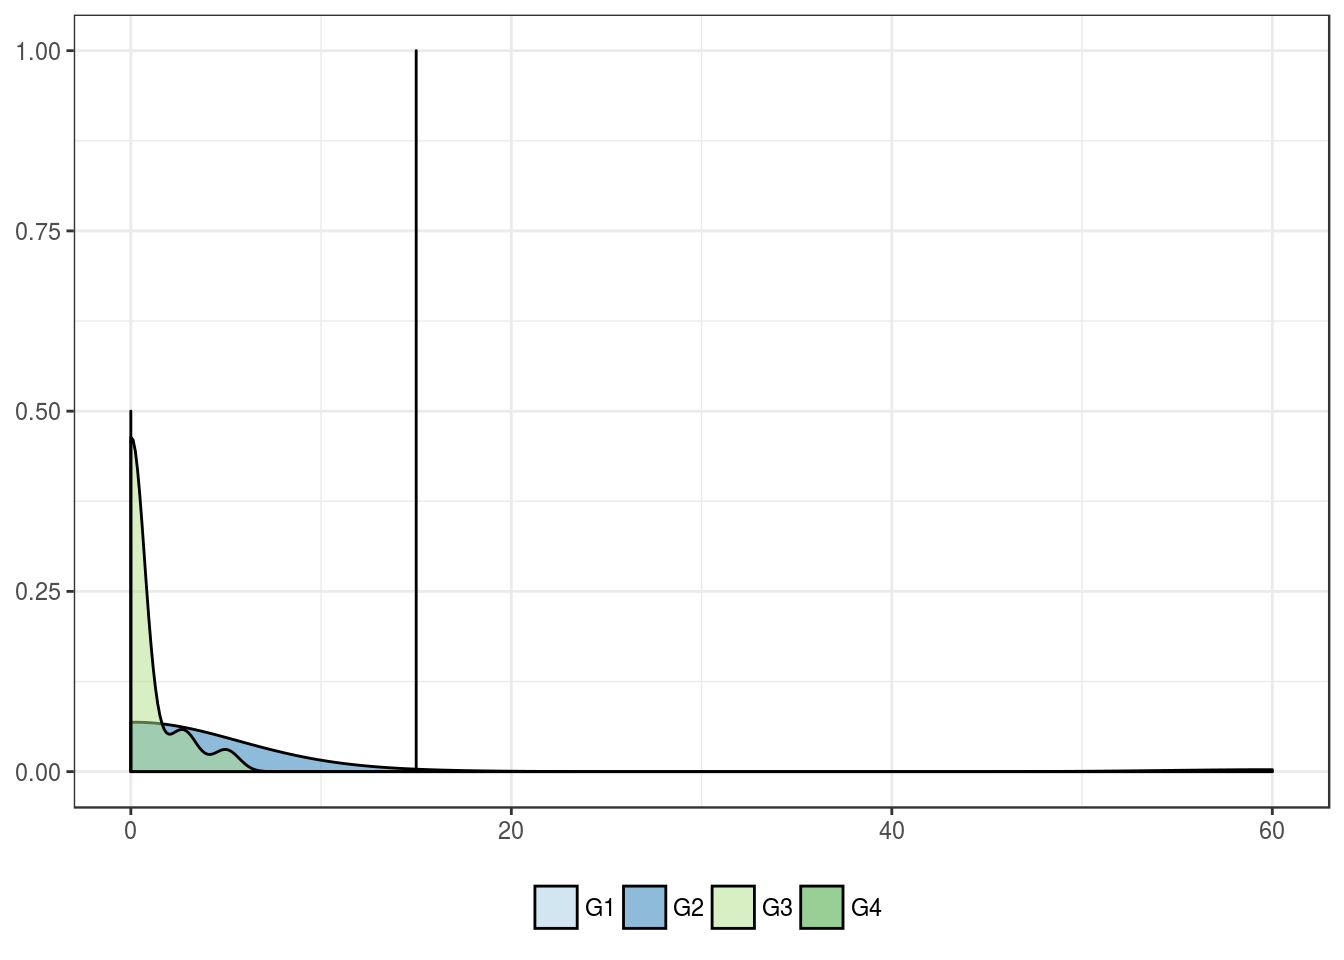
Fuhrman grade
| G1 | G2 | G3 | G4 | |
|---|---|---|---|---|
| Mean | 15 | 2.7 | 0.6 | 0 |
| Standard deviation | NA | 11.6 | 1.4 | 0 |
| Median | 15 | 0.0 | 0.0 | 0 |
| Interquartile range | 0 | 0.0 | 0.0 | 0 |
| Minimum | 15 | 0.0 | 0.0 | 0 |
| Maximum | 15 | 60.0 | 5.0 | 0 |
| Value | |
|---|---|
| Statistic | 6.359 |
| Parameter | 3 |
| P statistic | 0.095 |
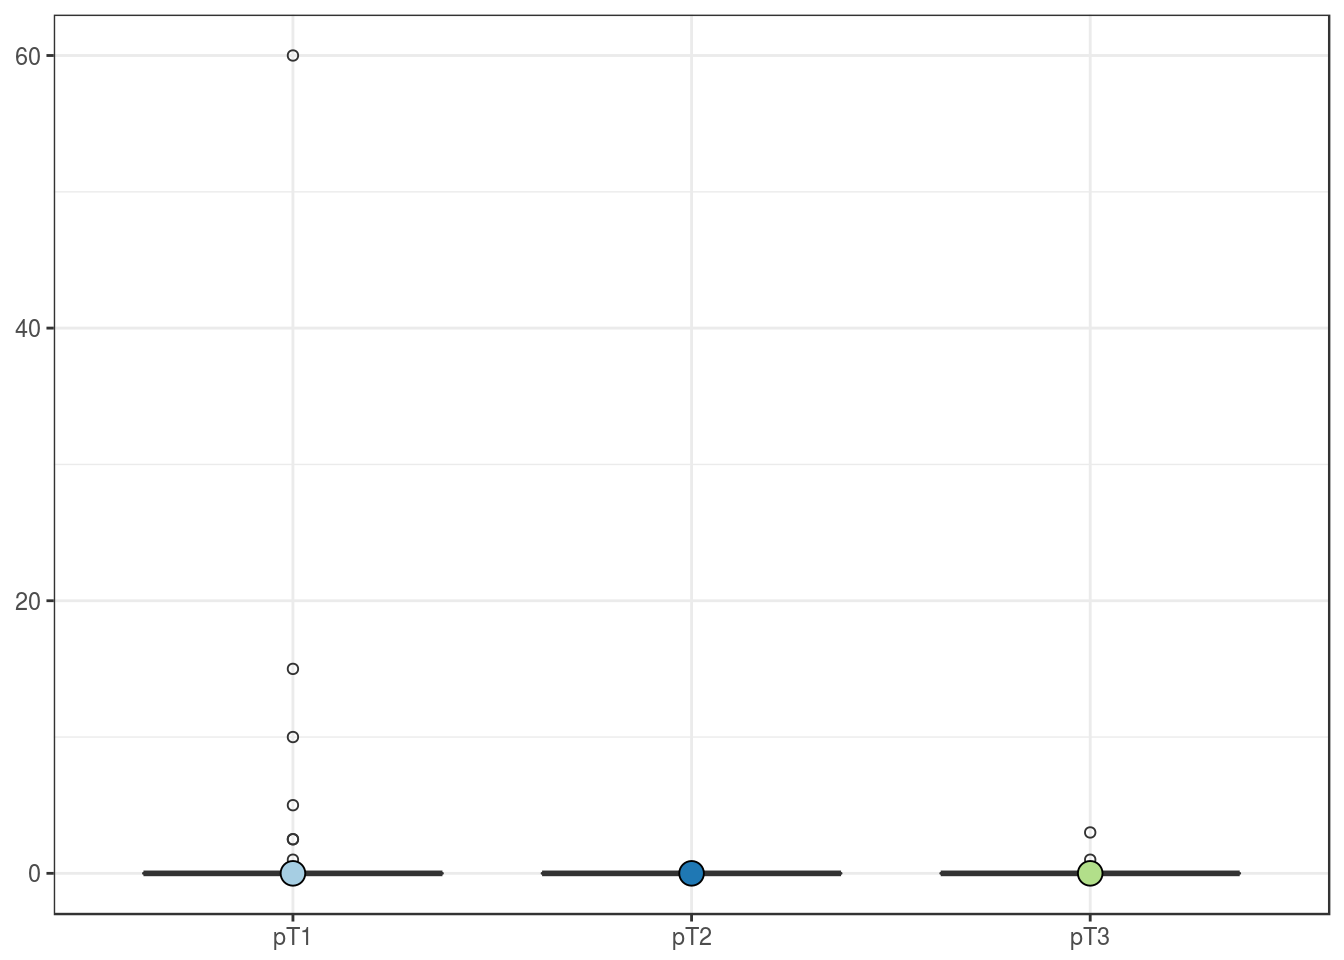
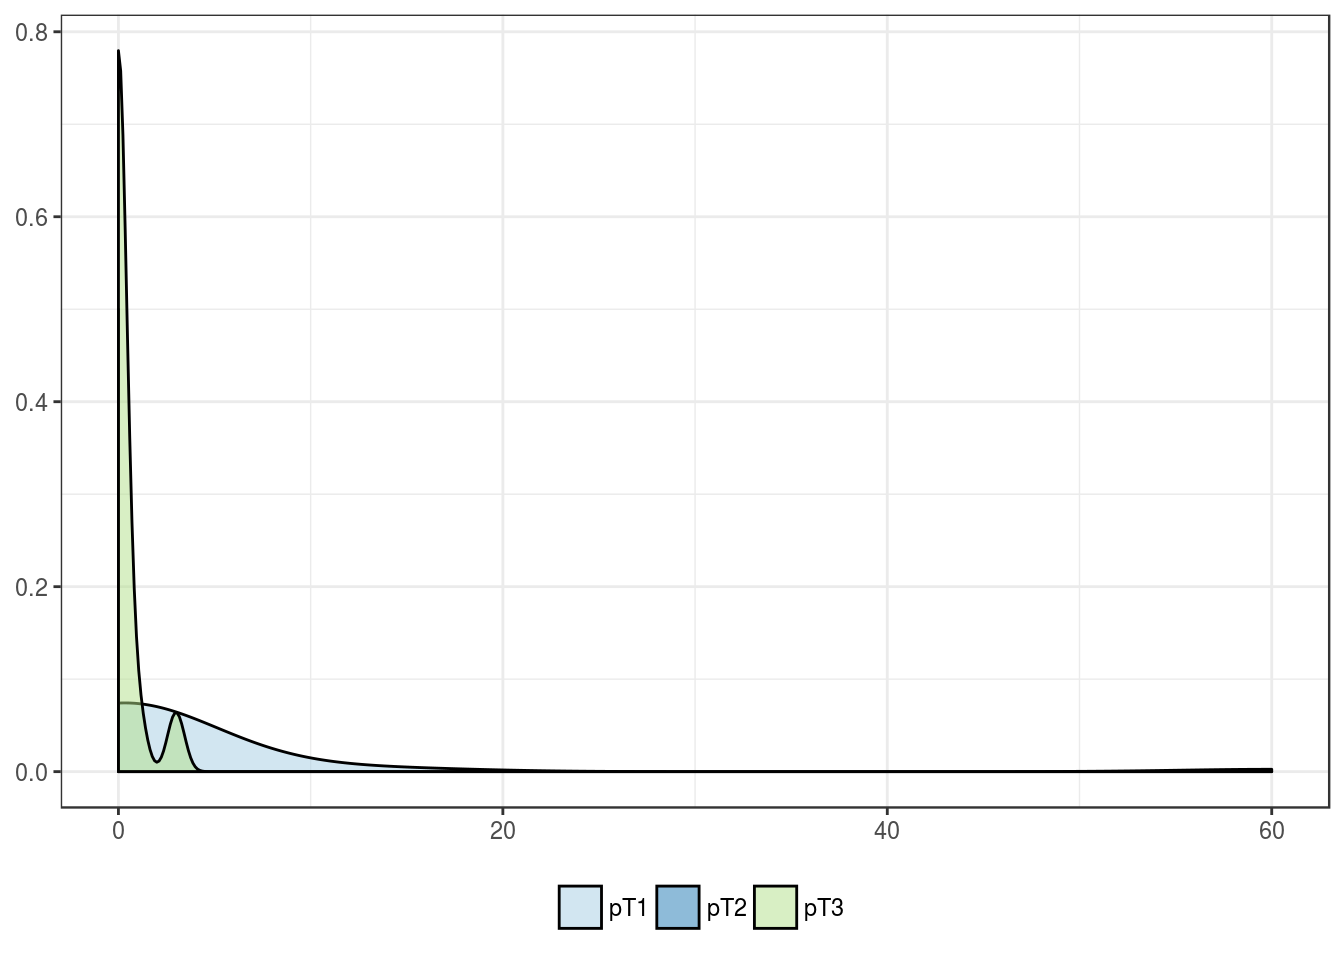
pT stage
| pT1 | pT2 | pT3 | |
|---|---|---|---|
| Mean | 2.9 | 0 | 0.3 |
| Standard deviation | 10.7 | 0 | 0.8 |
| Median | 0.0 | 0 | 0.0 |
| Interquartile range | 0.0 | 0 | 0.0 |
| Minimum | 0.0 | 0 | 0.0 |
| Maximum | 60.0 | 0 | 3.0 |
| Value | |
|---|---|
| Statistic | 0.8985 |
| Parameter | 2 |
| P statistic | 0.64 |
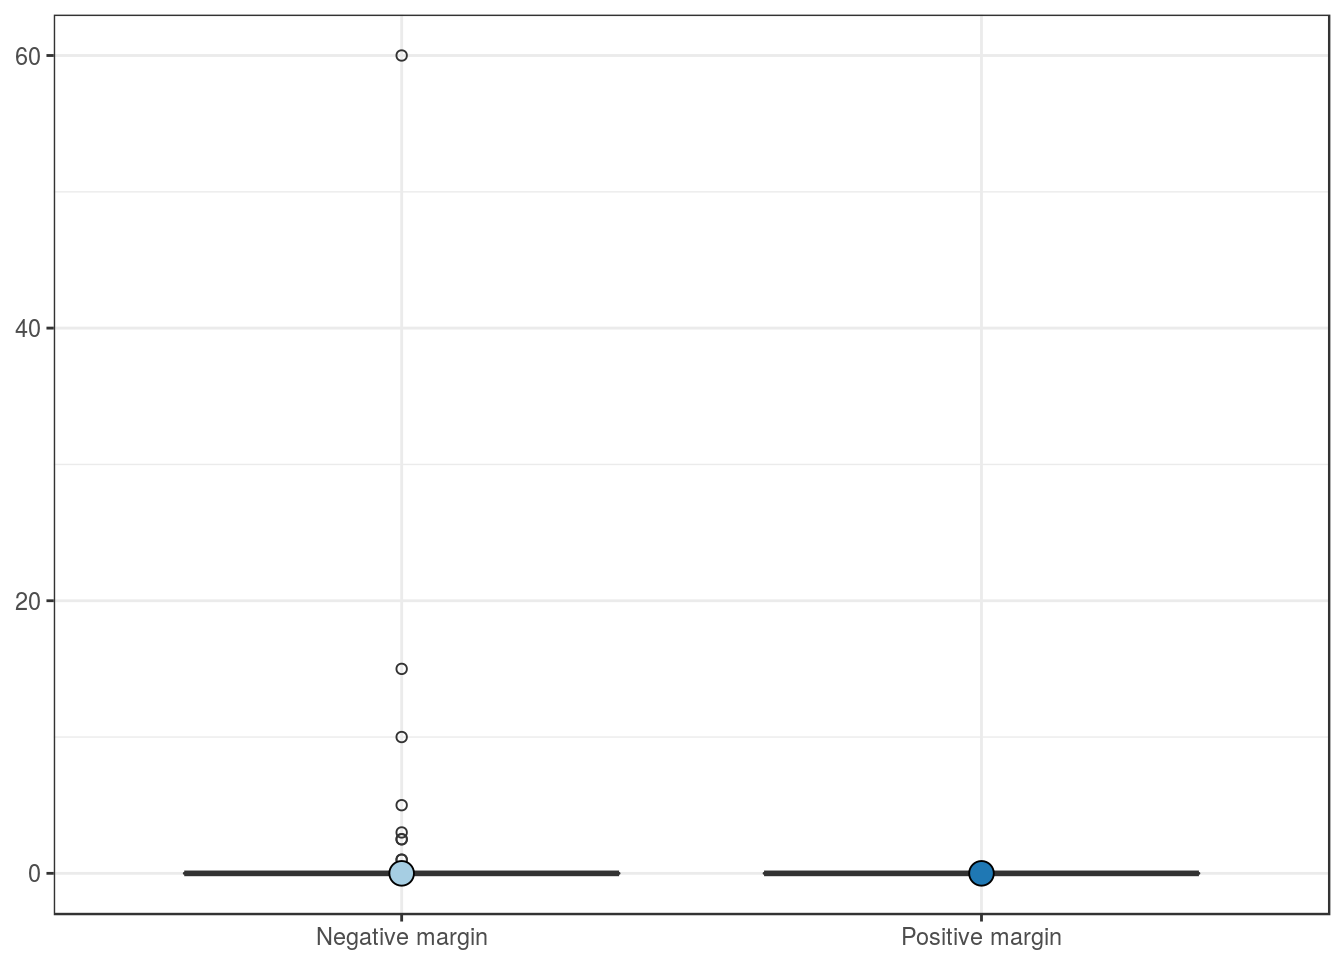
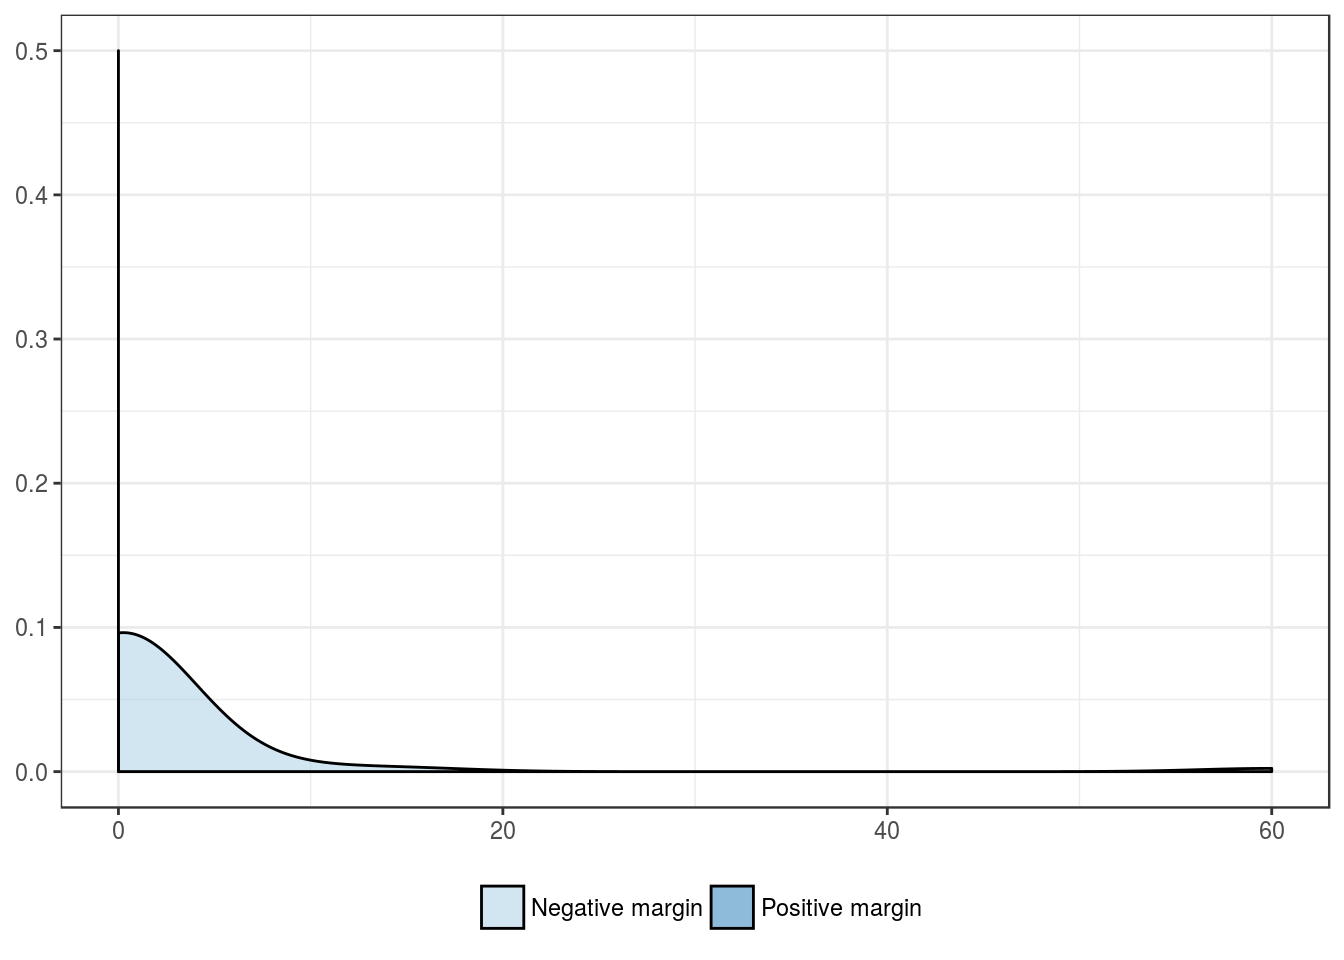
Surgical margin
| Negative margin | Positive margin | |
|---|---|---|
| Mean | 2.1 | 0 |
| Standard deviation | 9.0 | 0 |
| Median | 0.0 | 0 |
| Interquartile range | 0.0 | 0 |
| Minimum | 0.0 | 0 |
| Maximum | 60.0 | 0 |
| Value | |
|---|---|
| U-statistic | 56 |
| P statistic | 5.2e-01 |
Outcome features
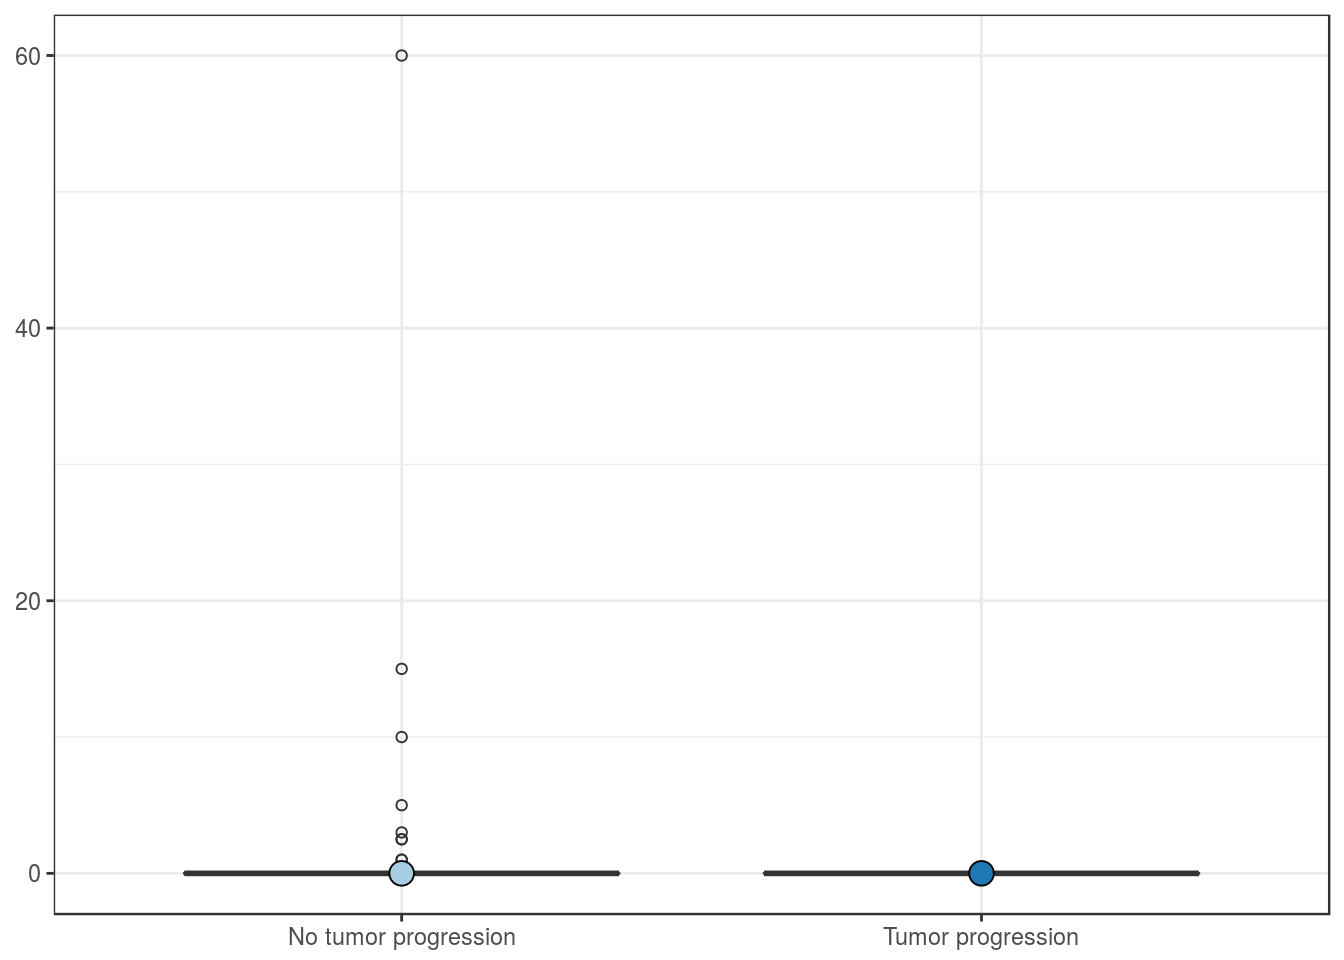
Tumor progression
| No tumor progression | Tumor progression | |
|---|---|---|
| Mean | 2.3 | 0 |
| Standard deviation | 9.3 | 0 |
| Median | 0.0 | 0 |
| Interquartile range | 0.0 | 0 |
| Minimum | 0.0 | 0 |
| Maximum | 60.0 | 0 |
| Value | |
|---|---|
| U-statistic | 159 |
| P statistic | 2.4e-01 |
Overall mortality
| ANOD + AWD | DOC + DOD | |
|---|---|---|
| Mean | 2.4 | 0.1 |
| Standard deviation | 9.5 | 0.4 |
| Median | 0.0 | 0.0 |
| Interquartile range | 0.0 | 0.0 |
| Minimum | 0.0 | 0.0 |
| Maximum | 60.0 | 1.0 |
| Value | |
|---|---|
| U-statistic | 182 |
| P statistic | 5.8e-01 |
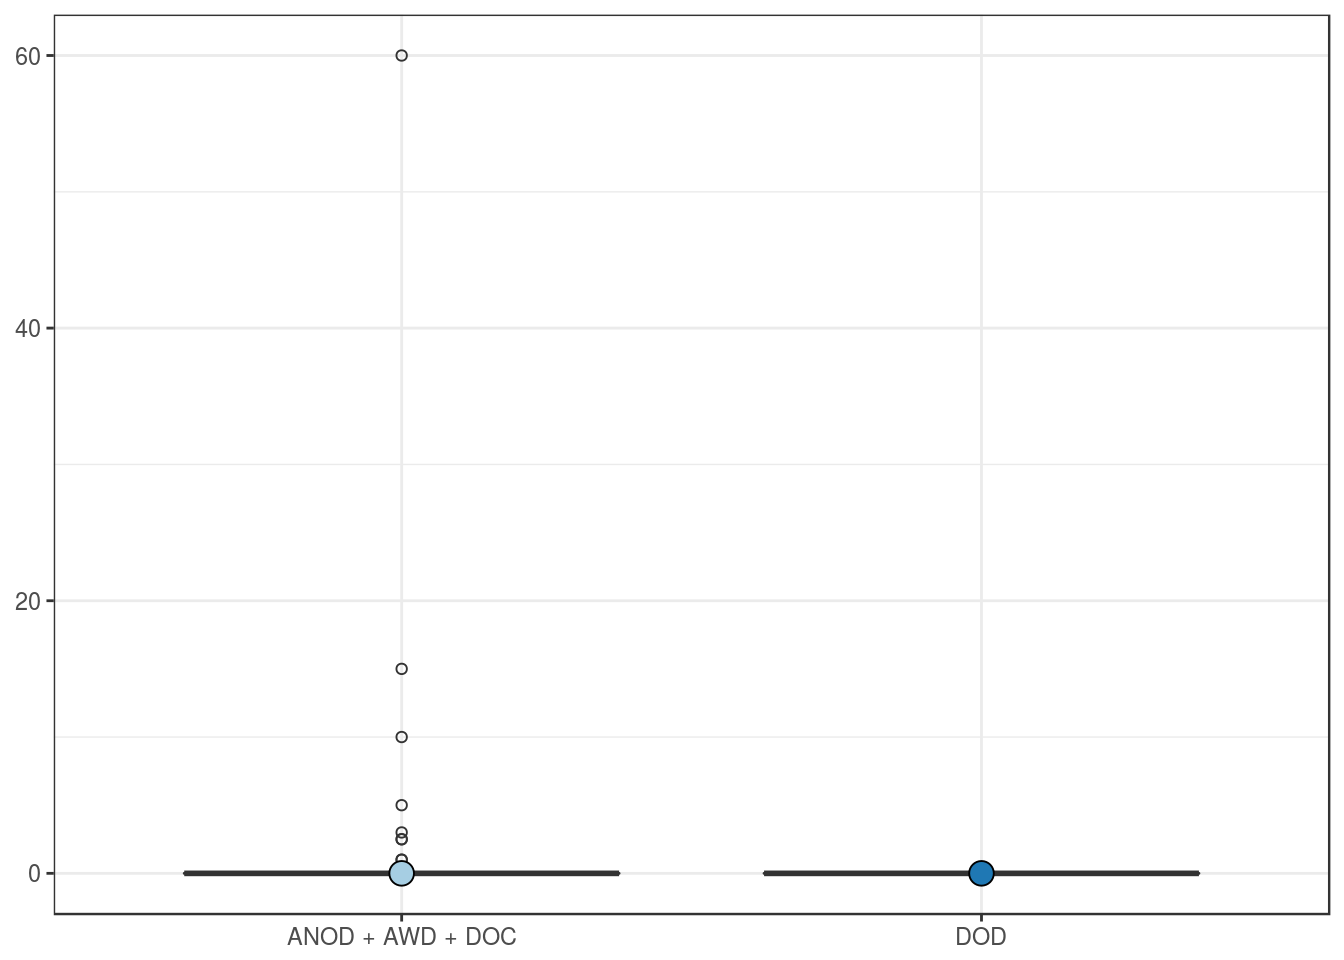
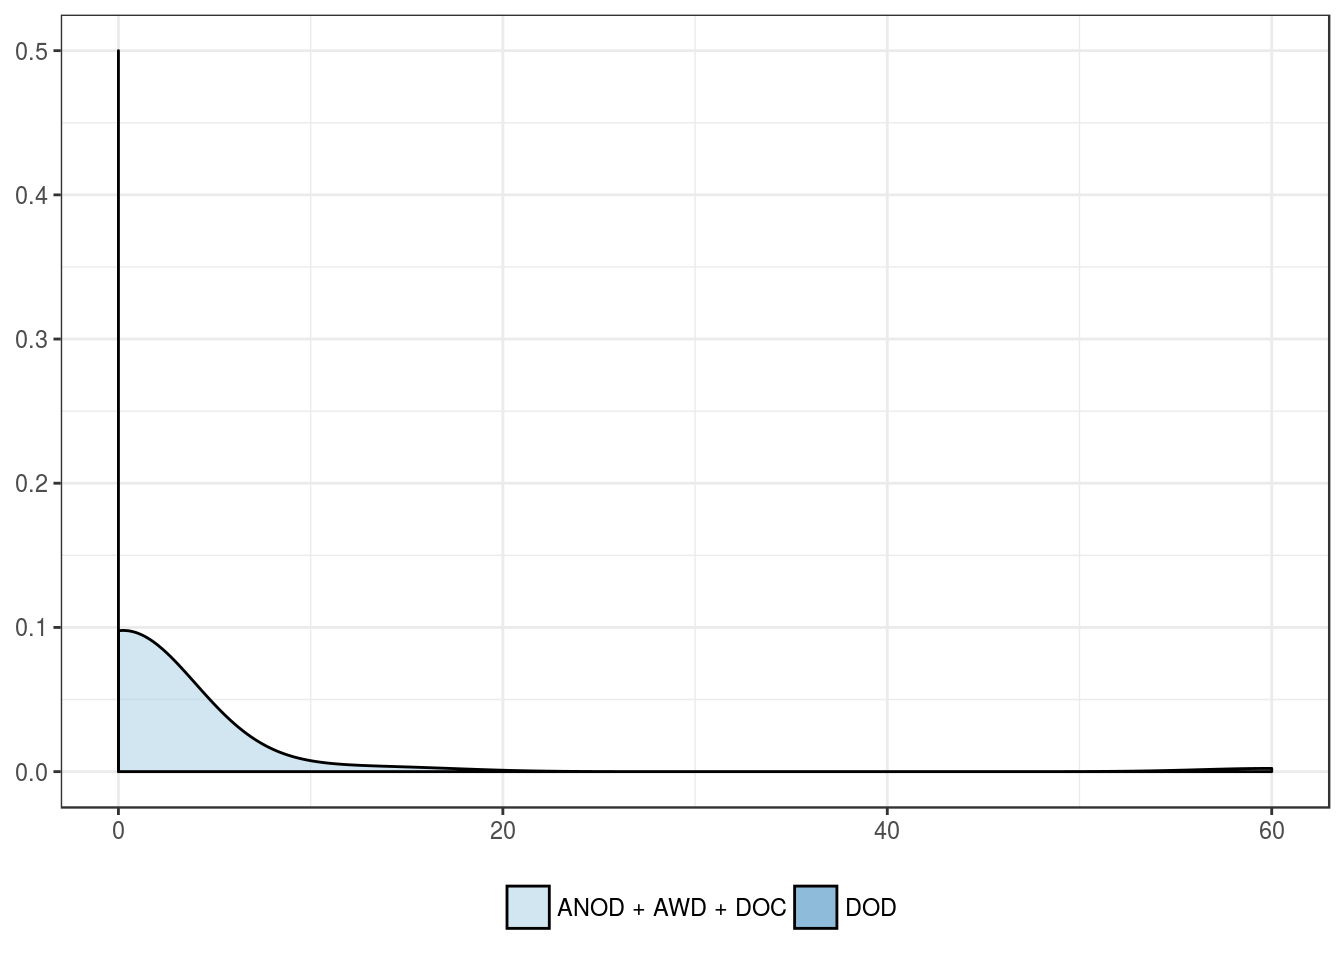
Cancer-related mortality
| ANOD + AWD + DOC | DOD | |
|---|---|---|
| Mean | 2.1 | 0 |
| Standard deviation | 9.0 | 0 |
| Median | 0.0 | 0 |
| Interquartile range | 0.0 | 0 |
| Minimum | 0.0 | 0 |
| Maximum | 60.0 | 0 |
| Value | |
|---|---|
| U-statistic | 57 |
| P statistic | 5.3e-01 |