Markers features by tissue types
Nontumor tissues vs. primary tumors vs. metastatic tumors
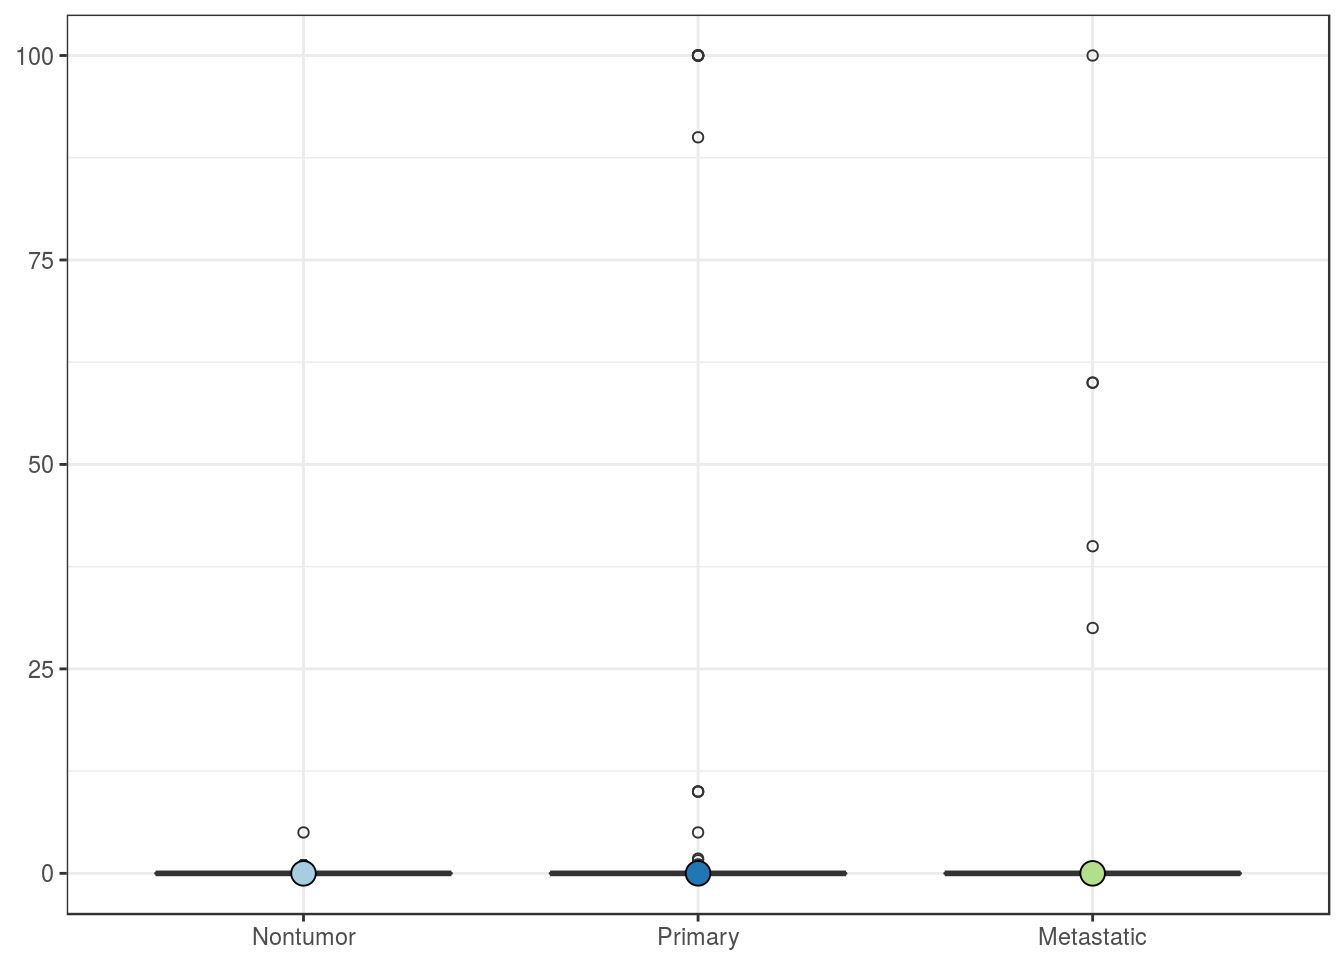
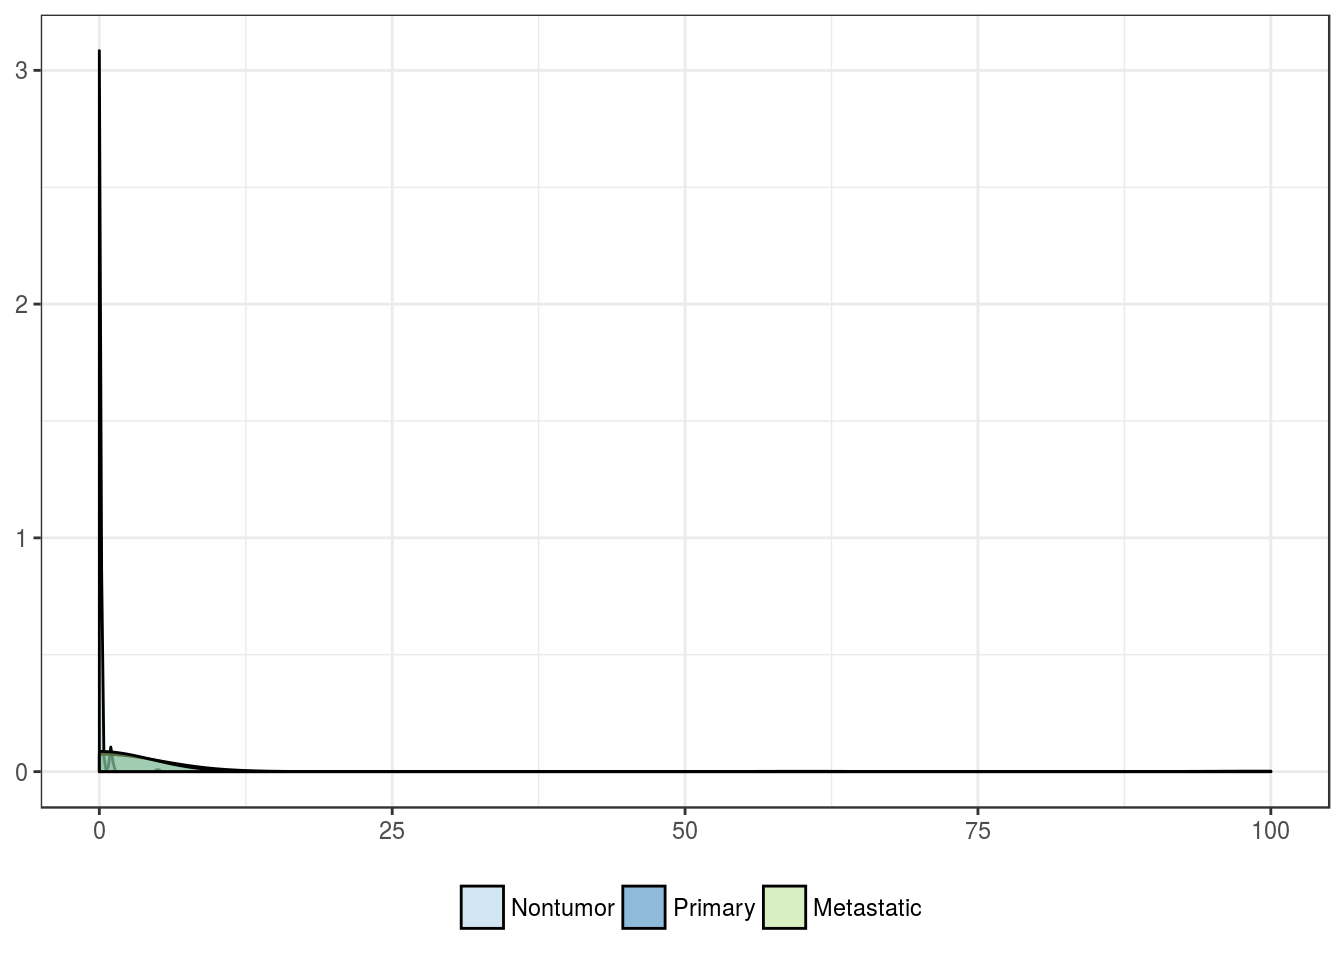
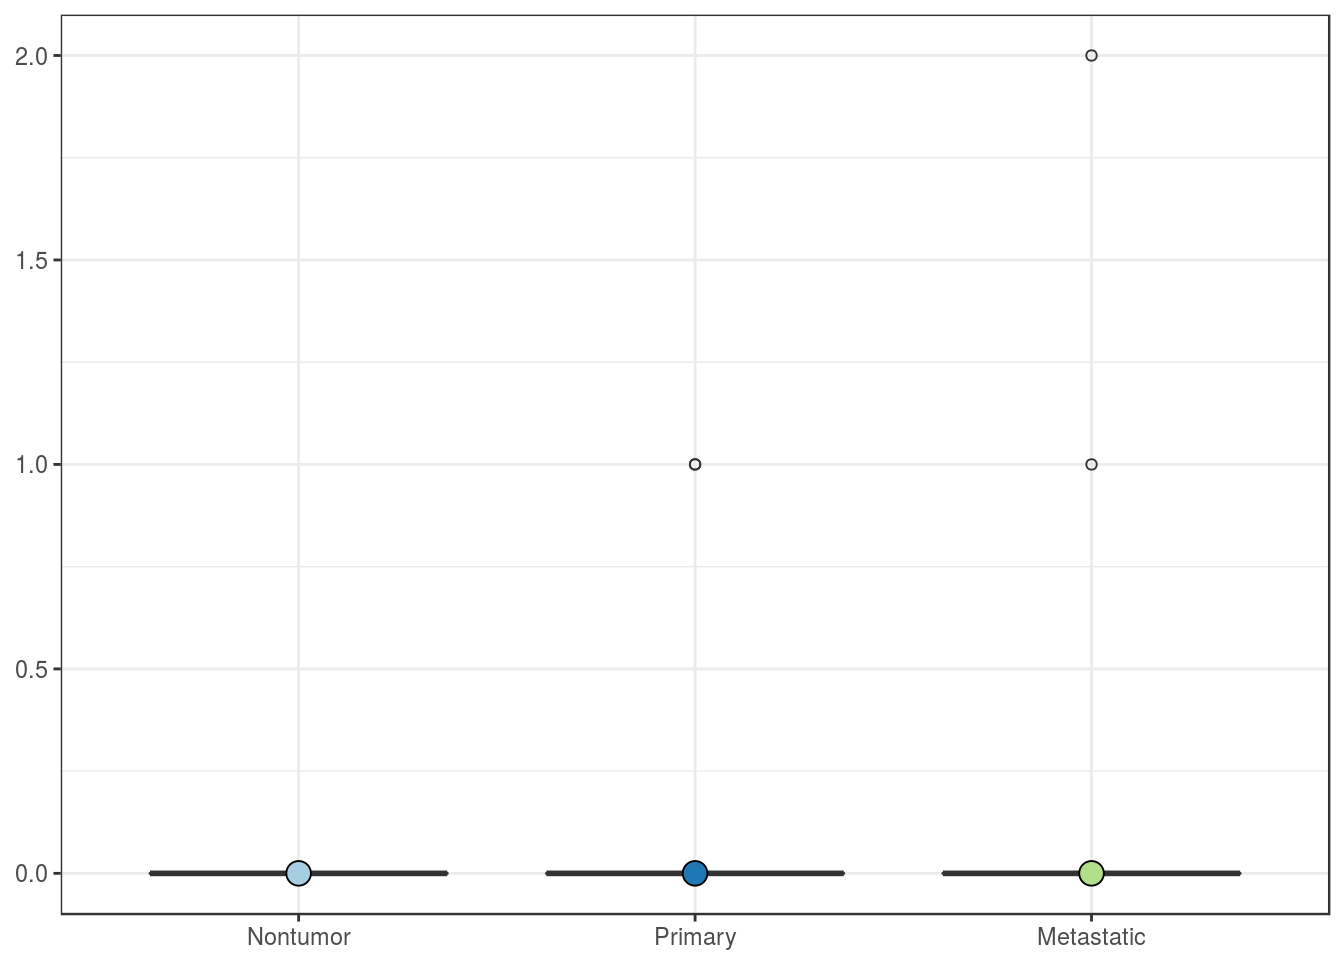
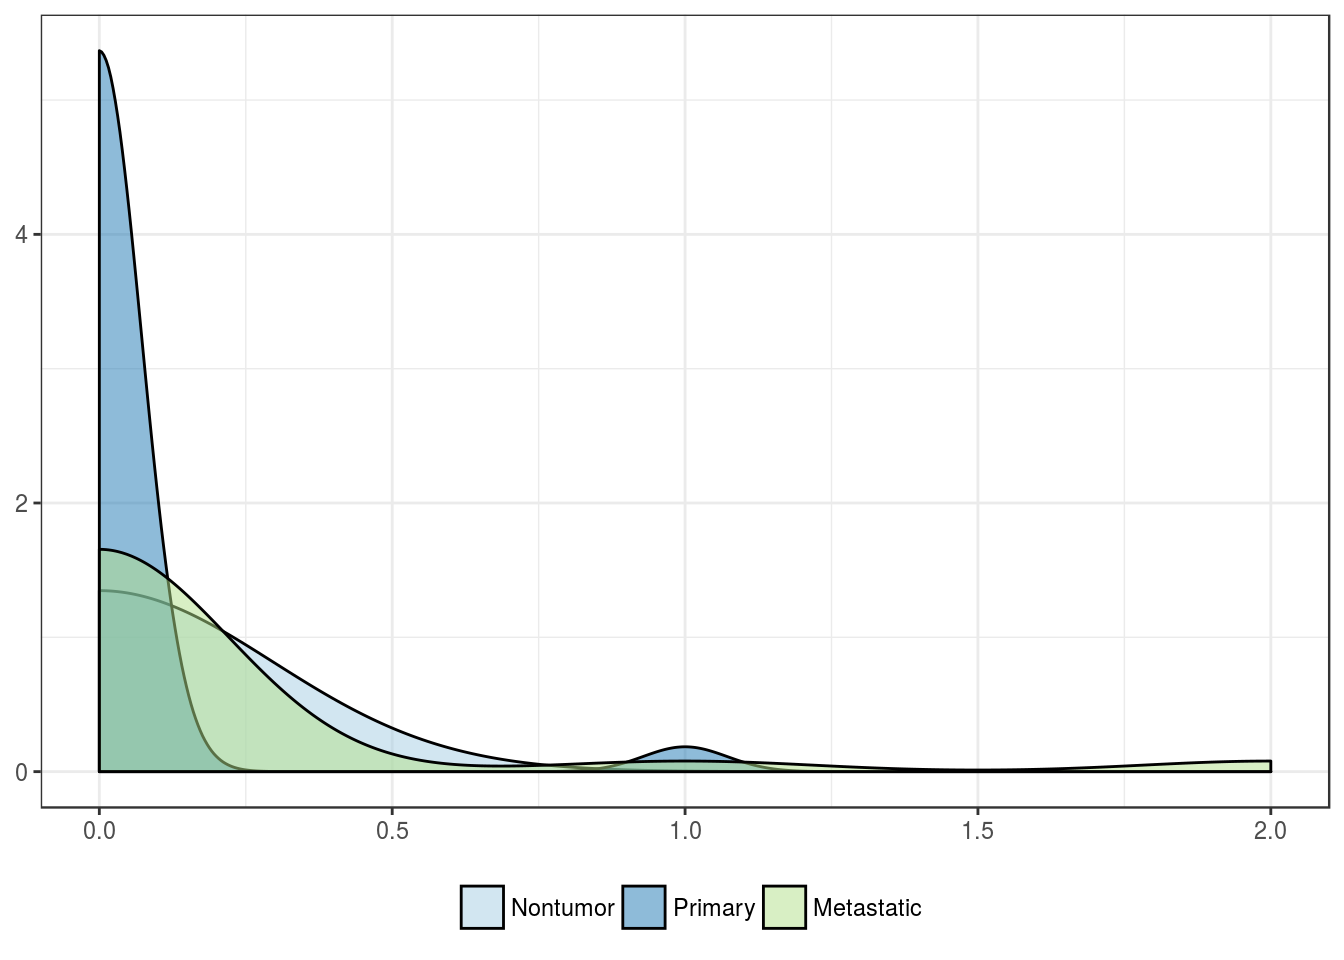
PD-L1 expression
PD-L1 positivity in parenchymal cells, %
| Nontumor | Primary | Metastatic | |
|---|---|---|---|
| Mean | 0.1 | 3.3 | 2.5 |
| Standard deviation | 0.4 | 17.2 | 12.7 |
| Median | 0.0 | 0.0 | 0.0 |
| Interquartile range | 0.0 | 0.0 | 0.0 |
| Minimum | 0.0 | 0.0 | 0.0 |
| Maximum | 5.0 | 100.0 | 100.0 |
| Value | |
|---|---|
| Statistic | 9.57 |
| Parameter | 2 |
| P statistic | 0.0084 |
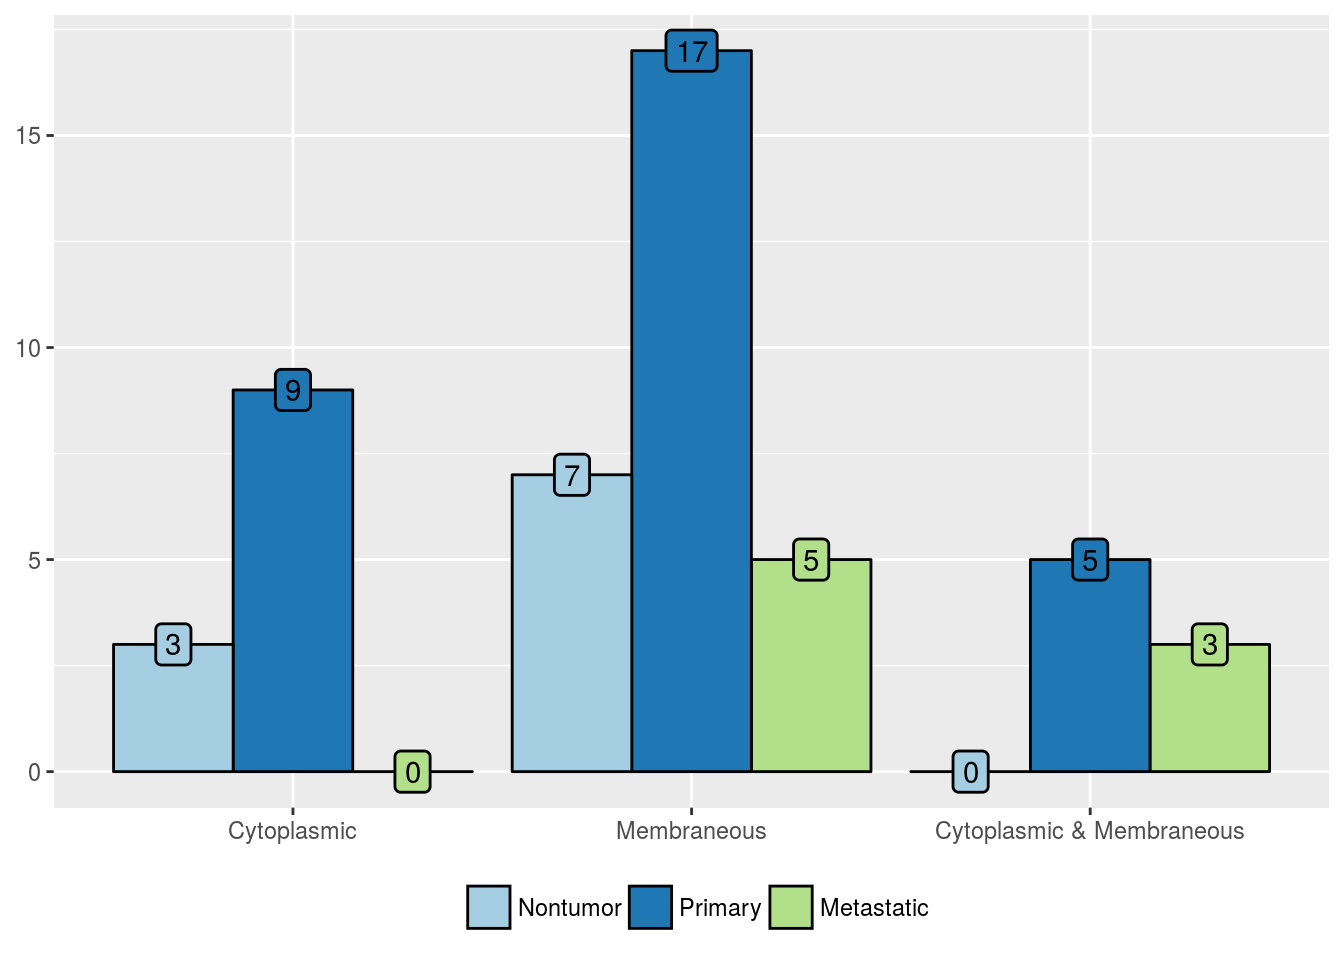
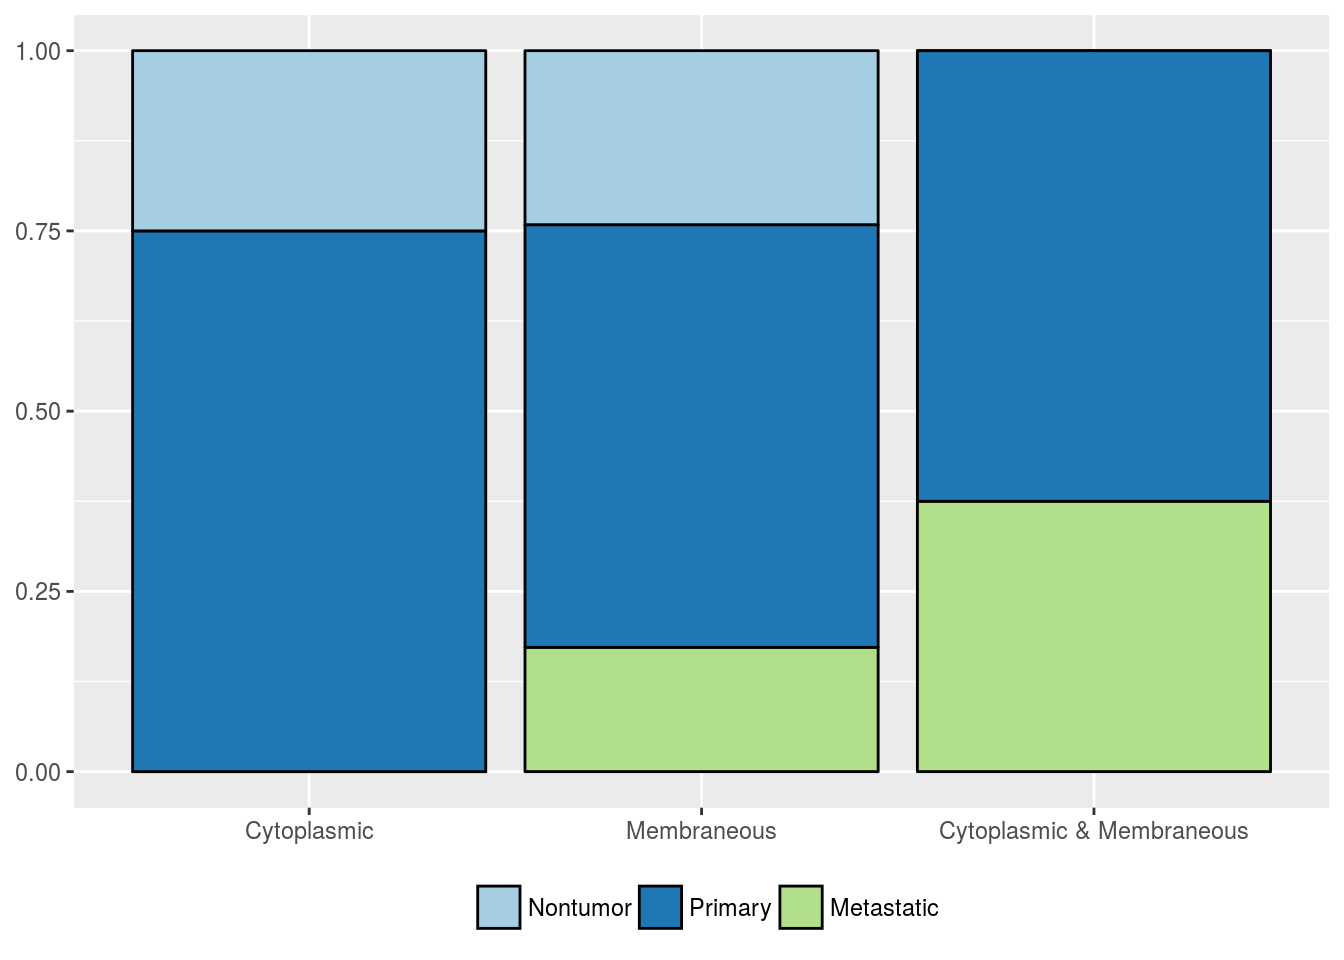
Location of PD-L1 expression in parenchymal cells
| Nontumor (%) | Primary (%) | Metastatic (%) | |
|---|---|---|---|
| Cytoplasmic | 3 (30) | 9 (29) | 0 (0) |
| Membraneous | 7 (70) | 17 (54.8) | 5 (62.5) |
| Cytoplasmic & Membraneous | 0 (0) | 5 (16.1) | 3 (37.5) |
| Value | |
|---|---|
| Statistic | 6.486 |
| Parameter | 4 |
| P statistic | 0.17 |
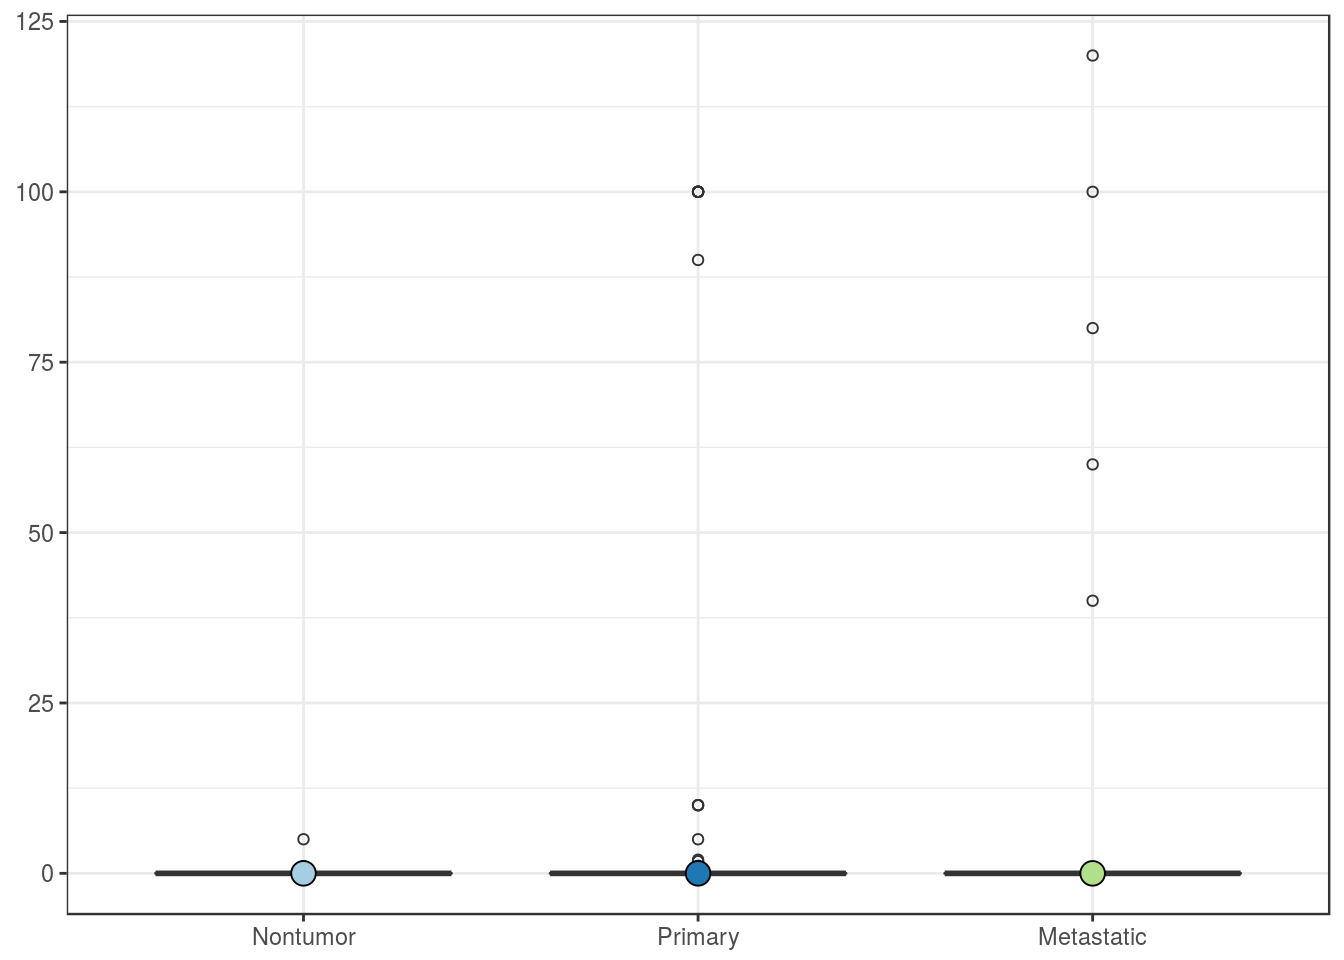
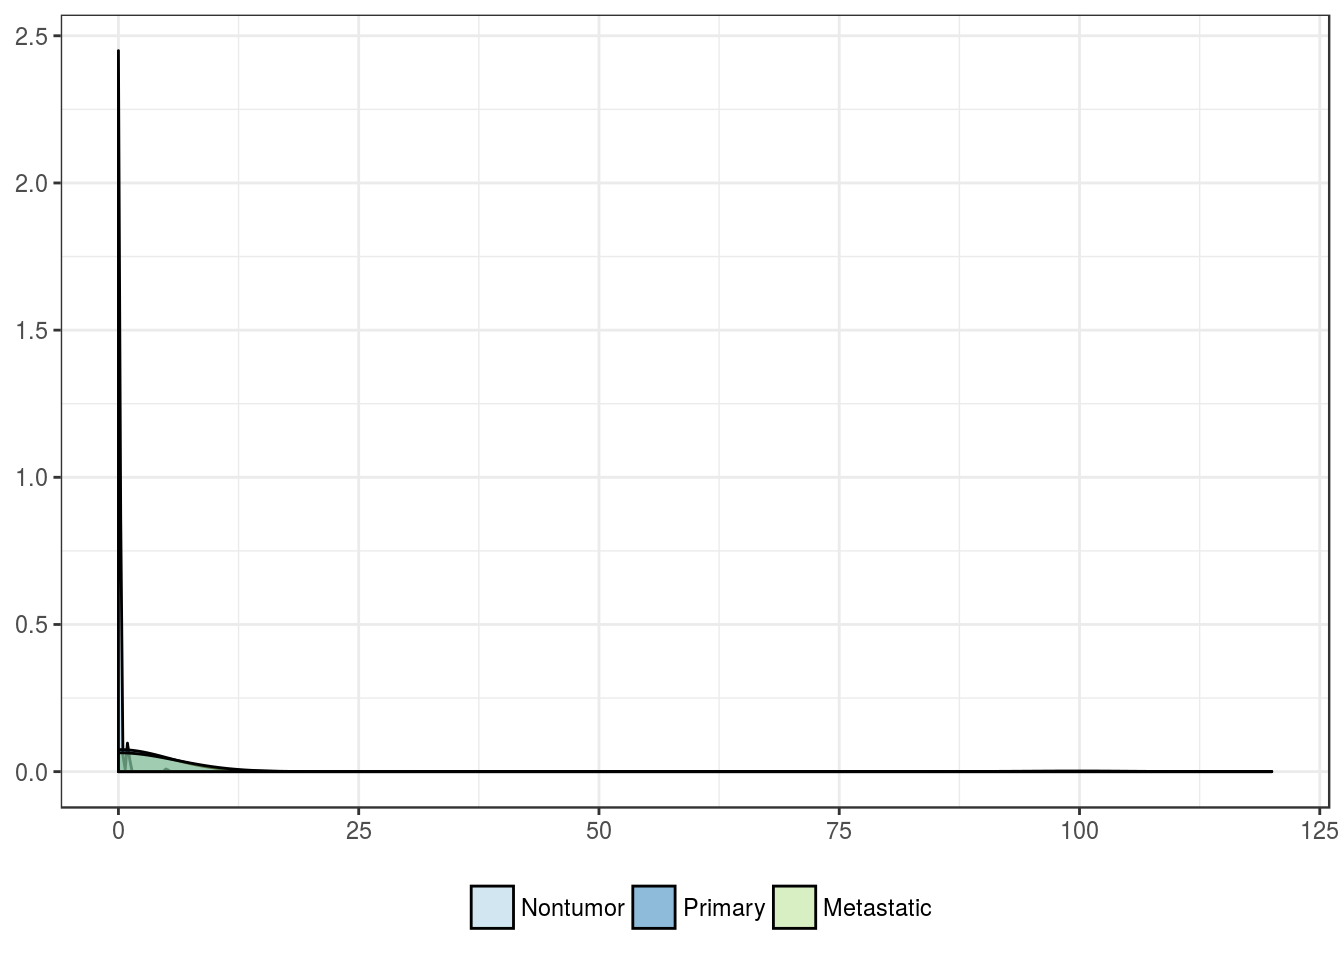
PD-L1 H-score in parenchymal cells
| Nontumor | Primary | Metastatic | |
|---|---|---|---|
| Mean | 0.1 | 3.3 | 3.4 |
| Standard deviation | 0.4 | 17.2 | 17.2 |
| Median | 0.0 | 0.0 | 0.0 |
| Interquartile range | 0.0 | 0.0 | 0.0 |
| Minimum | 0.0 | 0.0 | 0.0 |
| Maximum | 5.0 | 100.0 | 120.0 |
| Value | |
|---|---|
| Statistic | 9.571 |
| Parameter | 2 |
| P statistic | 0.0084 |
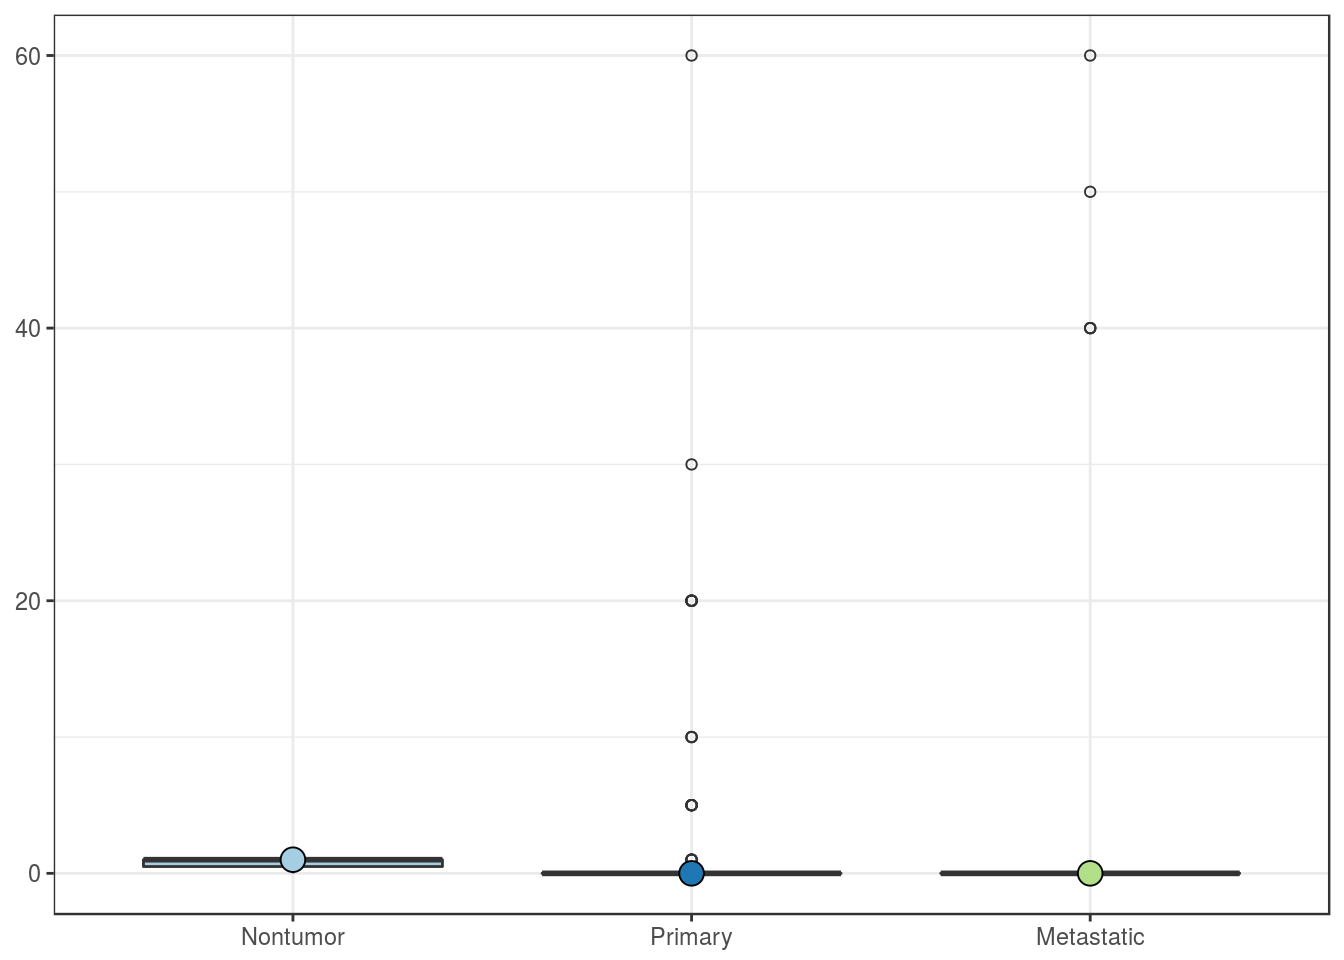
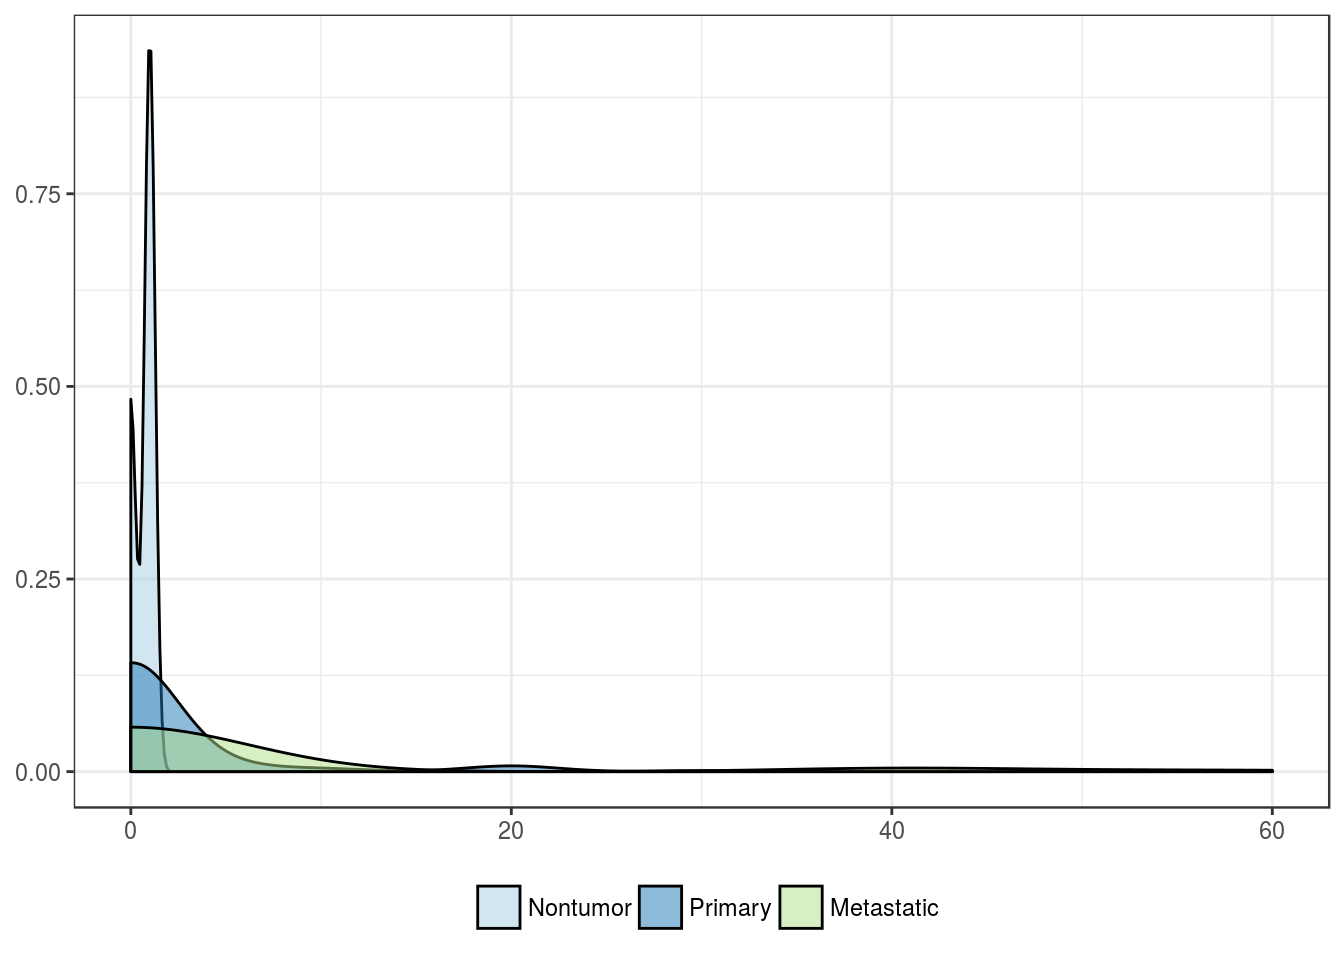
PD-L1 positivity in stromal cells, %
| Nontumor | Primary | Metastatic | |
|---|---|---|---|
| Mean | 0.7 | 2.1 | 5.0 |
| Standard deviation | 0.6 | 7.2 | 14.7 |
| Median | 1.0 | 0.0 | 0.0 |
| Interquartile range | 0.5 | 0.0 | 0.0 |
| Minimum | 0.0 | 0.0 | 0.0 |
| Maximum | 1.0 | 60.0 | 60.0 |
| Value | |
|---|---|
| Statistic | 4.434 |
| Parameter | 2 |
| P statistic | 0.11 |
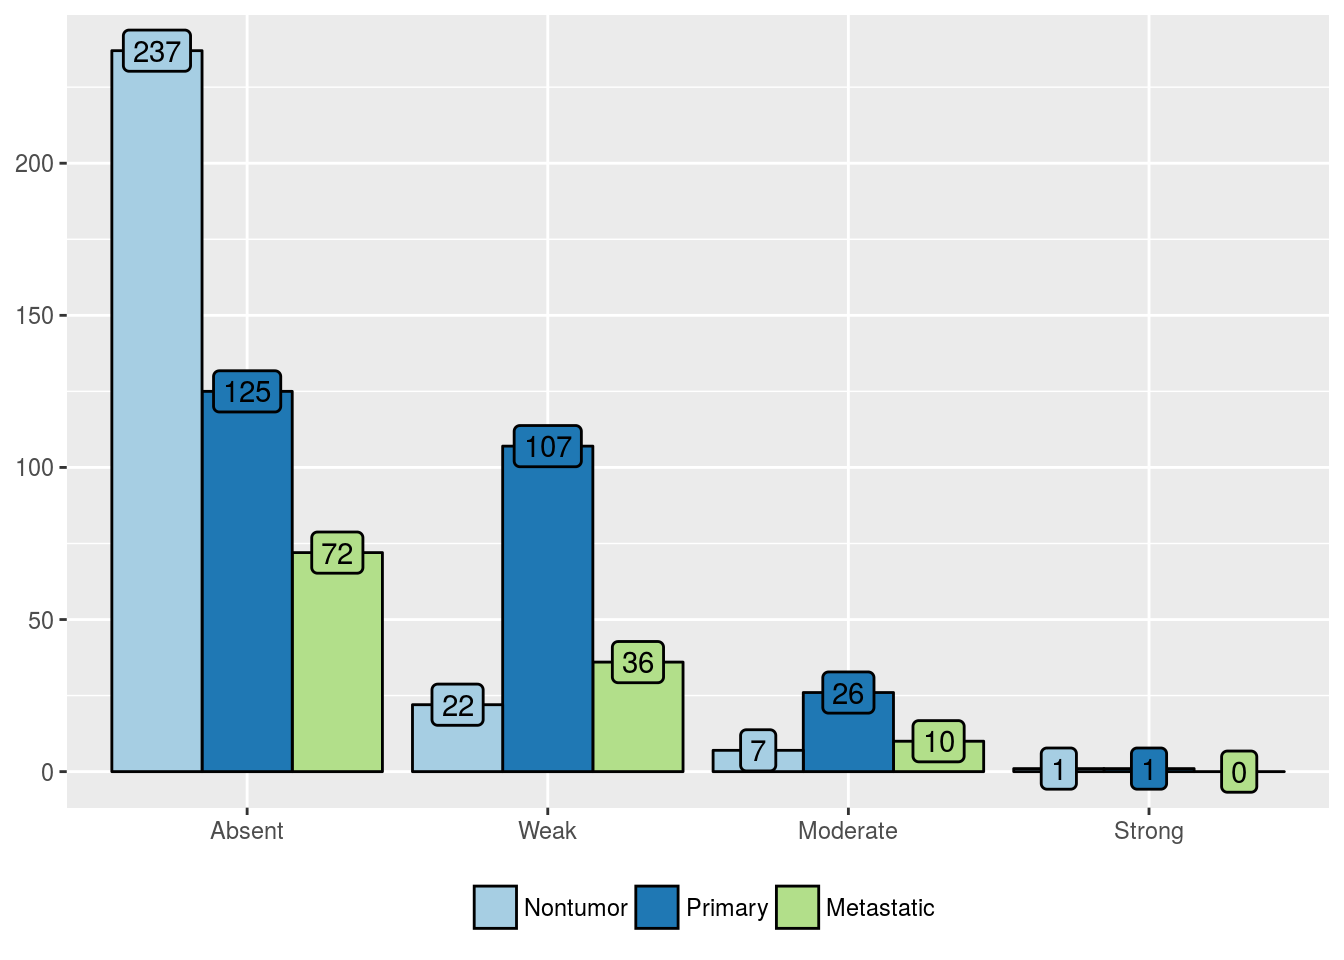
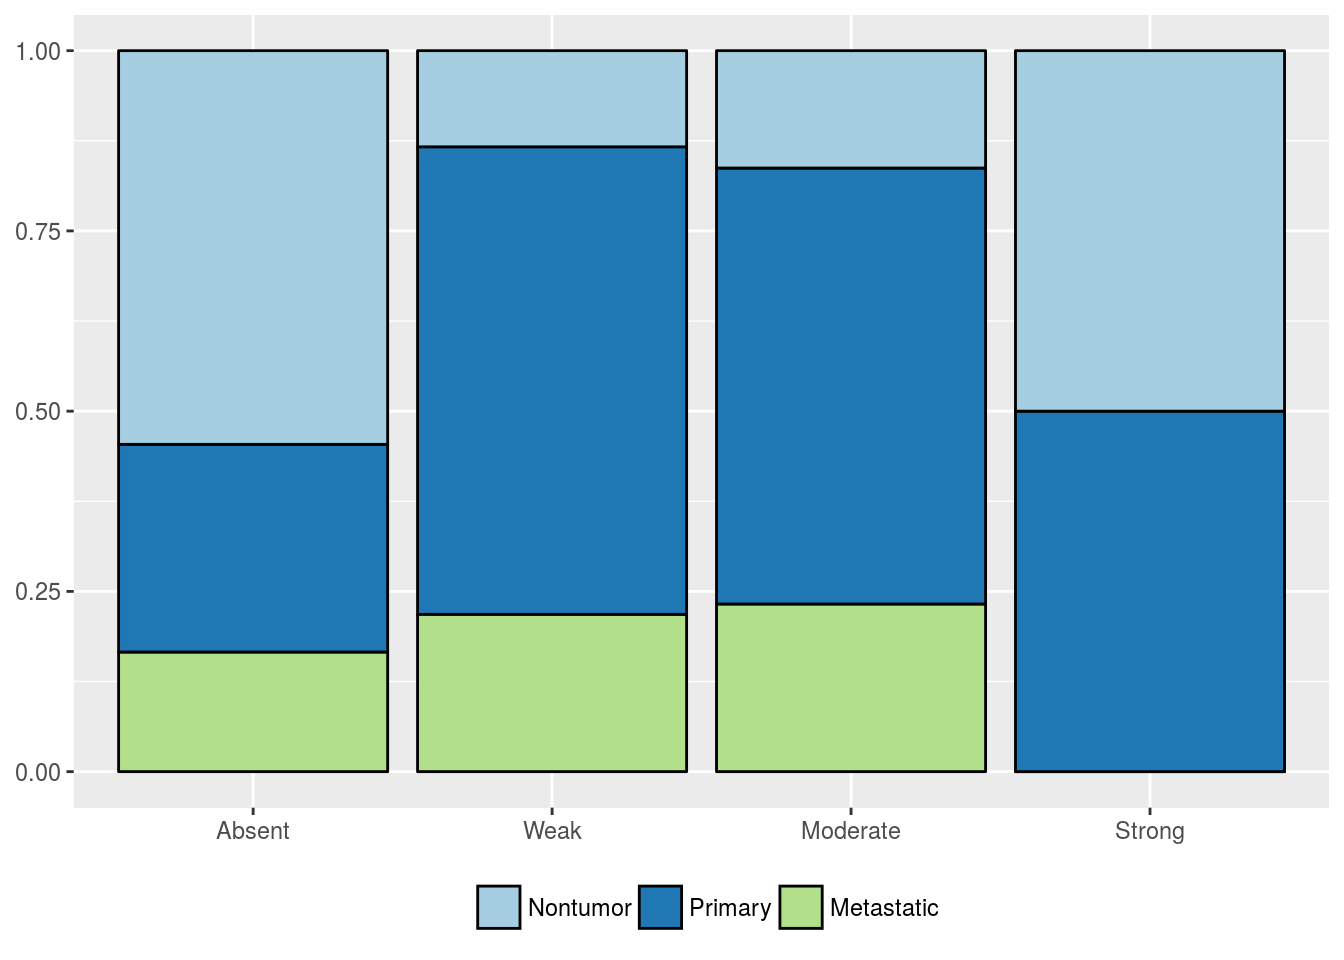
Host response
| Nontumor (%) | Primary (%) | Metastatic (%) | |
|---|---|---|---|
| Absent | 237 (88.8) | 125 (48.3) | 72 (61) |
| Weak | 22 (8.2) | 107 (41.3) | 36 (30.5) |
| Moderate | 7 (2.6) | 26 (10) | 10 (8.5) |
| Strong | 1 (0.4) | 1 (0.4) | 0 (0) |
| Value | |
|---|---|
| Statistic | 102.3 |
| Parameter | 6 |
| P statistic | 8.2e-20 |
FOXP3 expression
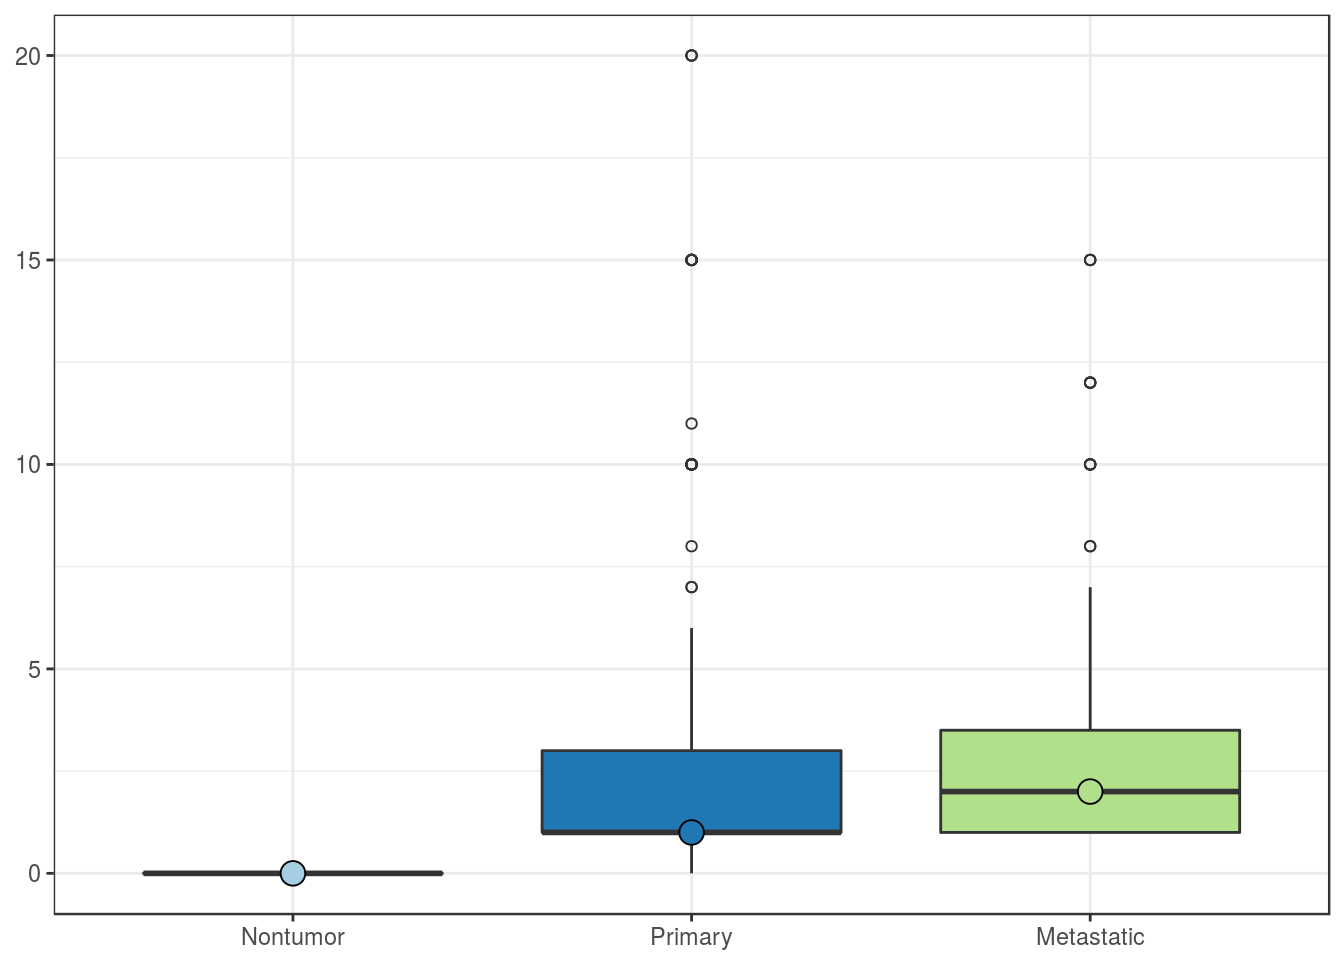
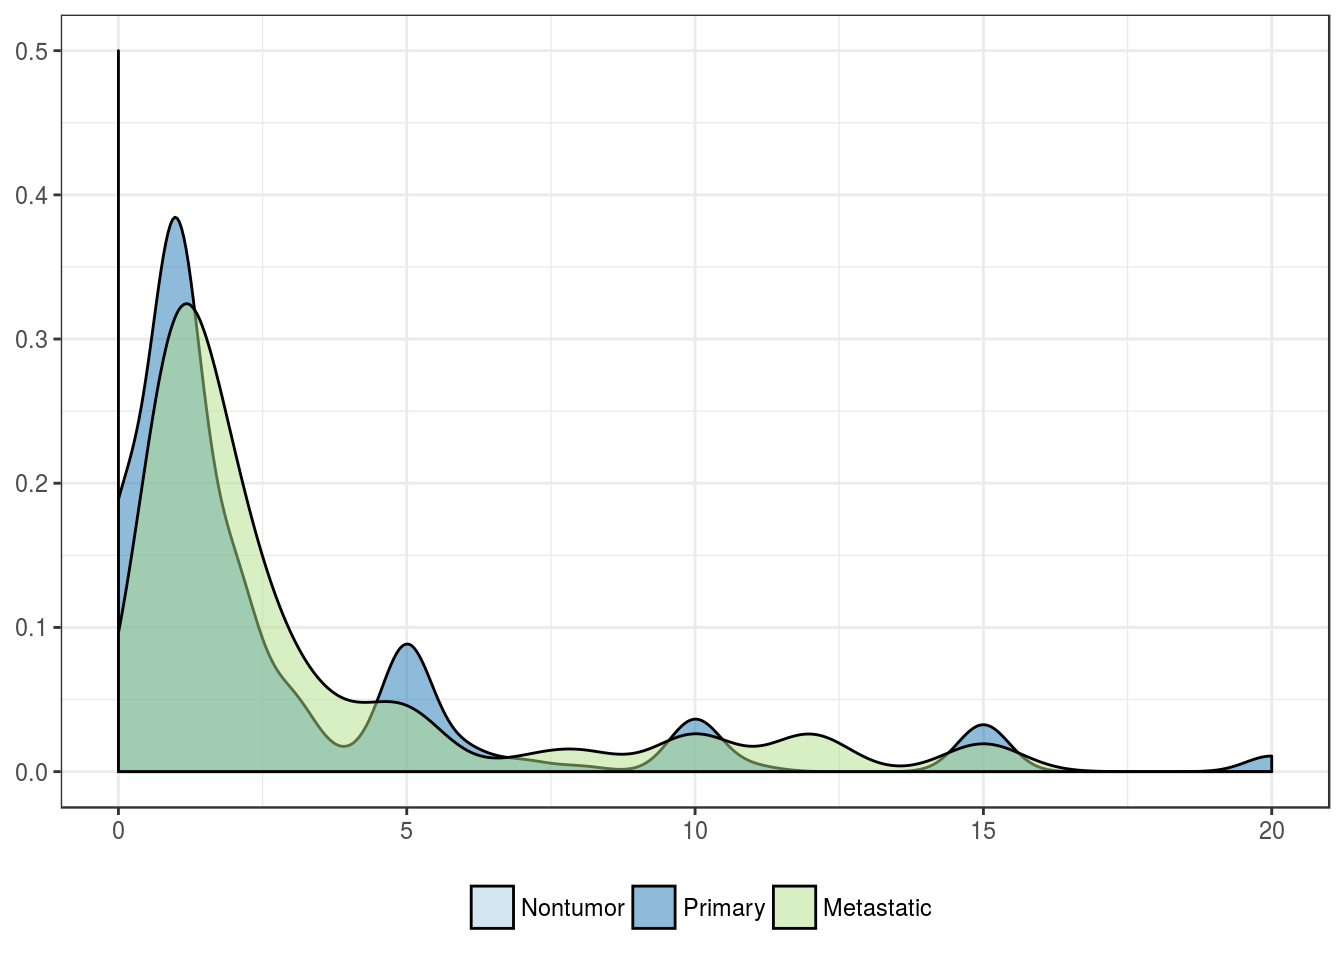
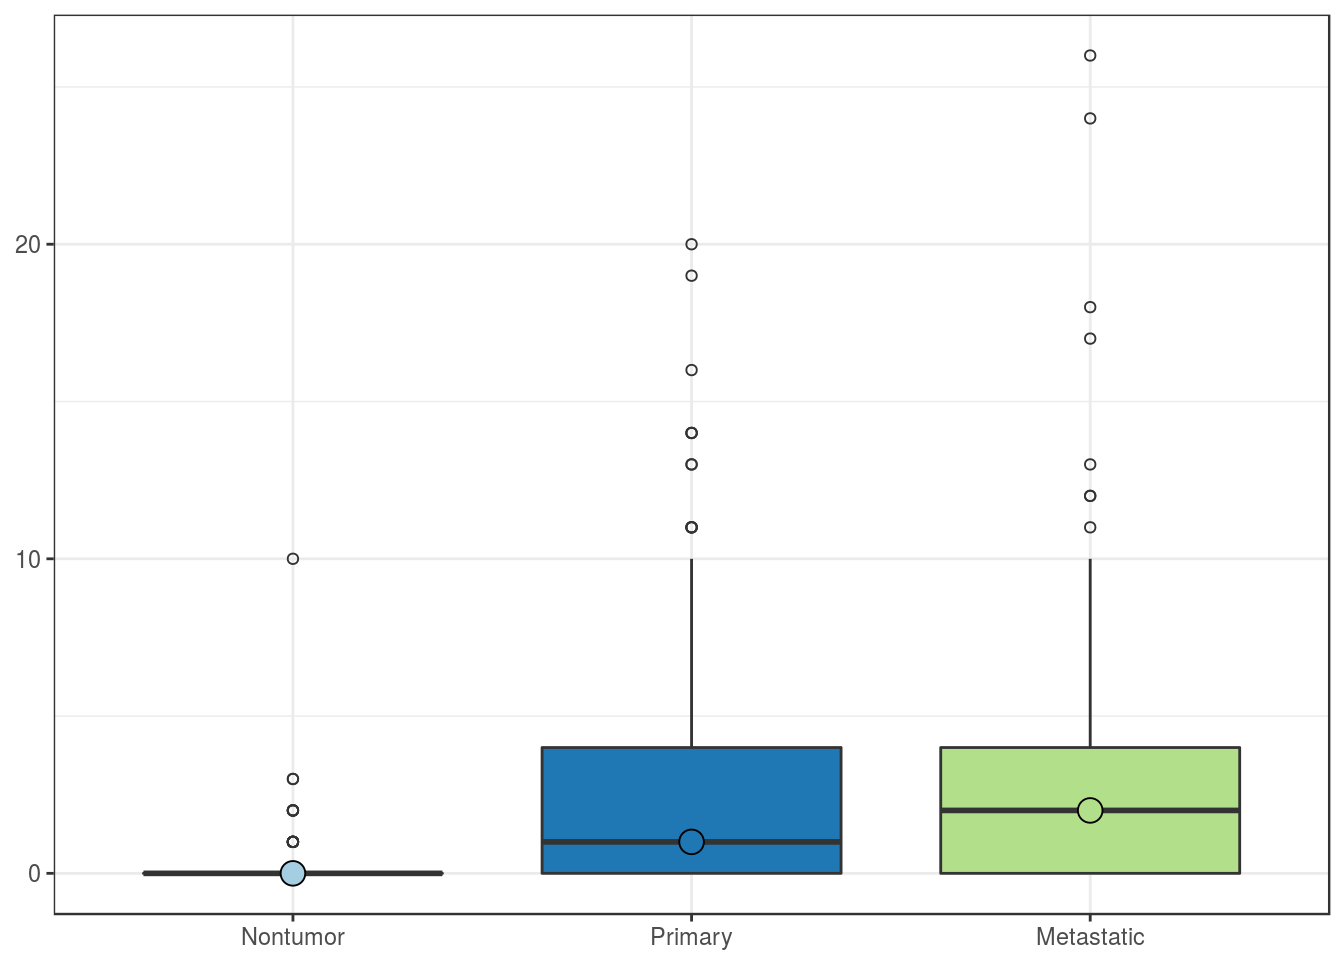
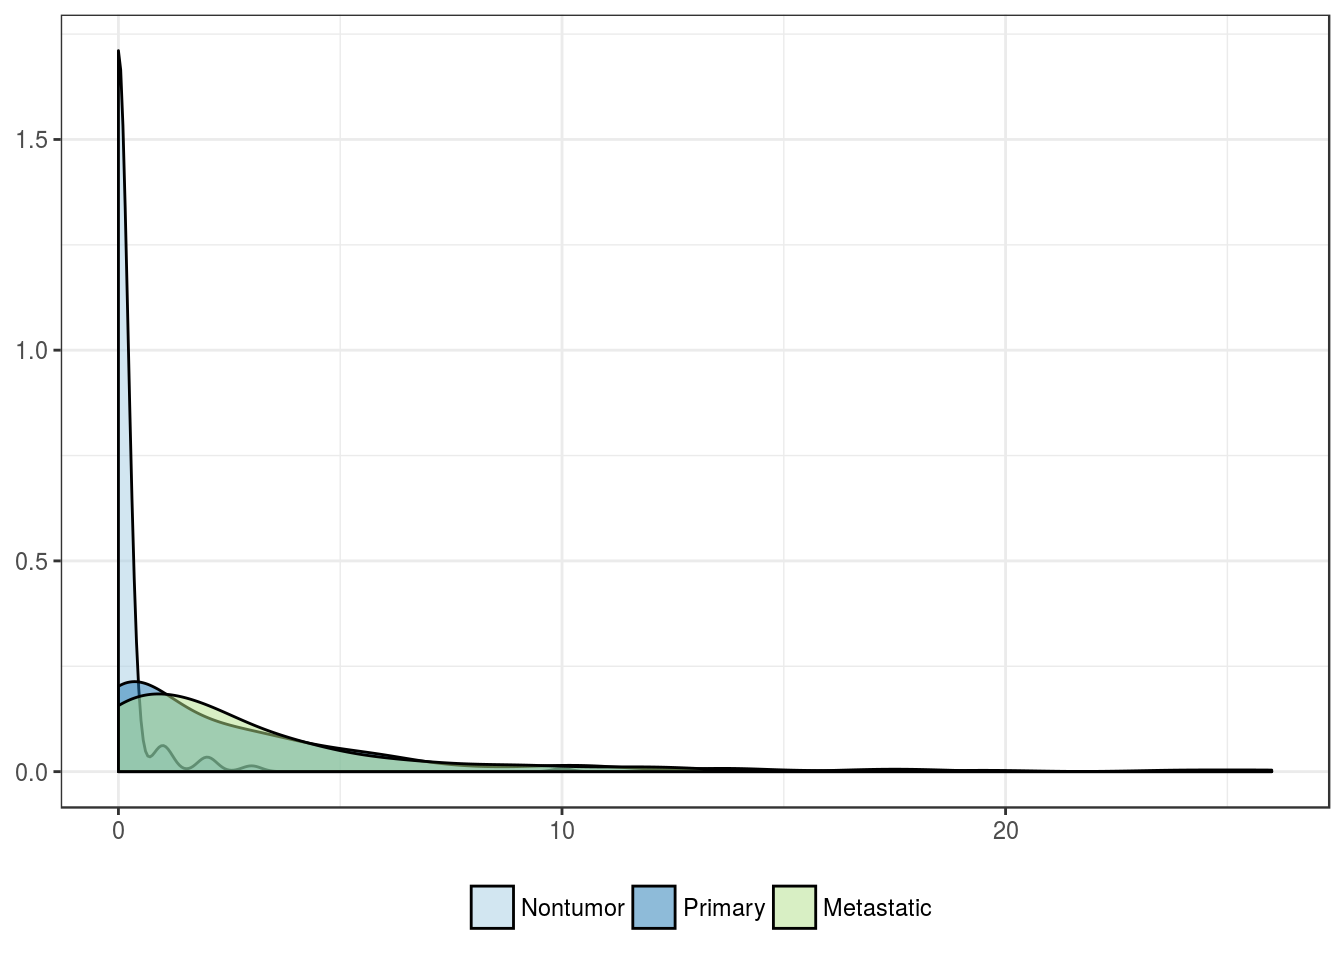
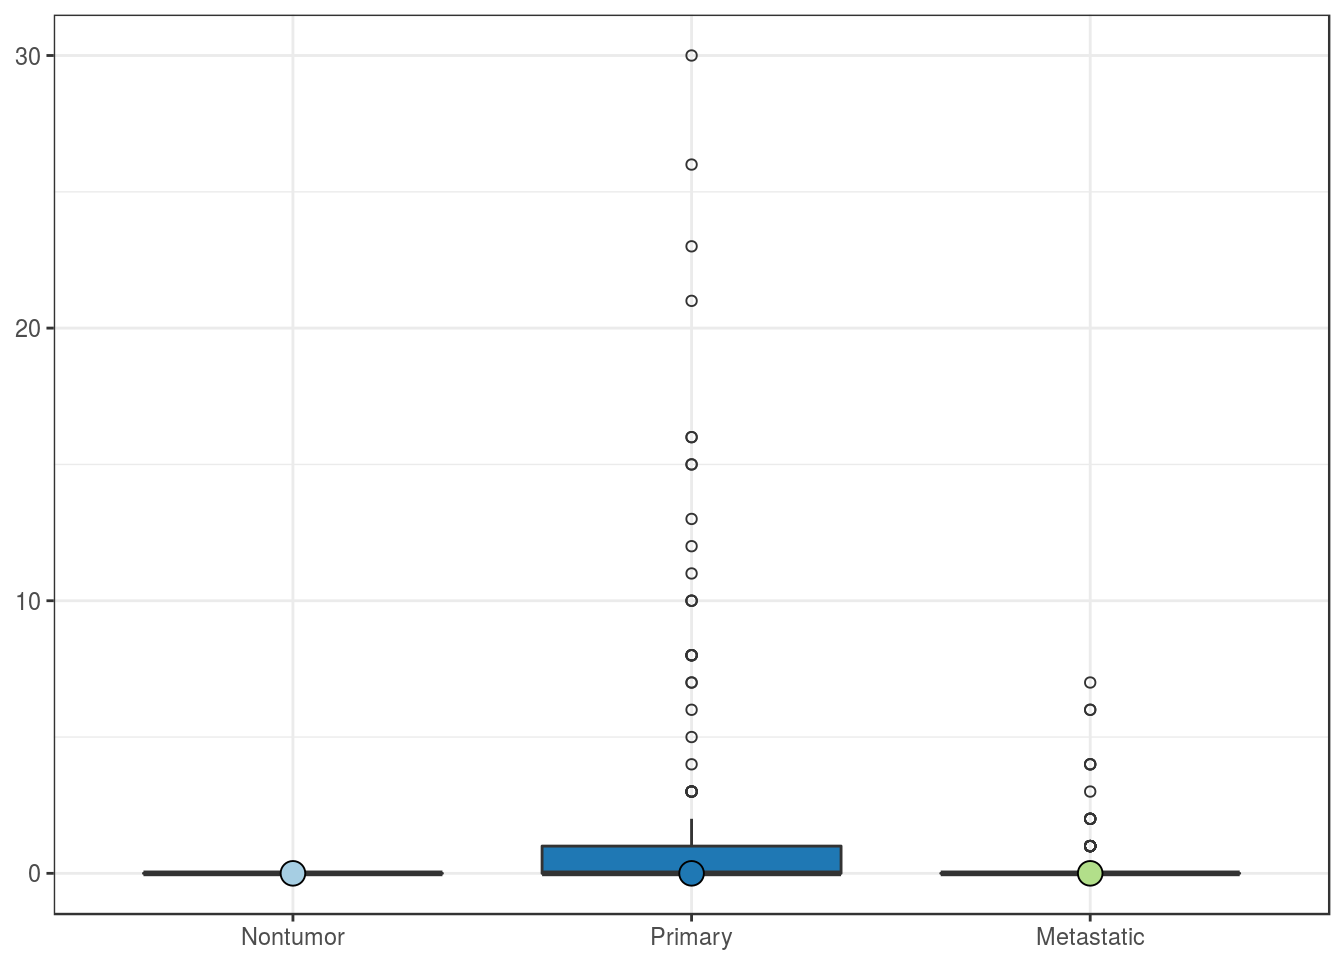
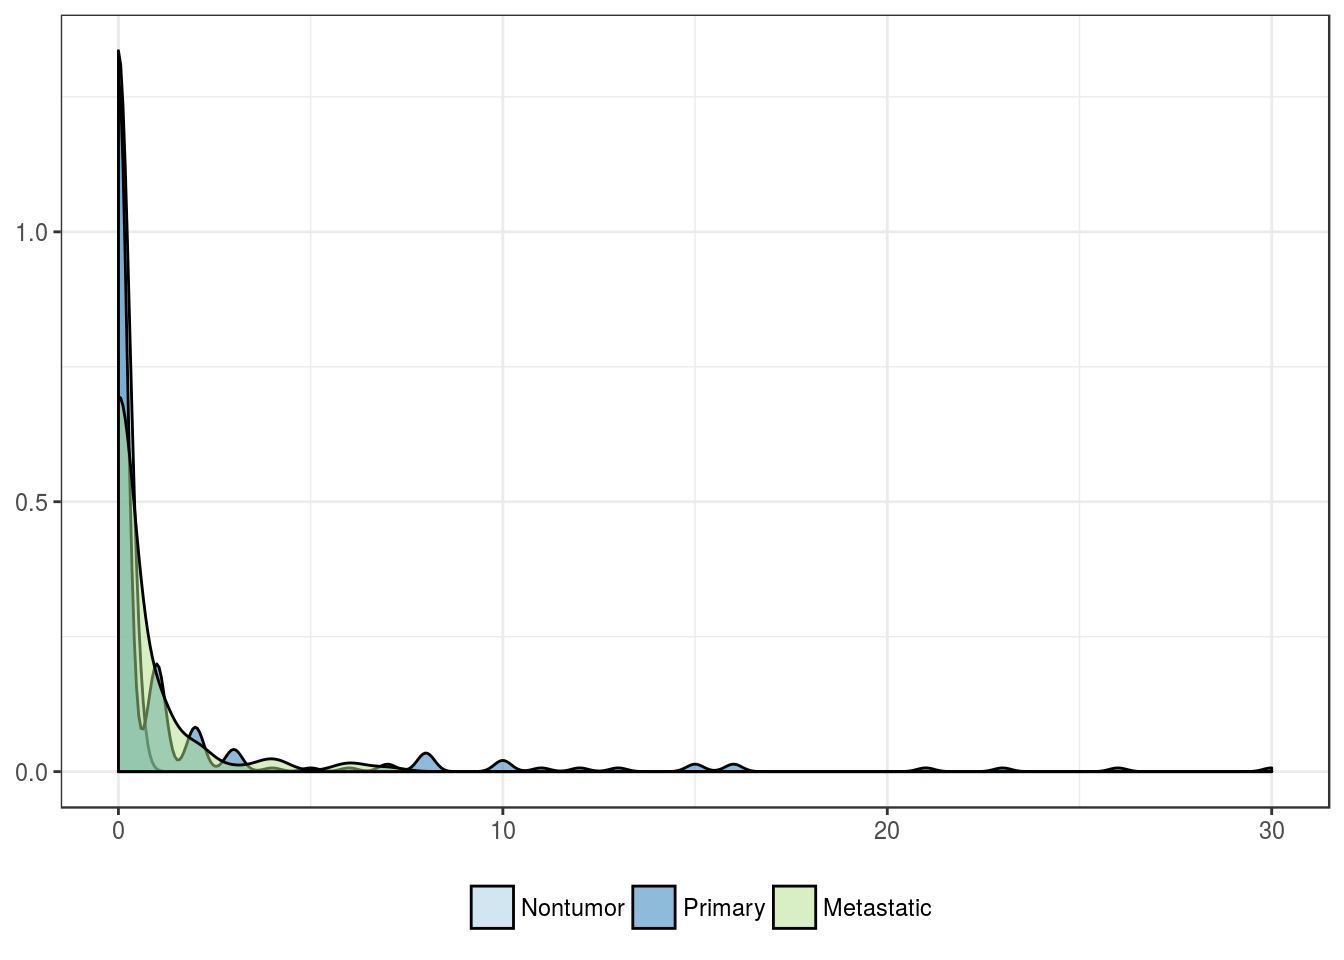
FOXP3 positivity in intraparenchymal lymphocytes, N
| Nontumor | Primary | Metastatic | |
|---|---|---|---|
| Mean | 0.1 | 2.6 | 3.2 |
| Standard deviation | 0.7 | 3.5 | 4.5 |
| Median | 0.0 | 1.0 | 2.0 |
| Interquartile range | 0.0 | 4.0 | 4.0 |
| Minimum | 0.0 | 0.0 | 0.0 |
| Maximum | 10.0 | 20.0 | 26.0 |
| Value | |
|---|---|
| Statistic | 230.4 |
| Parameter | 2 |
| P statistic | 9.5e-51 |
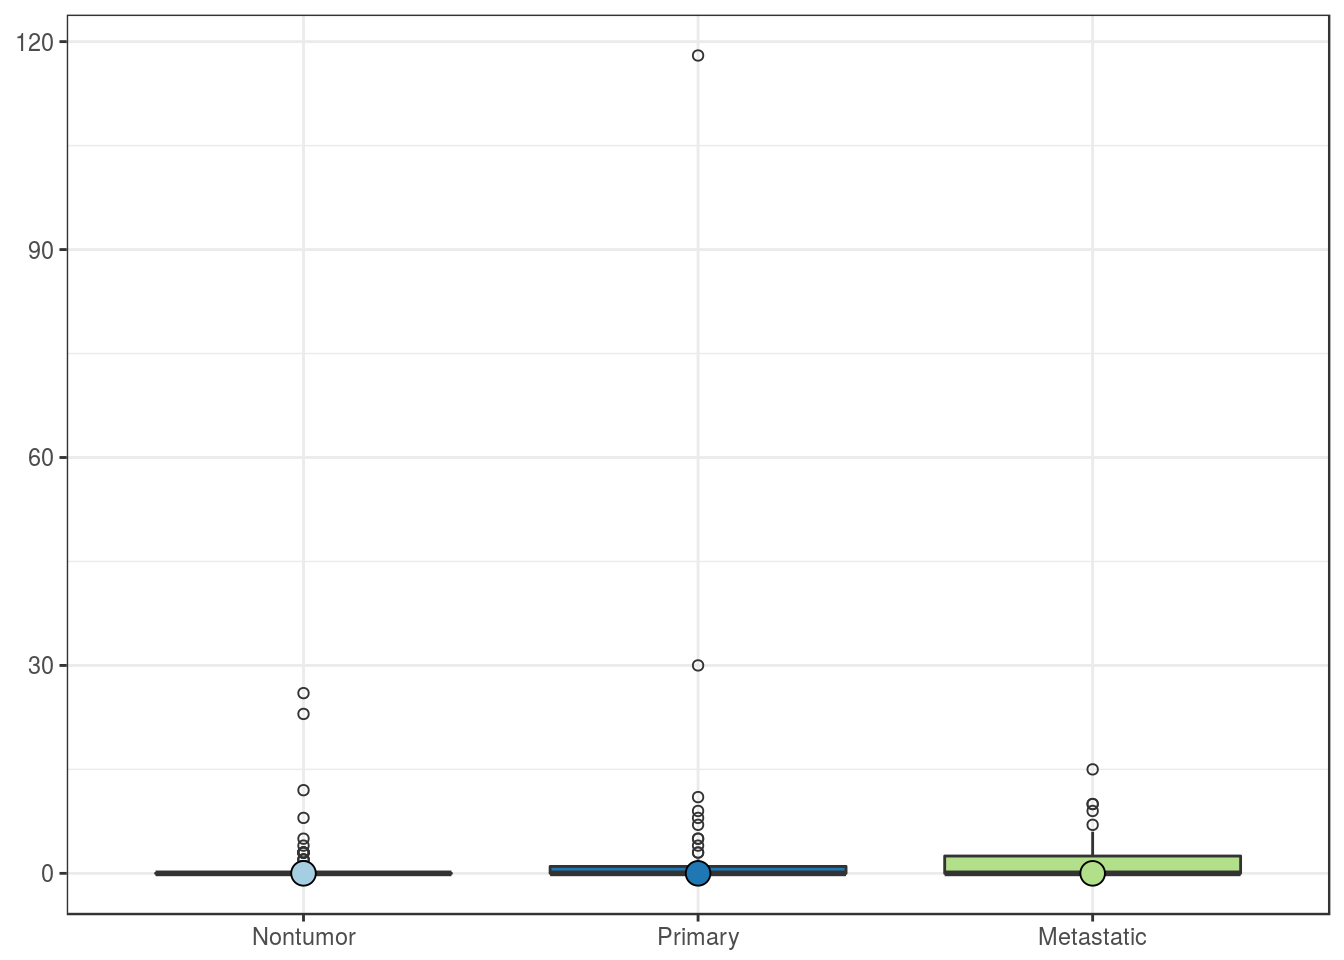
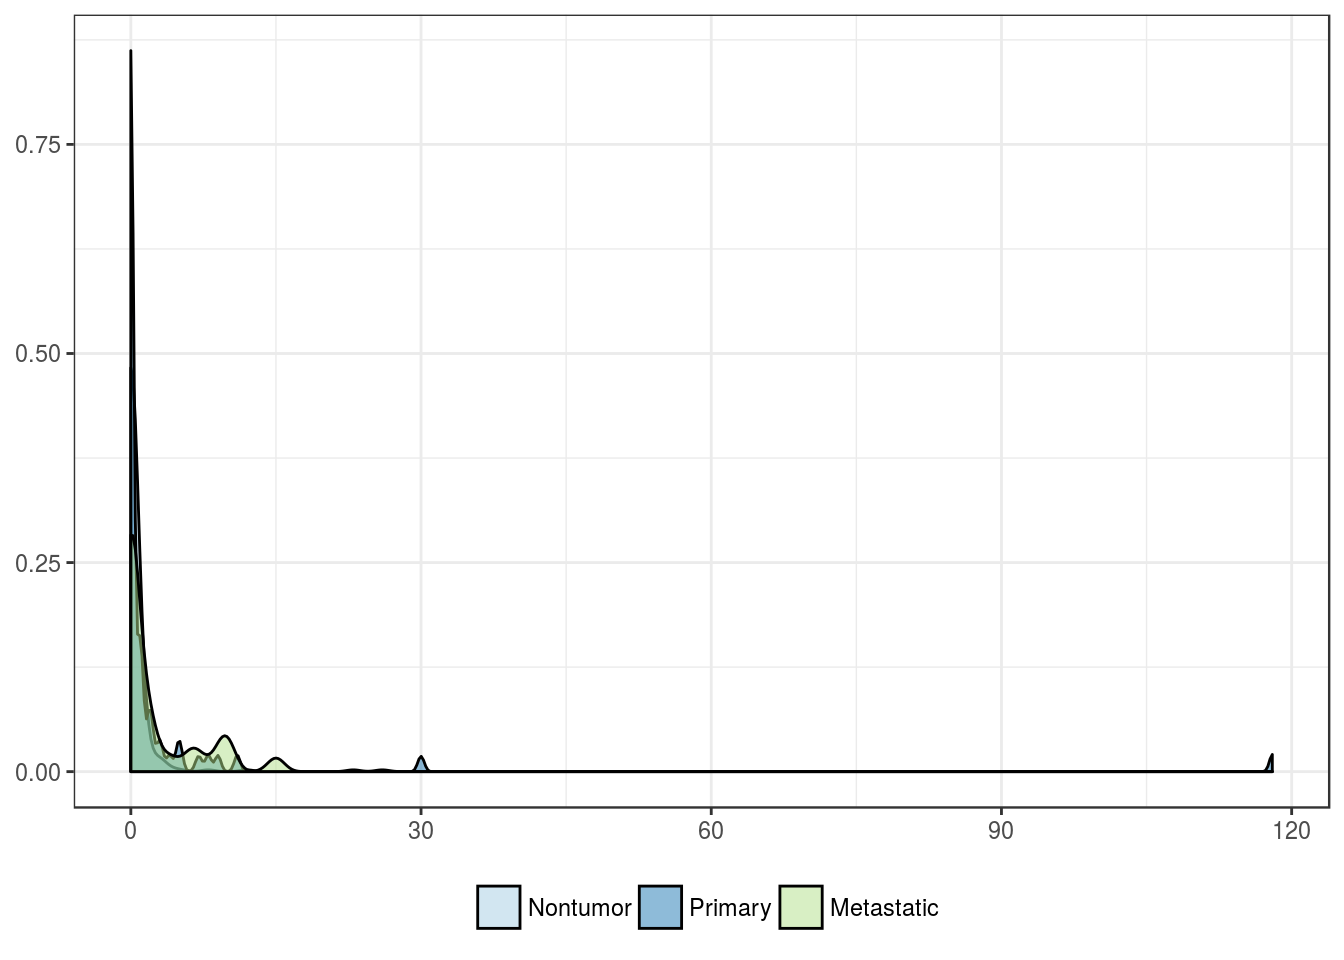
FOXP3 positivity in stromal lymphocytes, N
| Nontumor | Primary | Metastatic | |
|---|---|---|---|
| Mean | 0.5 | 3.4 | 2.5 |
| Standard deviation | 2.4 | 15.1 | 4.1 |
| Median | 0.0 | 0.0 | 0.0 |
| Interquartile range | 0.0 | 1.0 | 2.5 |
| Minimum | 0.0 | 0.0 | 0.0 |
| Maximum | 26.0 | 118.0 | 15.0 |
| Value | |
|---|---|
| Statistic | 22.82 |
| Parameter | 2 |
| P statistic | 1.1e-05 |
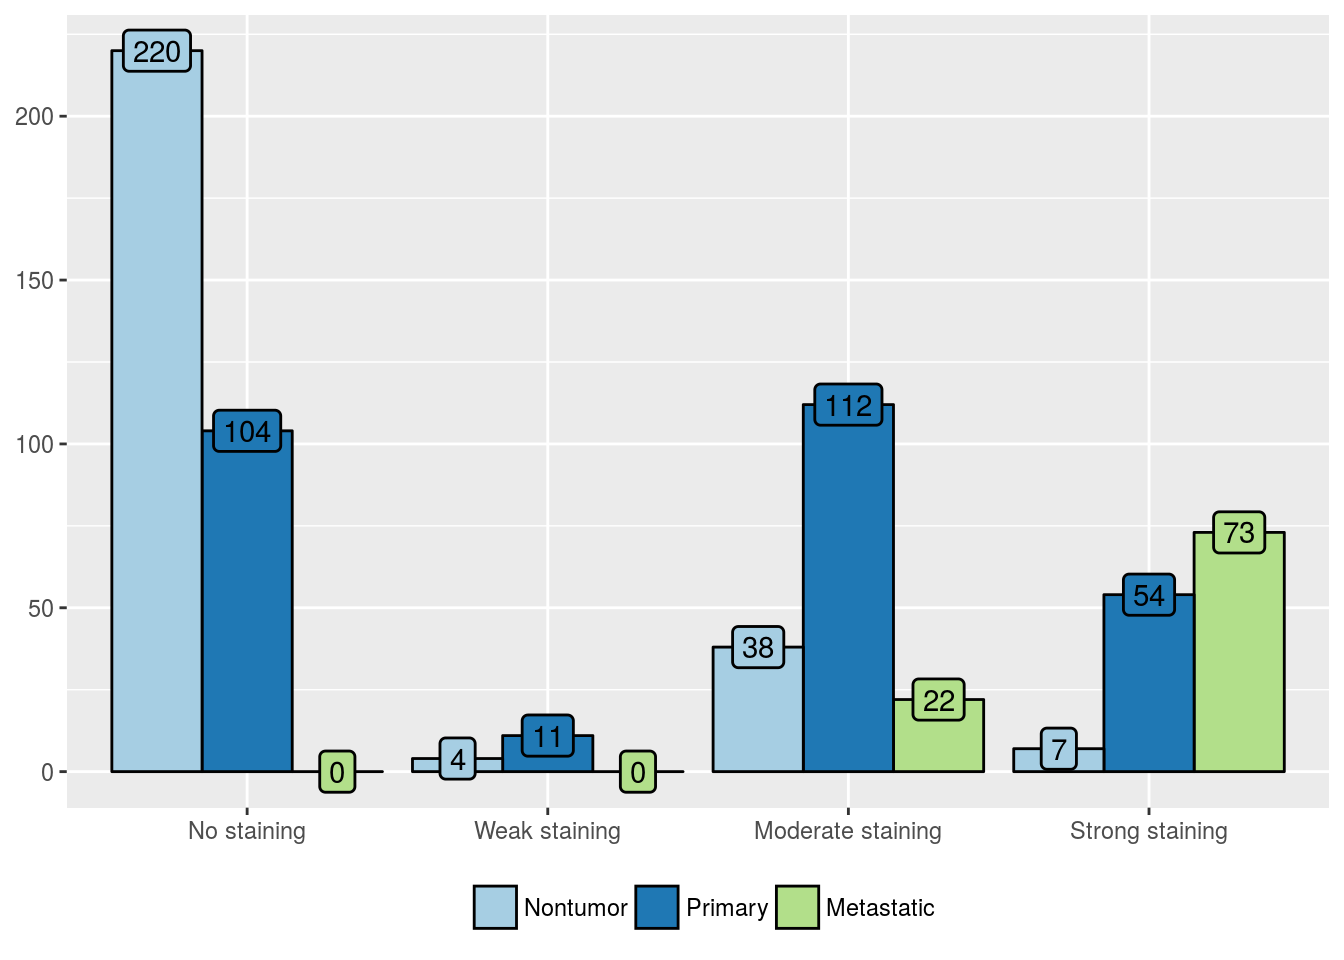
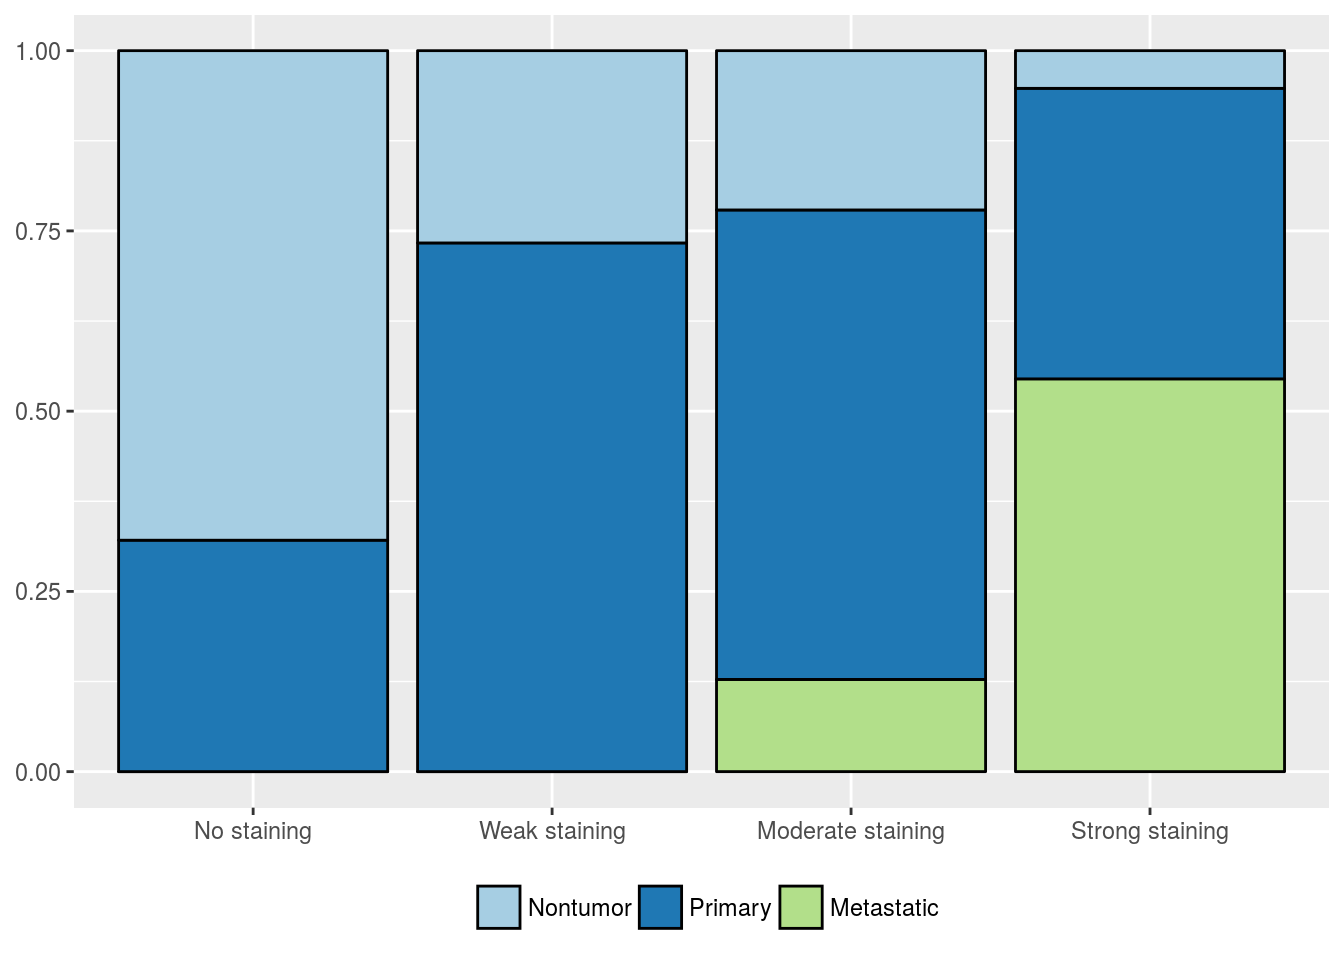
Intensity of FOXP3 positivity in intraparenchymal lymphocytes
| Nontumor (%) | Primary (%) | Metastatic (%) | |
|---|---|---|---|
| No staining | 220 (81.8) | 104 (37) | 0 (0) |
| Weak staining | 4 (1.5) | 11 (3.9) | 0 (0) |
| Moderate staining | 38 (14.1) | 112 (39.9) | 22 (23.2) |
| Strong staining | 7 (2.6) | 54 (19.2) | 73 (76.8) |
| Value | |
|---|---|
| Statistic | 338.4 |
| Parameter | 6 |
| P statistic | 4.9e-70 |
FOXP3 positivity in parenchymal cells, N
| Nontumor | Primary | Metastatic | |
|---|---|---|---|
| Mean | 0 | 0 | 0 |
| Standard deviation | 0 | 0 | 0 |
| Median | 0 | 0 | 0 |
| Interquartile range | 0 | 0 | 0 |
| Minimum | 0 | 0 | 0 |
| Maximum | 0 | 0 | 0 |
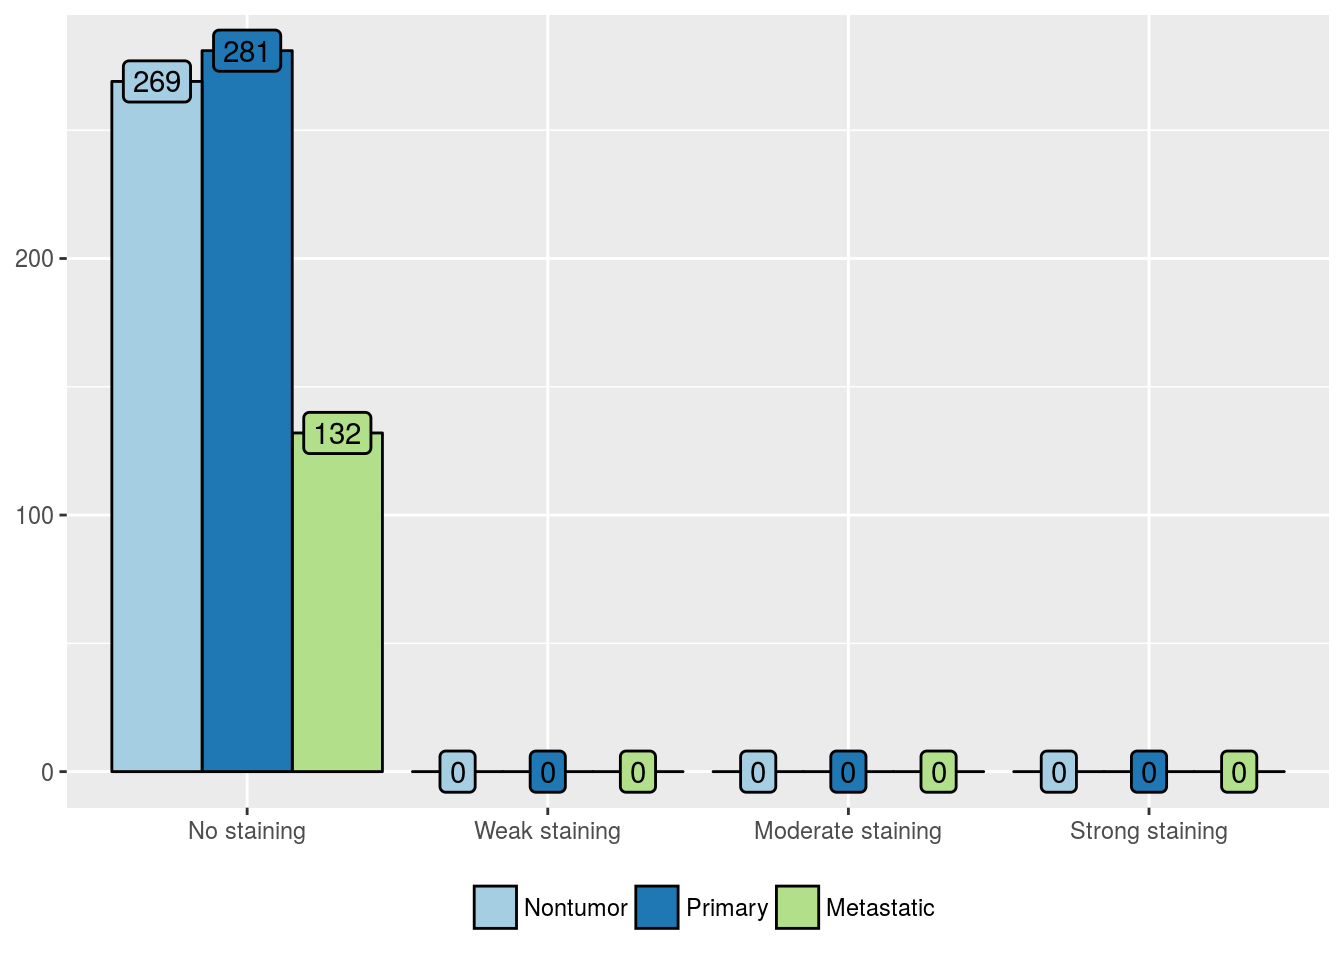
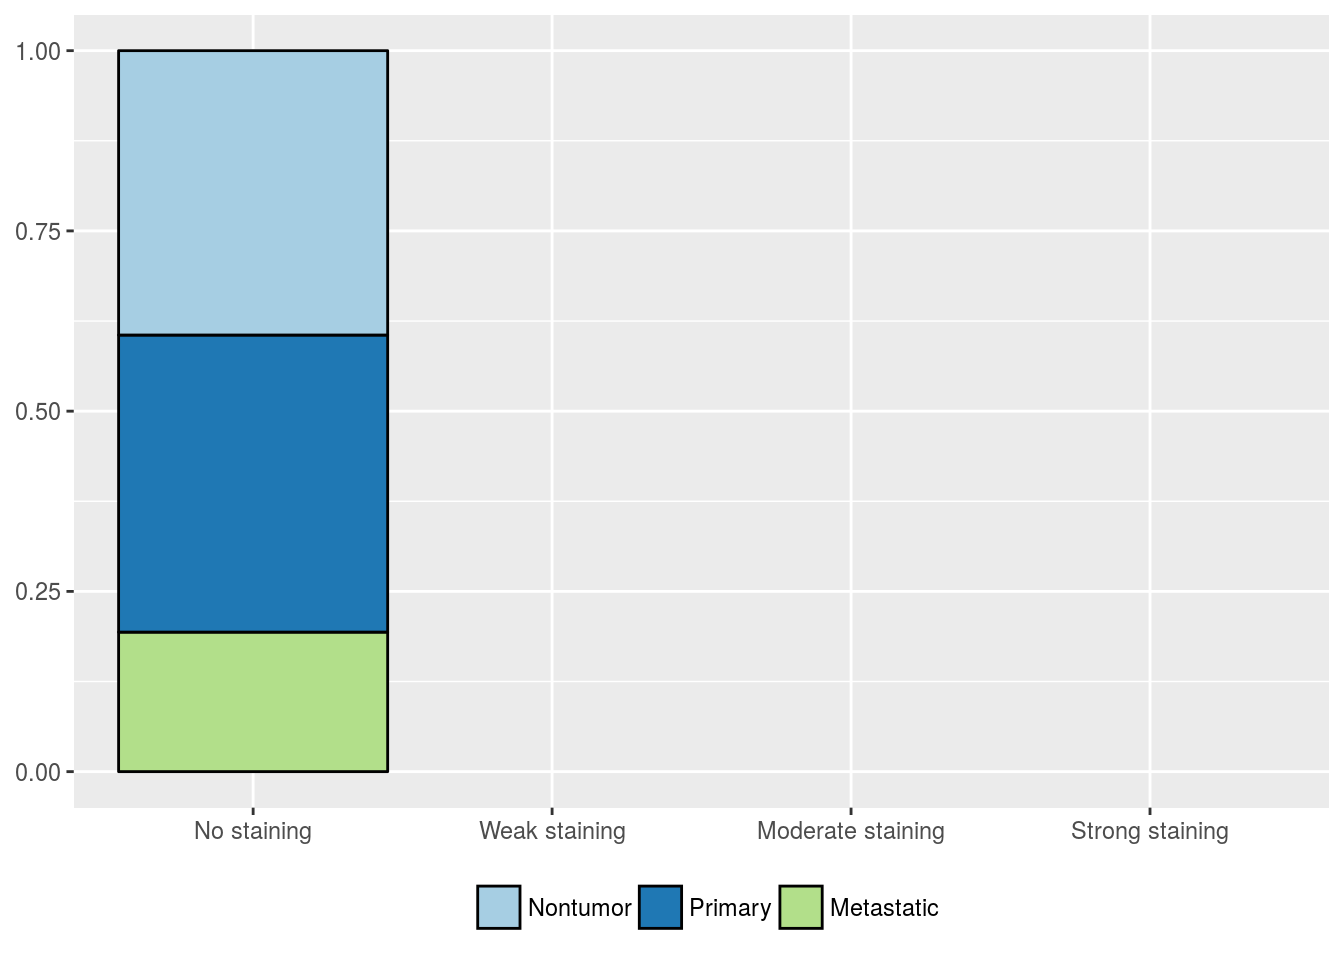
Intensity of FOXP3 positivity in parenchymal cells
| Nontumor (%) | Primary (%) | Metastatic (%) | |
|---|---|---|---|
| No staining | 269 (100) | 281 (100) | 132 (100) |
| Weak staining | 0 (0) | 0 (0) | 0 (0) |
| Moderate staining | 0 (0) | 0 (0) | 0 (0) |
| Strong staining | 0 (0) | 0 (0) | 0 (0) |
CD8 and Ki-67 expression
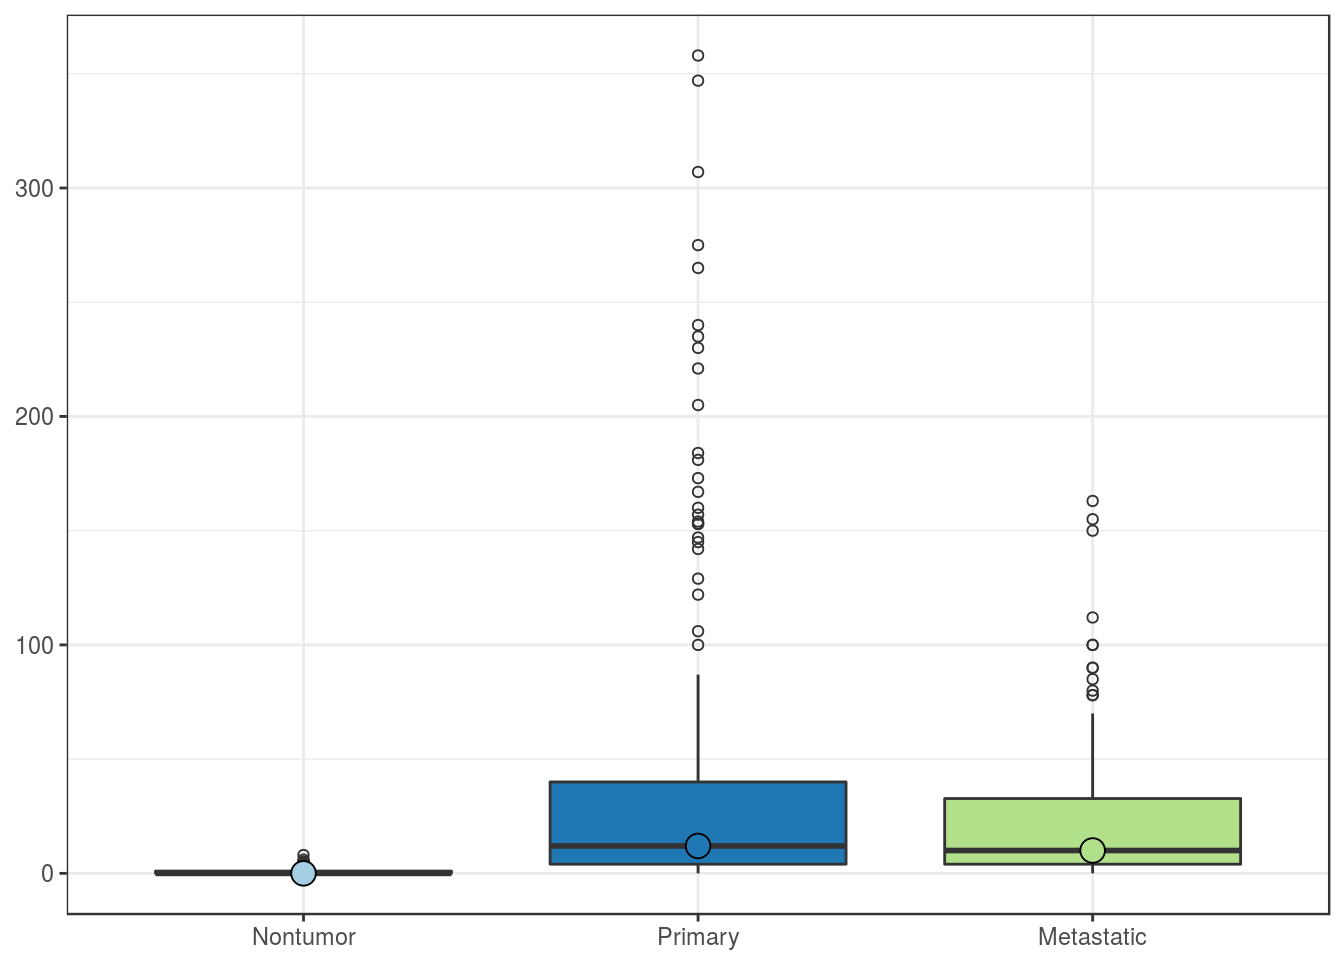
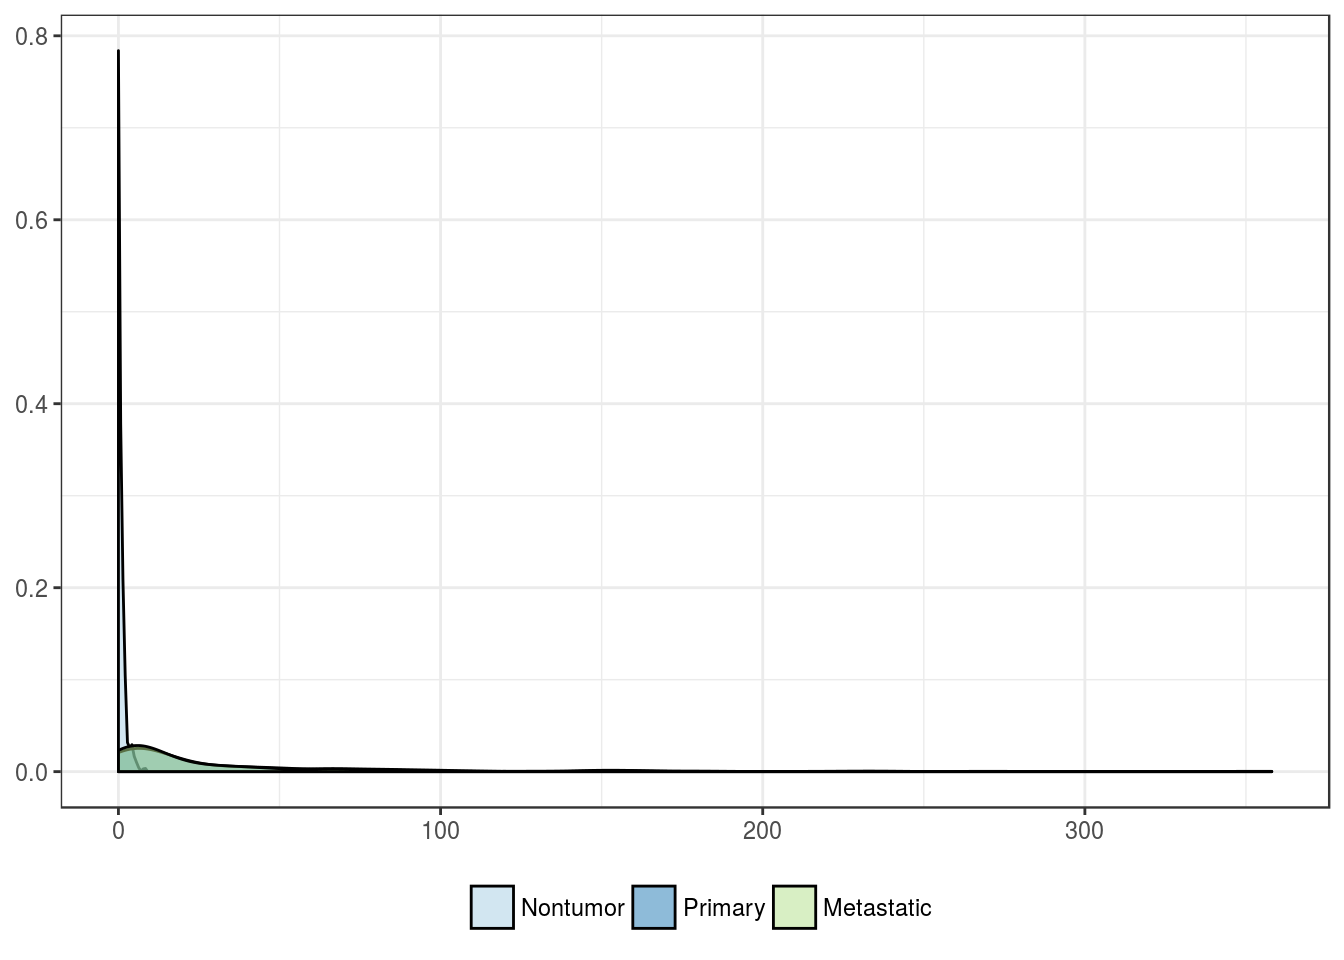
CD8 positivity in intraparenchymal lymphocytes, N
| Nontumor | Primary | Metastatic | |
|---|---|---|---|
| Mean | 0.6 | 37.1 | 25.3 |
| Standard deviation | 1.2 | 61.4 | 33.9 |
| Median | 0.0 | 12.0 | 10.0 |
| Interquartile range | 1.0 | 36.0 | 28.8 |
| Minimum | 0.0 | 0.0 | 0.0 |
| Maximum | 8.0 | 358.0 | 163.0 |
| Value | |
|---|---|
| Statistic | 330.4 |
| Parameter | 2 |
| P statistic | 1.8e-72 |
CD8 and Ki67 positivity in intraparenchymal lymphocytes, N
| Nontumor | Primary | Metastatic | |
|---|---|---|---|
| Mean | 0 | 1.4 | 0.5 |
| Standard deviation | 0 | 4.1 | 1.3 |
| Median | 0 | 0.0 | 0.0 |
| Interquartile range | 0 | 1.0 | 0.0 |
| Minimum | 0 | 0.0 | 0.0 |
| Maximum | 0 | 30.0 | 7.0 |
| Value | |
|---|---|
| Statistic | 82.42 |
| Parameter | 2 |
| P statistic | 1.3e-18 |
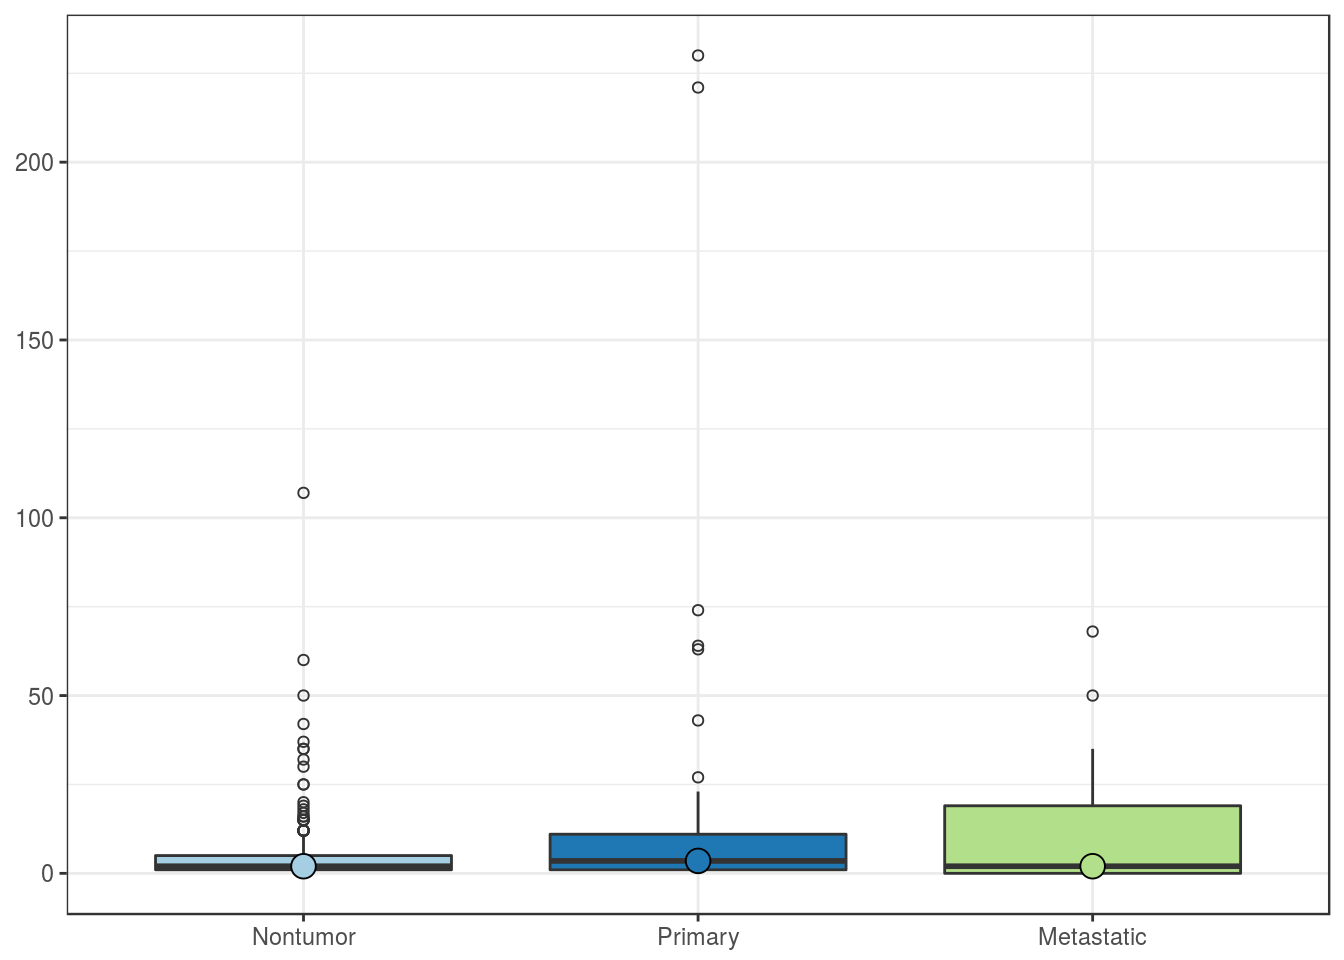
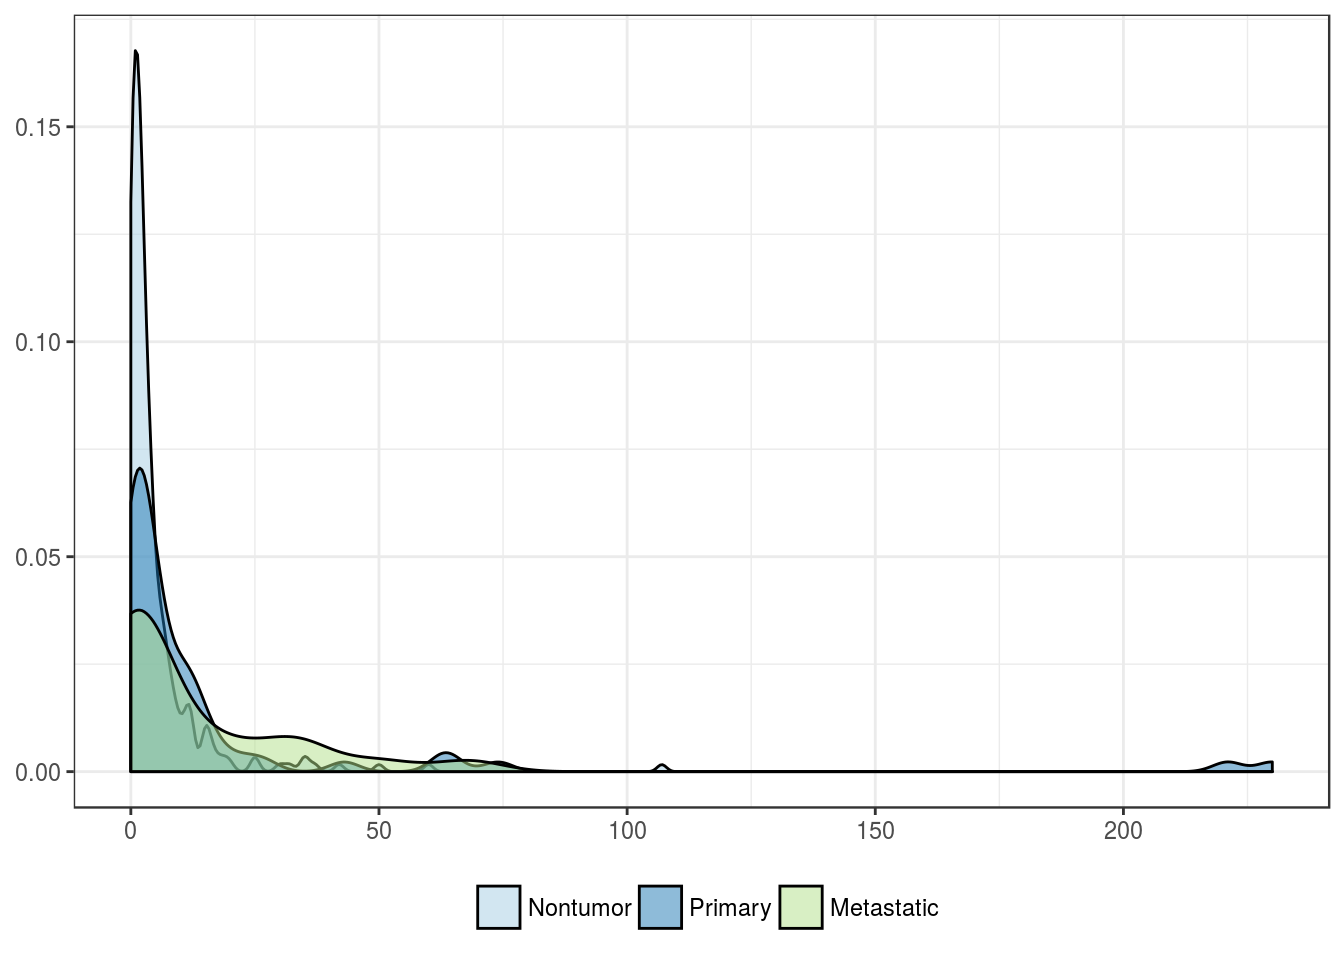
CD8 positivity in stromal lymphocytes, N
| Nontumor | Primary | Metastatic | |
|---|---|---|---|
| Mean | 5.2 | 16.5 | 12.5 |
| Standard deviation | 10.1 | 42.1 | 18.8 |
| Median | 2.0 | 3.5 | 2.0 |
| Interquartile range | 4.0 | 10.0 | 19.0 |
| Minimum | 0.0 | 0.0 | 0.0 |
| Maximum | 107.0 | 230.0 | 68.0 |
| Value | |
|---|---|
| Statistic | 4.235 |
| Parameter | 2 |
| P statistic | 0.12 |
CD8 and Ki67 positivity in stromal lymphocytes, N
| Nontumor | Primary | Metastatic | |
|---|---|---|---|
| Mean | 0 | 0.0 | 0.1 |
| Standard deviation | 0 | 0.2 | 0.5 |
| Median | 0 | 0.0 | 0.0 |
| Interquartile range | 0 | 0.0 | 0.0 |
| Minimum | 0 | 0.0 | 0.0 |
| Maximum | 0 | 1.0 | 2.0 |
| Value | |
|---|---|
| Statistic | 16.83 |
| Parameter | 2 |
| P statistic | 0.00022 |
Ki67 positivity in intraparenchymal lymphocytes, %
| Nontumor | Primary | Metastatic | |
|---|---|---|---|
| Mean | 0 | 2.8 | 3.3 |
| Standard deviation | 0 | 3.9 | 3.7 |
| Median | 0 | 1.0 | 2.0 |
| Interquartile range | 0 | 2.0 | 2.5 |
| Minimum | 0 | 0.0 | 1.0 |
| Maximum | 0 | 20.0 | 15.0 |
| Value | |
|---|---|
| Statistic | 12.05 |
| Parameter | 2 |
| P statistic | 0.0024 |