CD8 and Ki67 expression in primary tumors
CD8 positivity in intratumoral lymphocytes
Clinical features
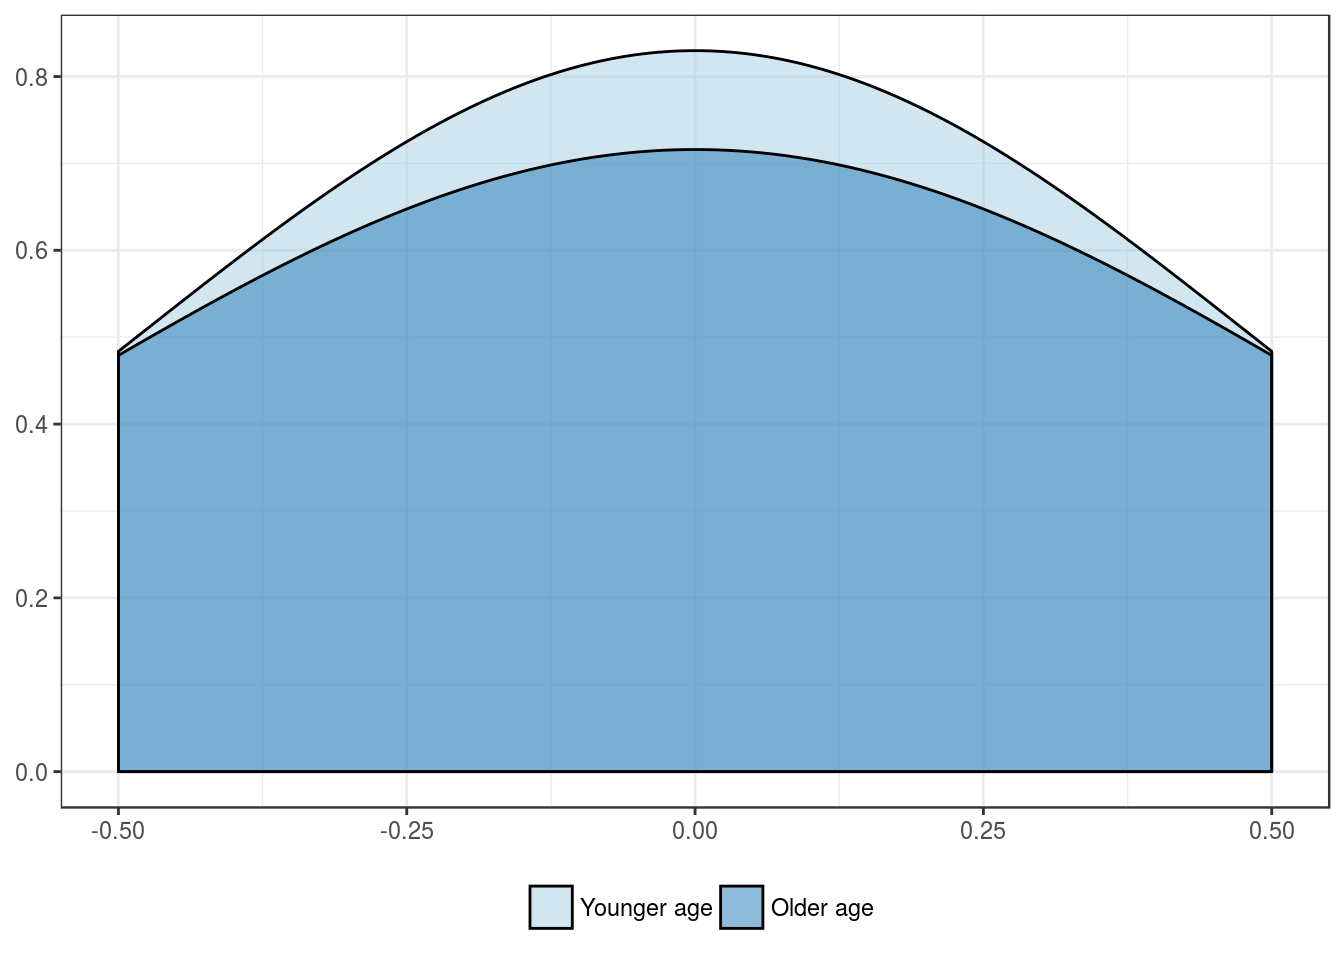
Patients’ age group, in years
| Younger age | Older age | |
|---|---|---|
| Mean | 30.8 | 36.1 |
| Standard deviation | 51.8 | 57.4 |
| Median | 14.5 | 10.2 |
| Interquartile range | 24.2 | 38.8 |
| Minimum | 0.0 | 0.0 |
| Maximum | 291.0 | 243.0 |
| Value | |
|---|---|
| U-statistic | 624 |
| P statistic | 6.7e-01 |

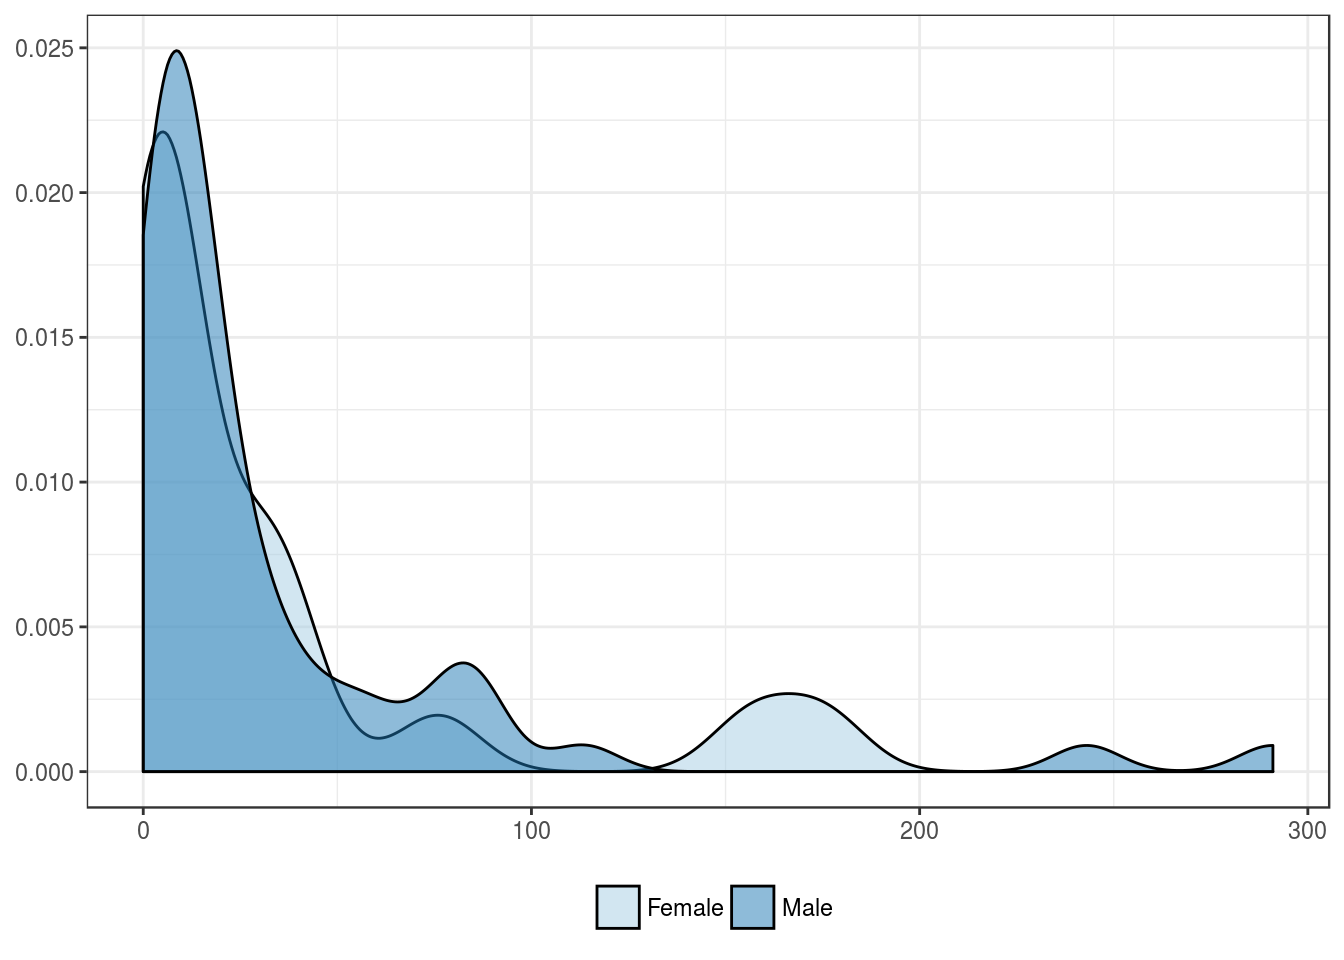
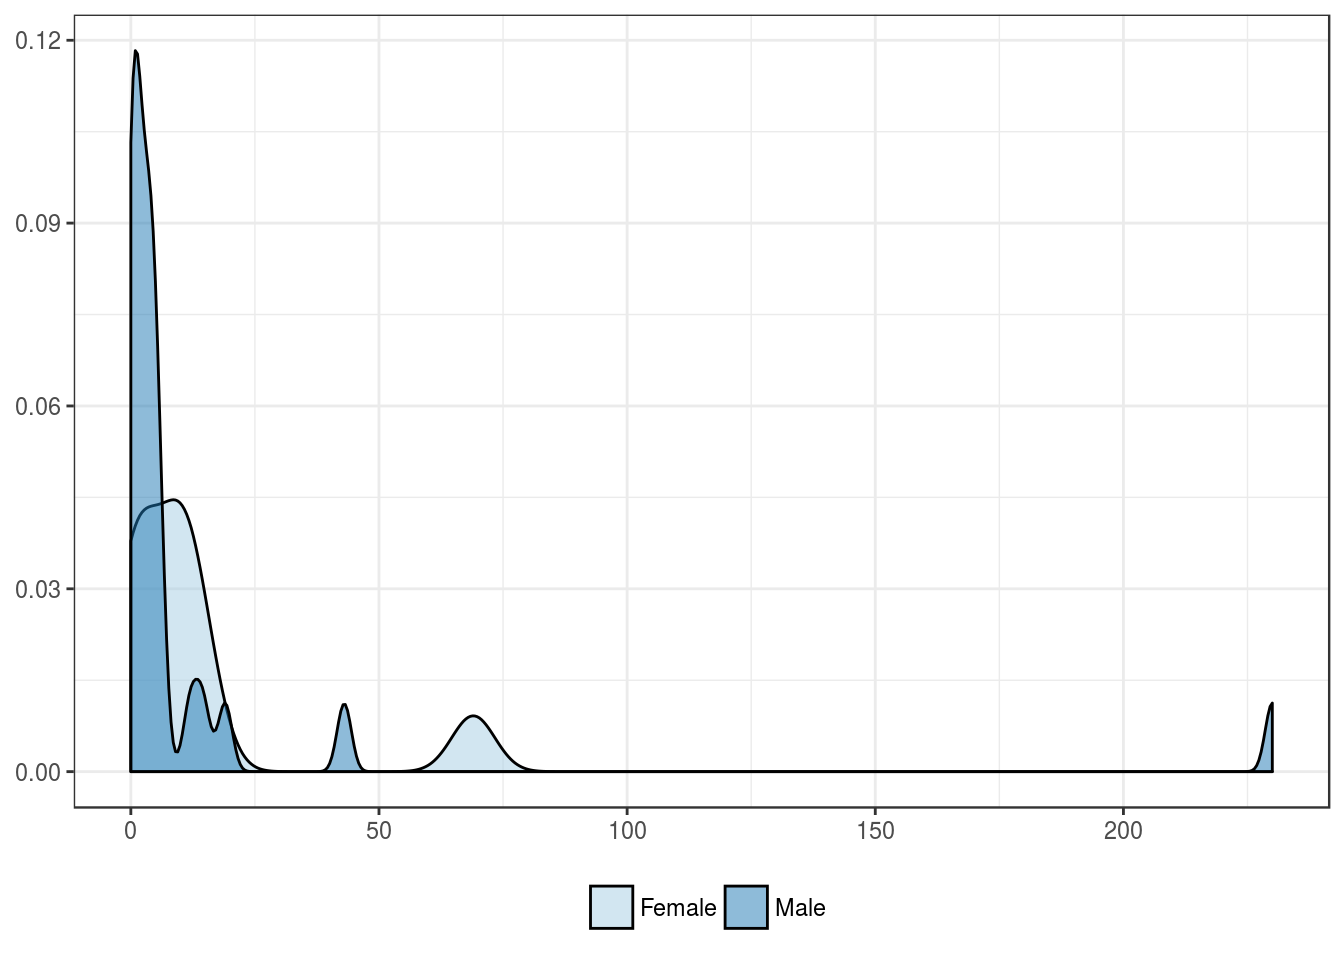
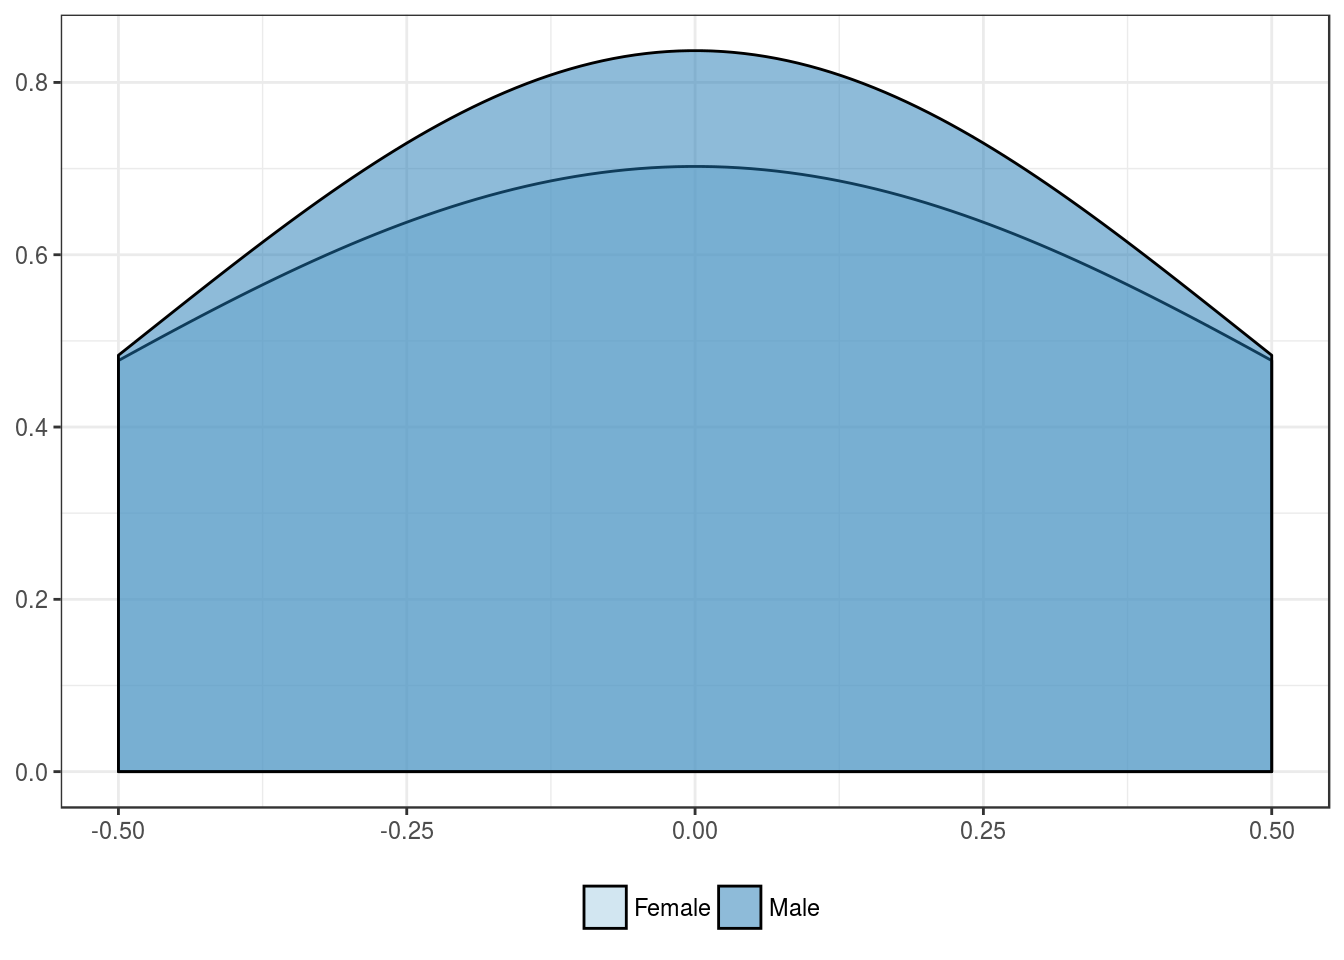
Patients’ sex
| Female | Male | |
|---|---|---|
| Mean | 31.7 | 33.4 |
| Standard deviation | 51.2 | 55.1 |
| Median | 7.0 | 14.0 |
| Interquartile range | 29.0 | 28.2 |
| Minimum | 0.0 | 0.0 |
| Maximum | 175.5 | 291.0 |
| Value | |
|---|---|
| U-statistic | 430 |
| P statistic | 4.7e-01 |
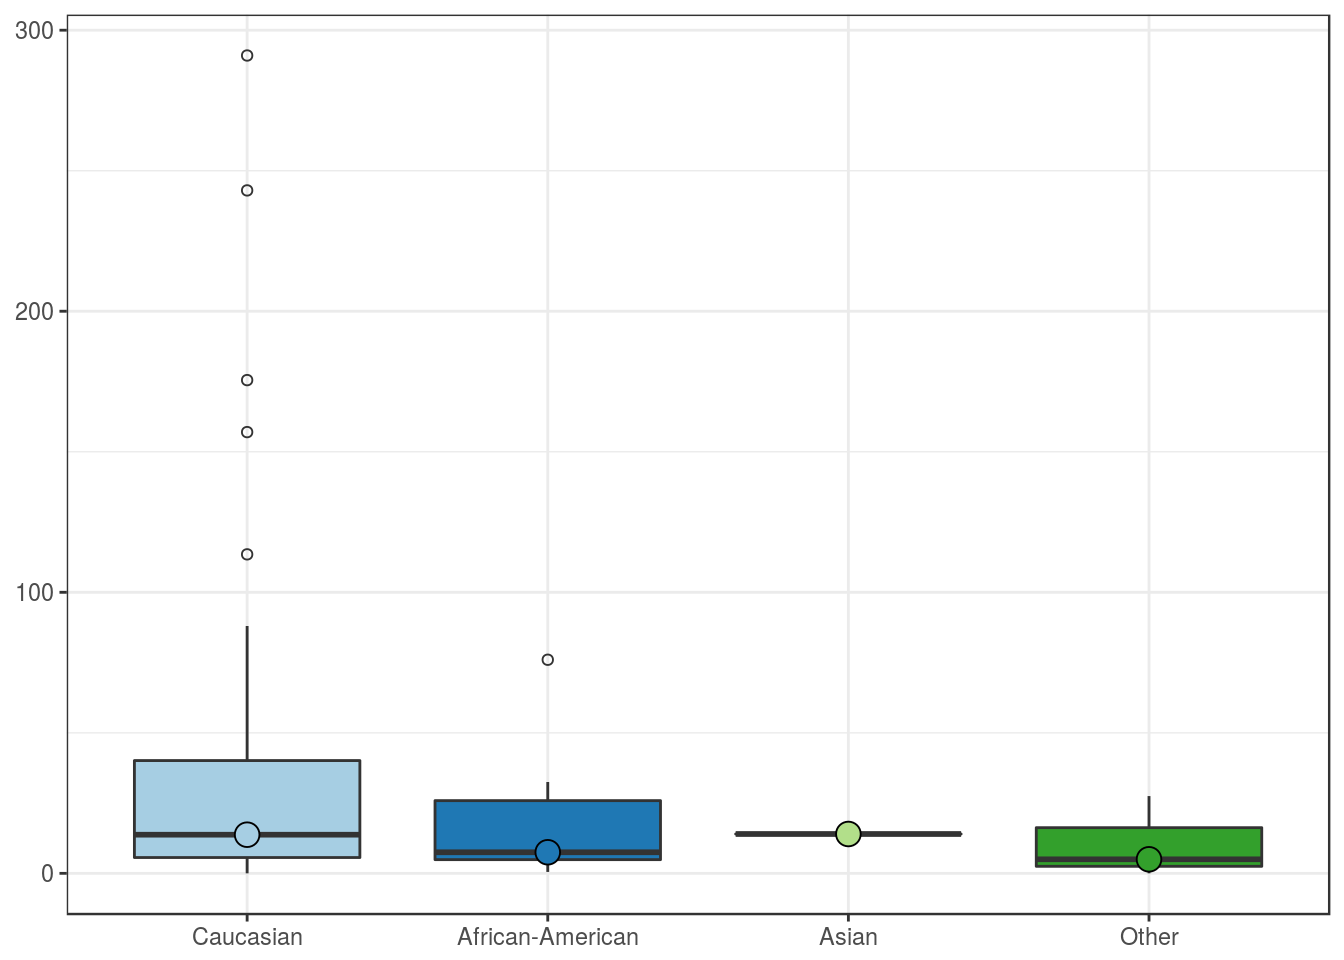
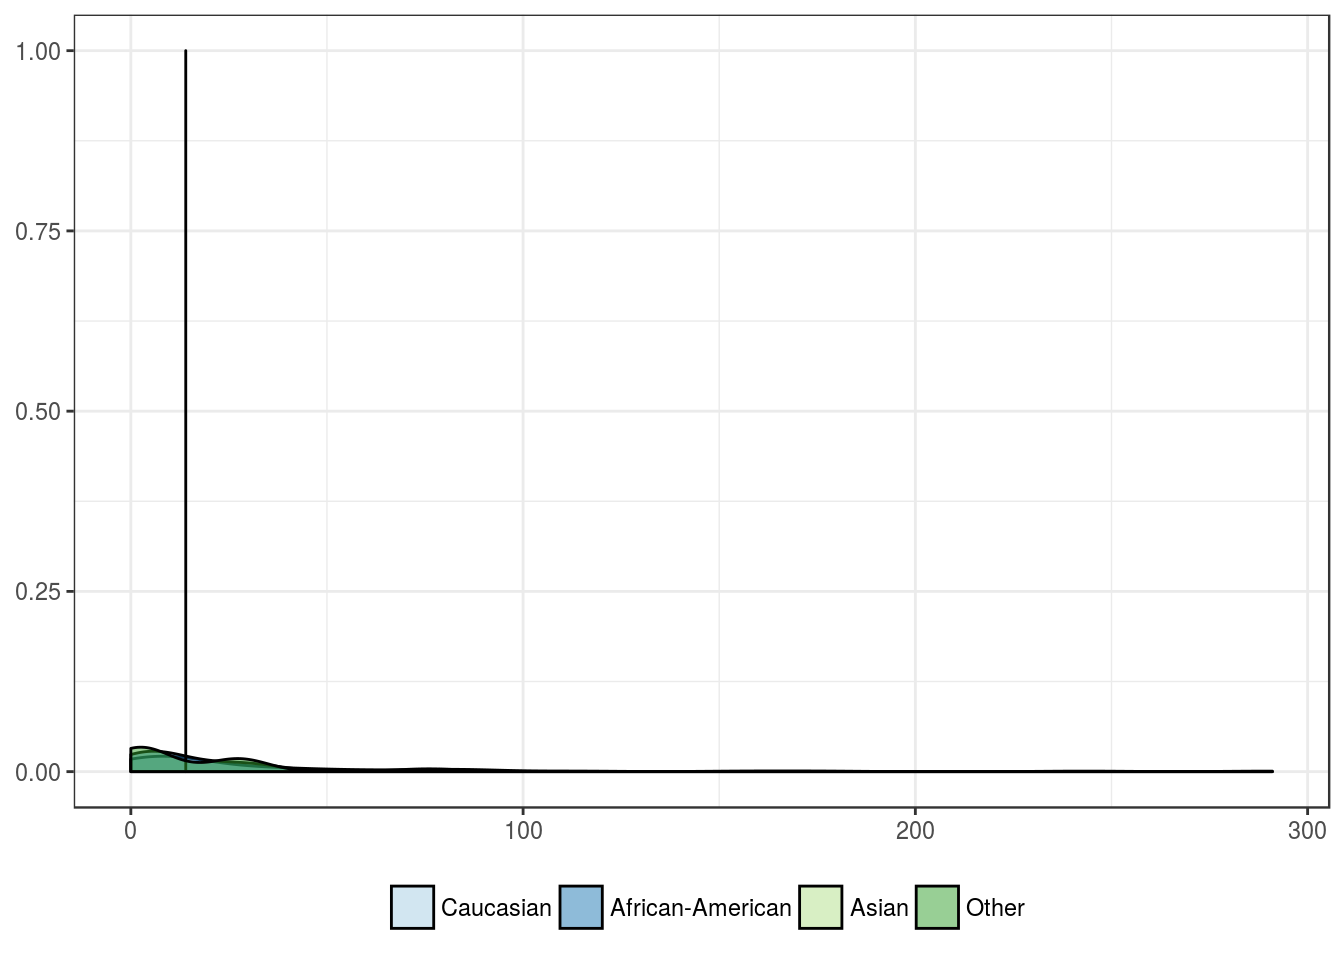
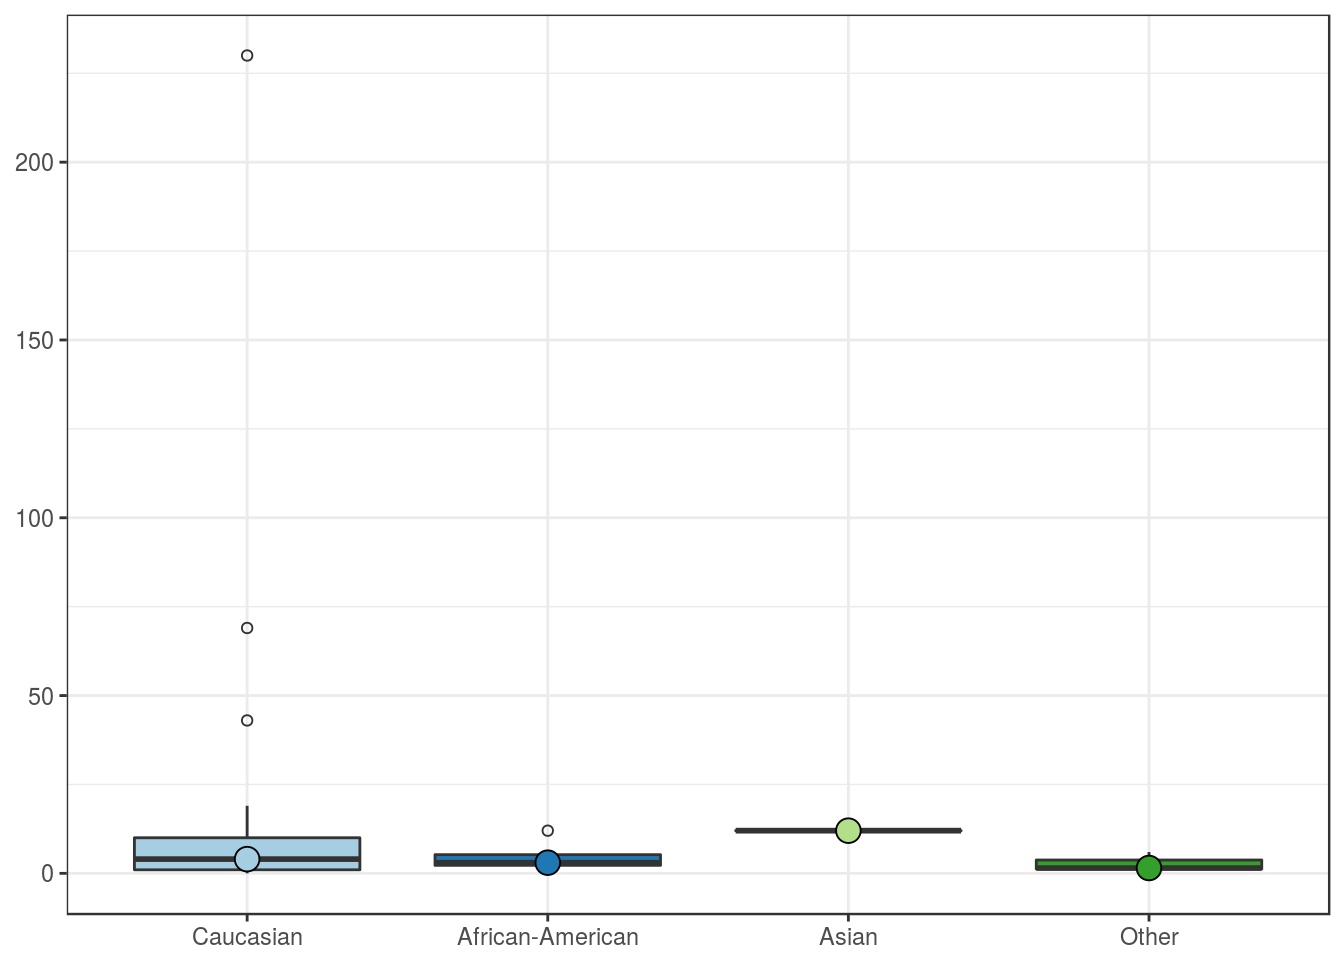
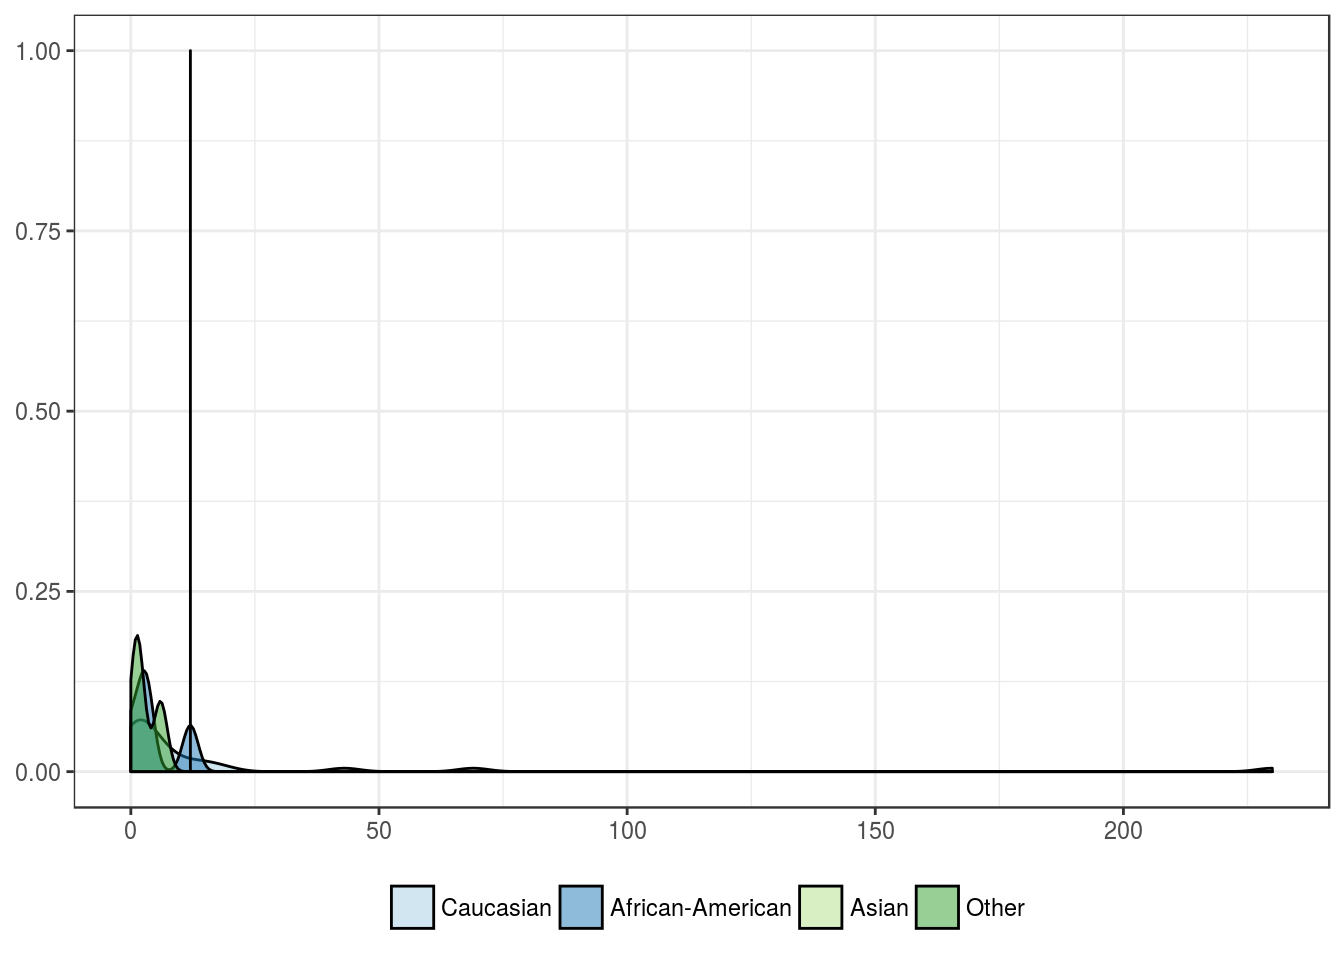
Patients’ race
| Caucasian | African-American | Asian | Other | |
|---|---|---|---|---|
| Mean | 37.9 | 17.5 | 14 | 10.8 |
| Standard deviation | 59.5 | 21.5 | NA | 14.6 |
| Median | 13.8 | 7.5 | 14 | 5.0 |
| Interquartile range | 34.5 | 21.0 | 0 | 13.8 |
| Minimum | 0.0 | 0.5 | 14 | 0.0 |
| Maximum | 291.0 | 76.0 | 14 | 27.5 |
| Value | |
|---|---|
| Statistic | 2.152 |
| Parameter | 3 |
| P statistic | 0.54 |
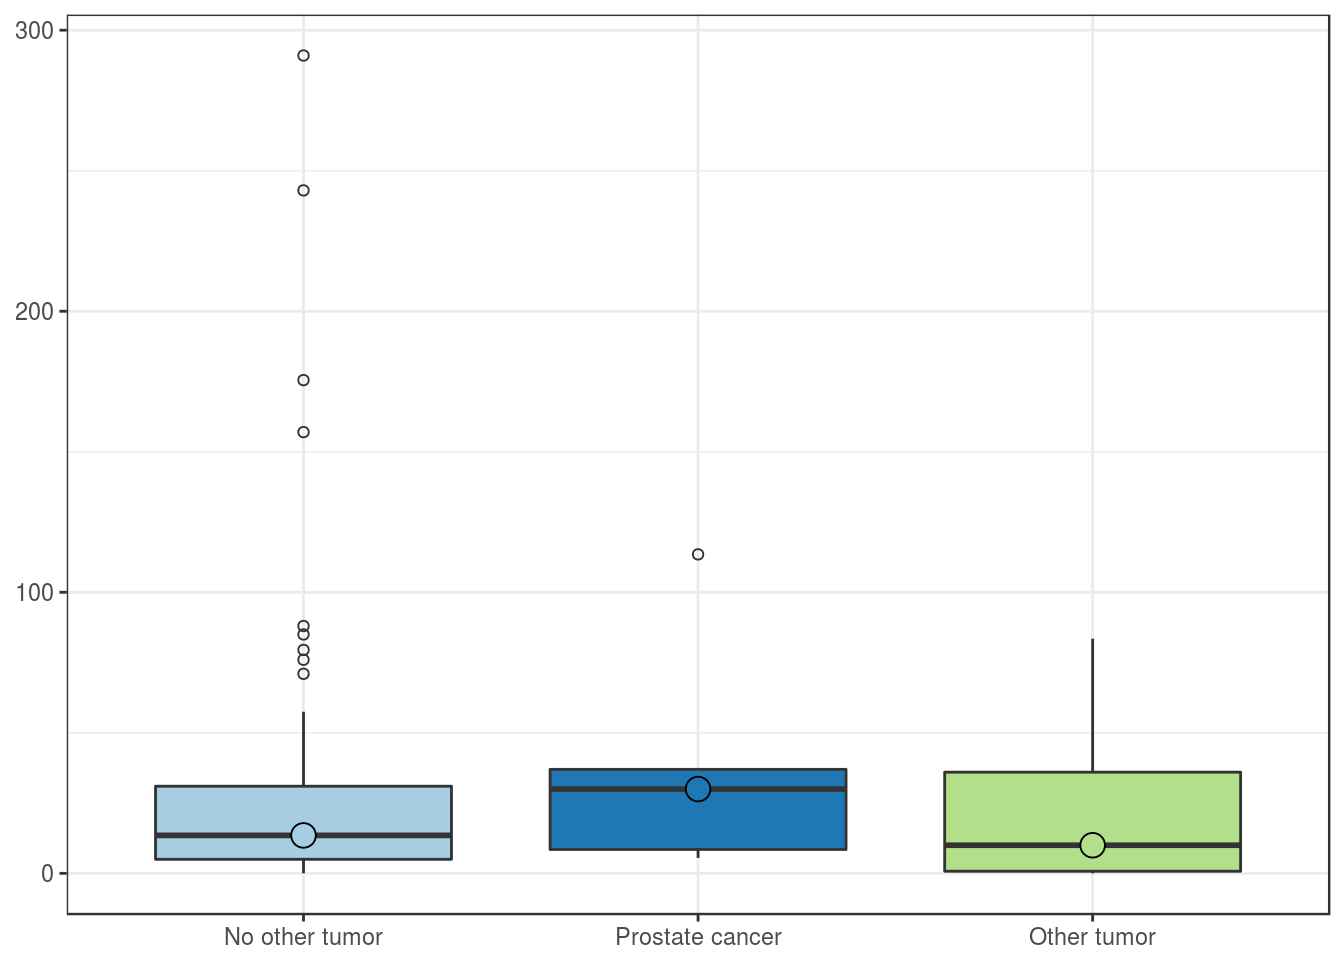
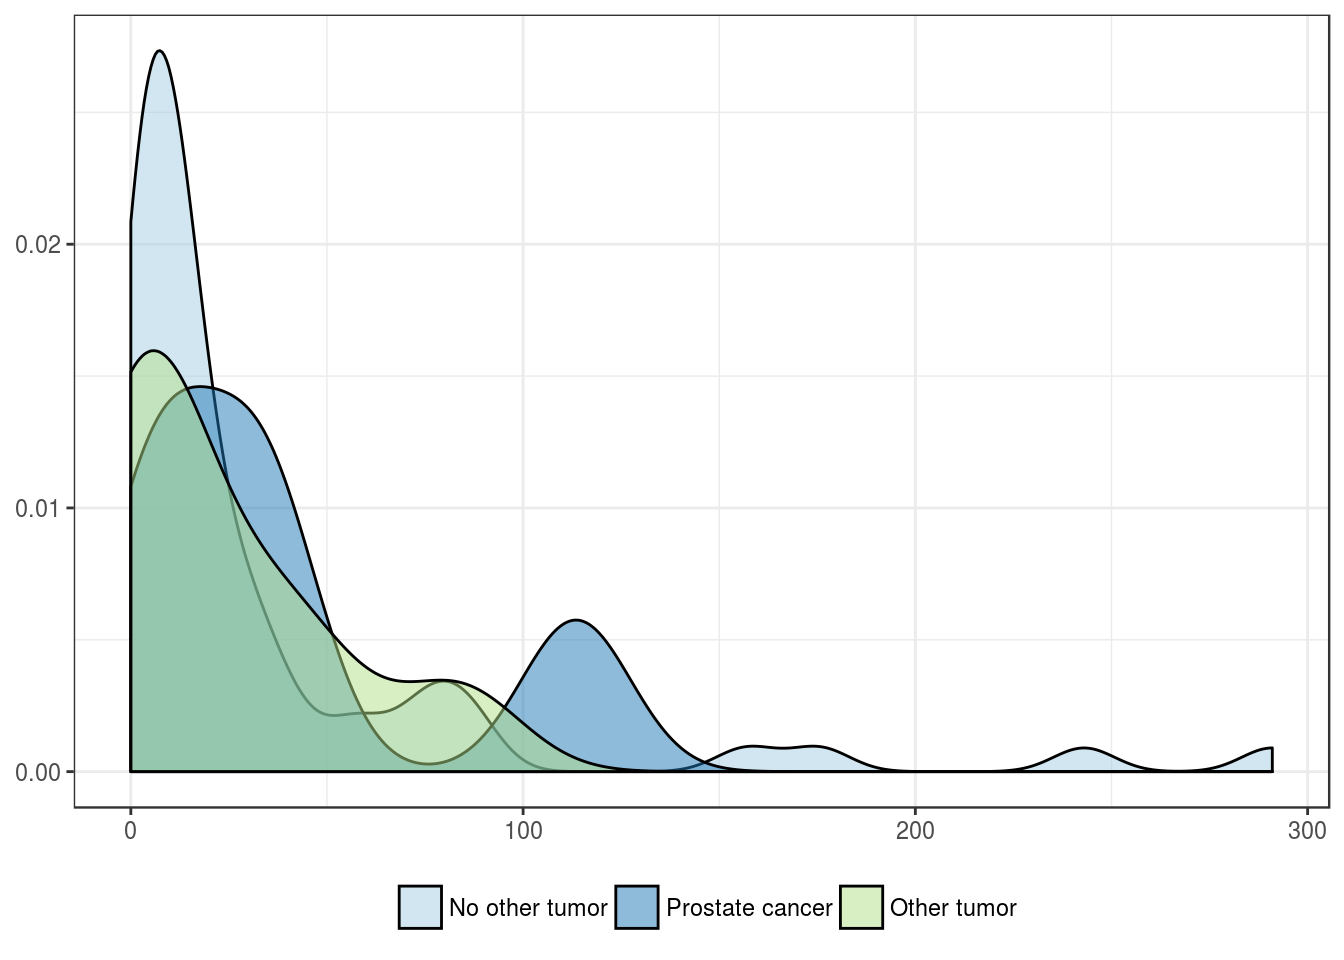
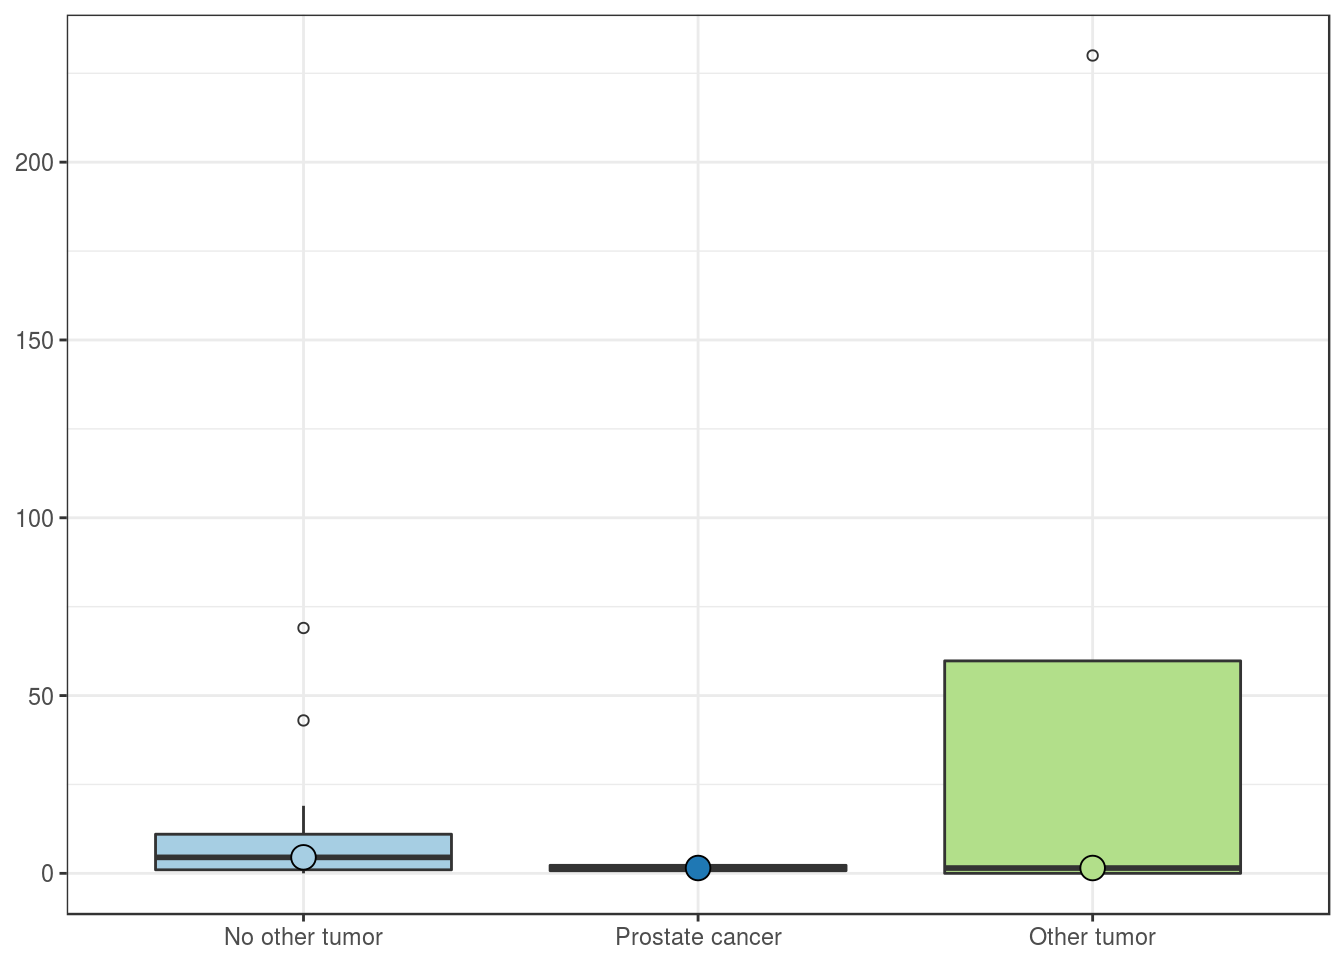
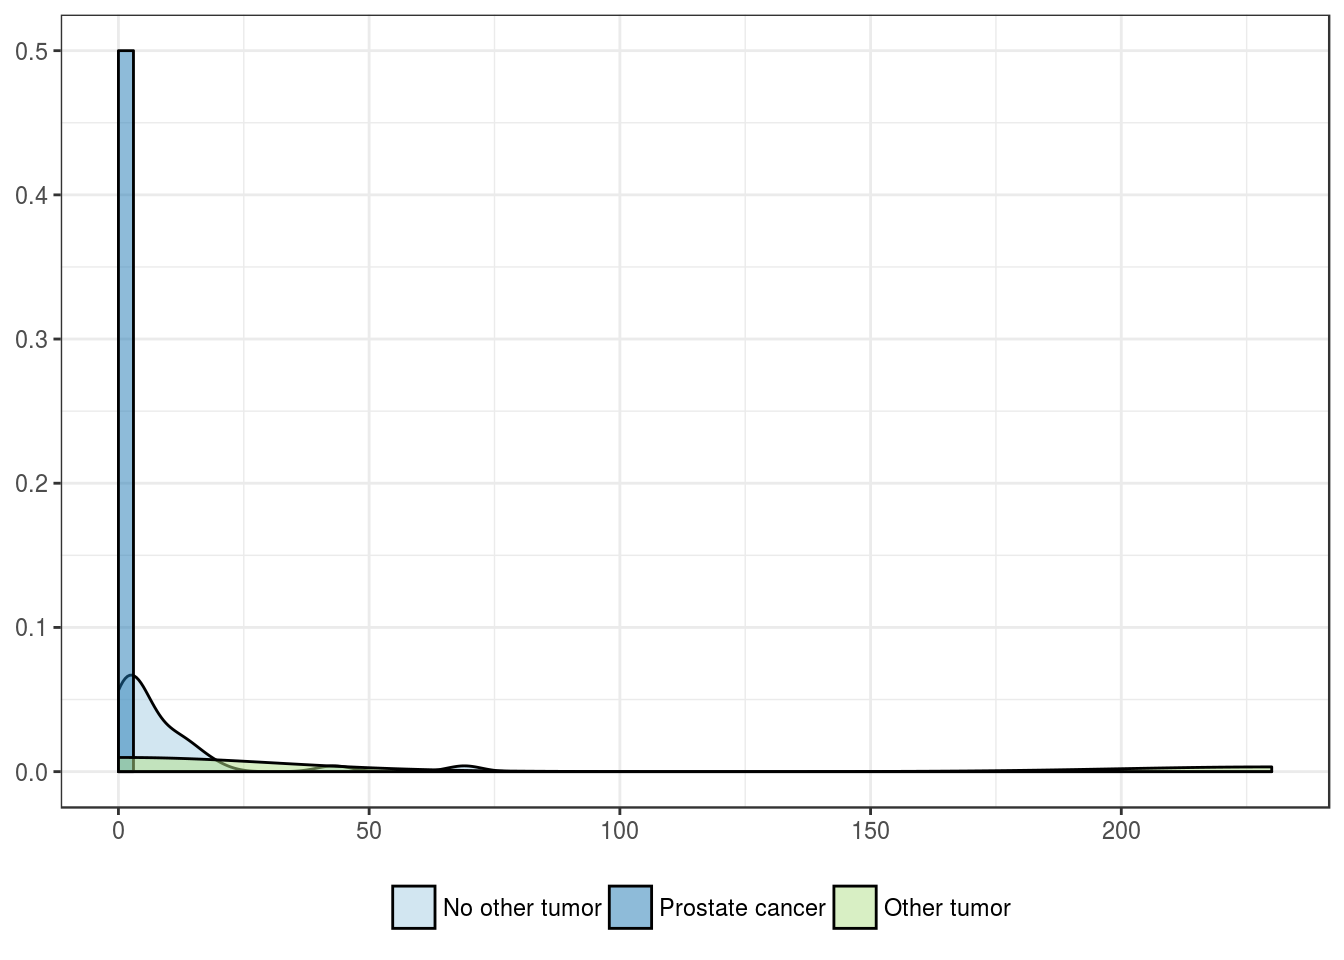
History of other malignancies
| No other tumor | Prostate cancer | Other tumor | |
|---|---|---|---|
| Mean | 33.8 | 38.9 | 22.9 |
| Standard deviation | 57.4 | 43.8 | 29.7 |
| Median | 13.5 | 30.0 | 10.0 |
| Interquartile range | 26.0 | 28.5 | 35.2 |
| Minimum | 0.0 | 5.5 | 0.0 |
| Maximum | 291.0 | 113.5 | 83.5 |
| Value | |
|---|---|
| Statistic | 1.289 |
| Parameter | 2 |
| P statistic | 0.52 |
Pathologic features
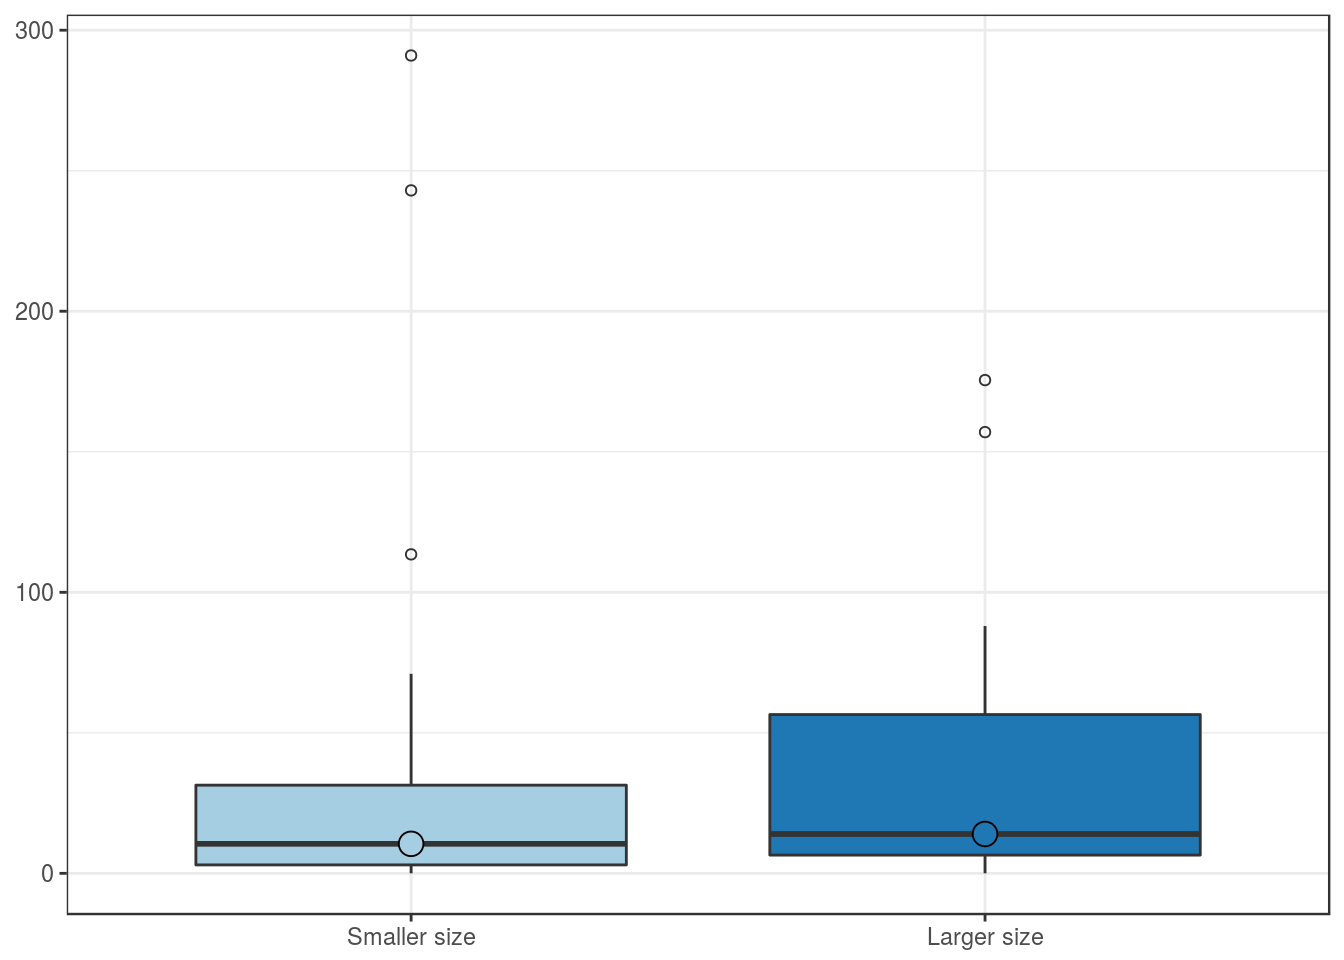
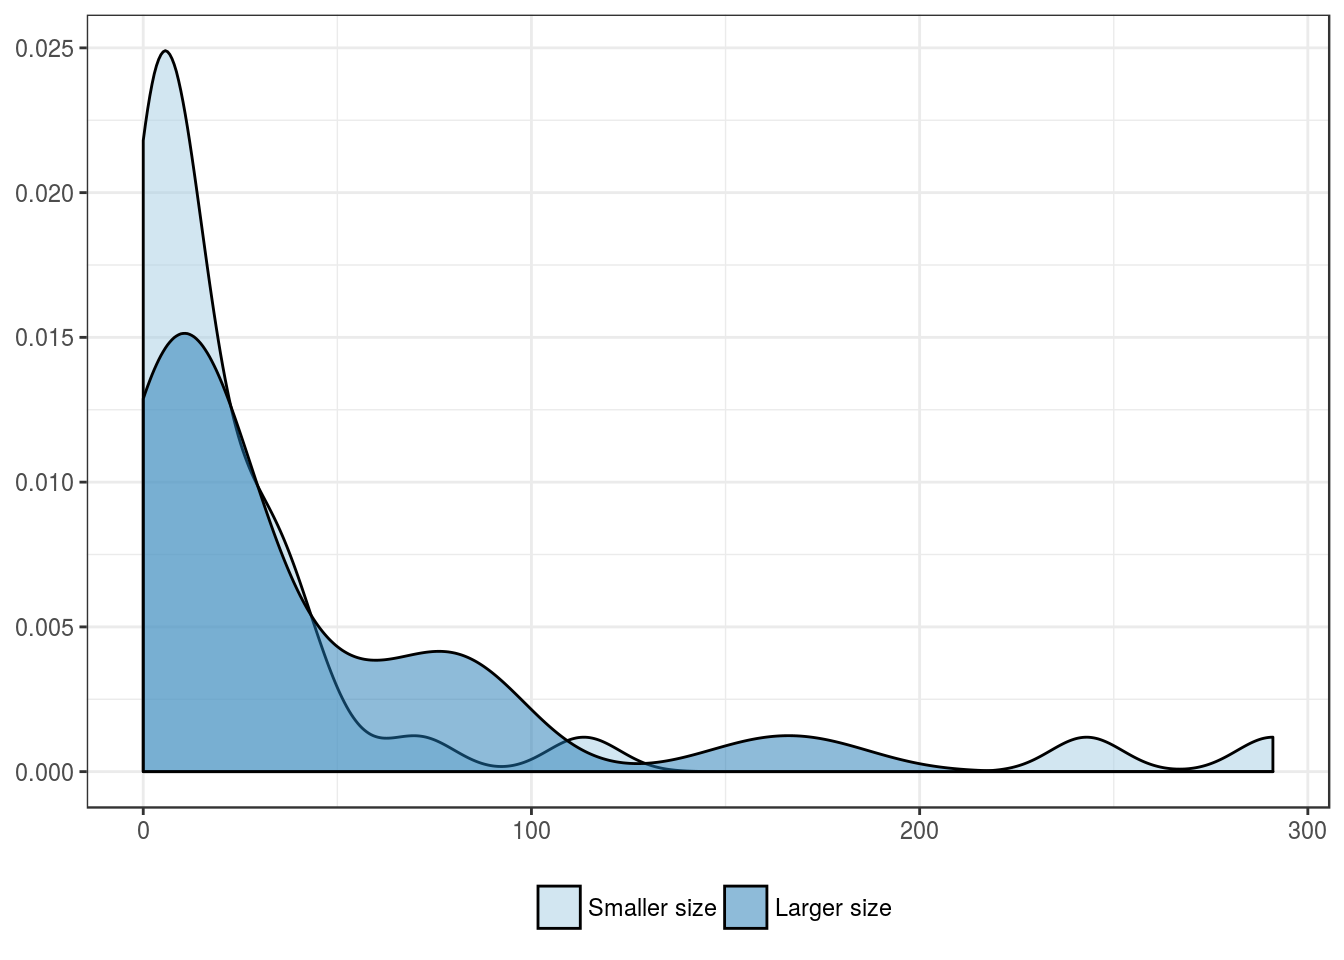
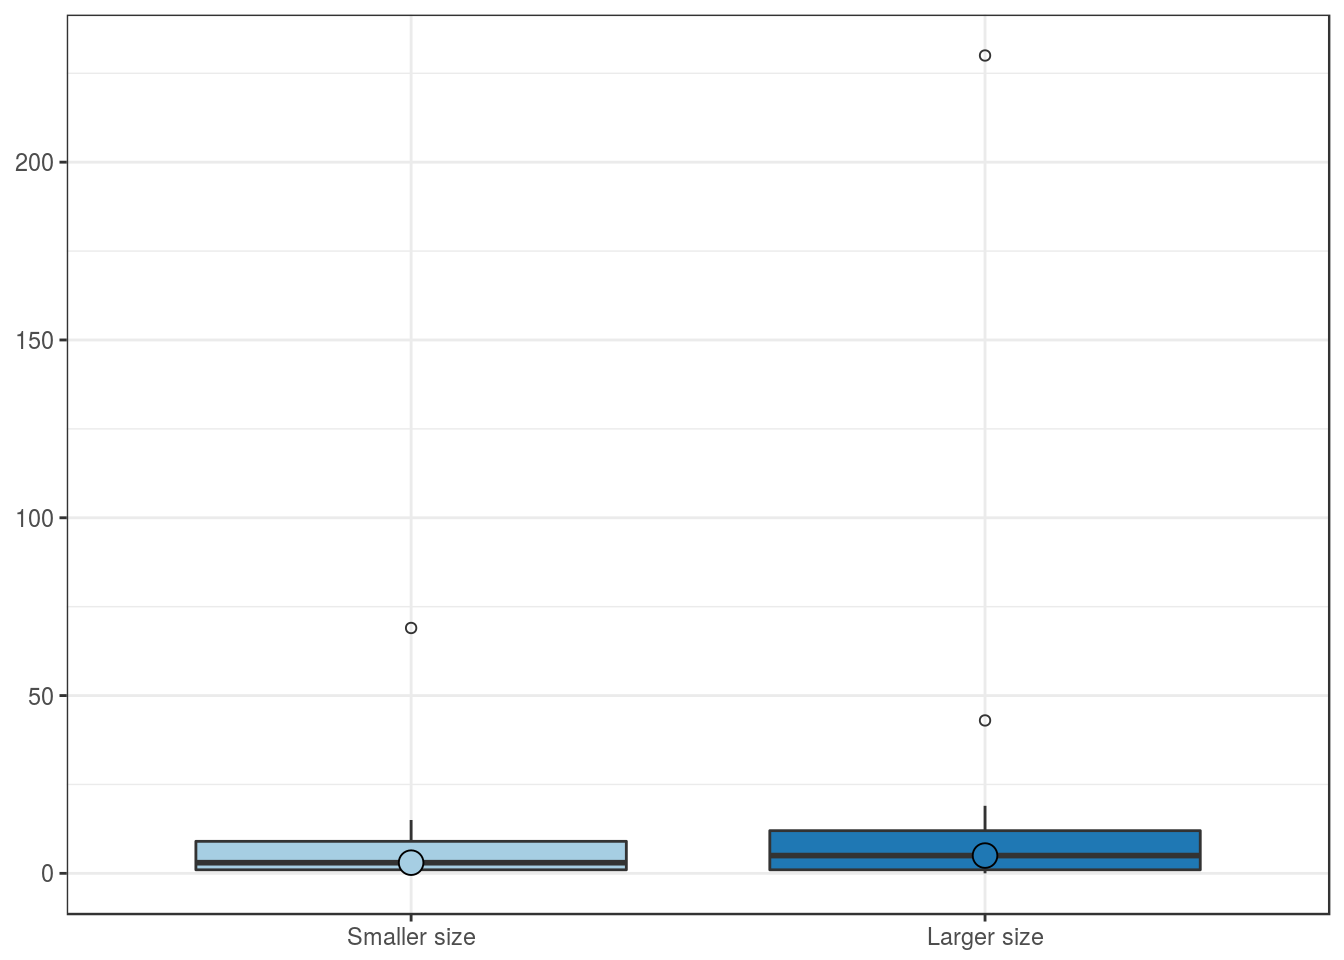
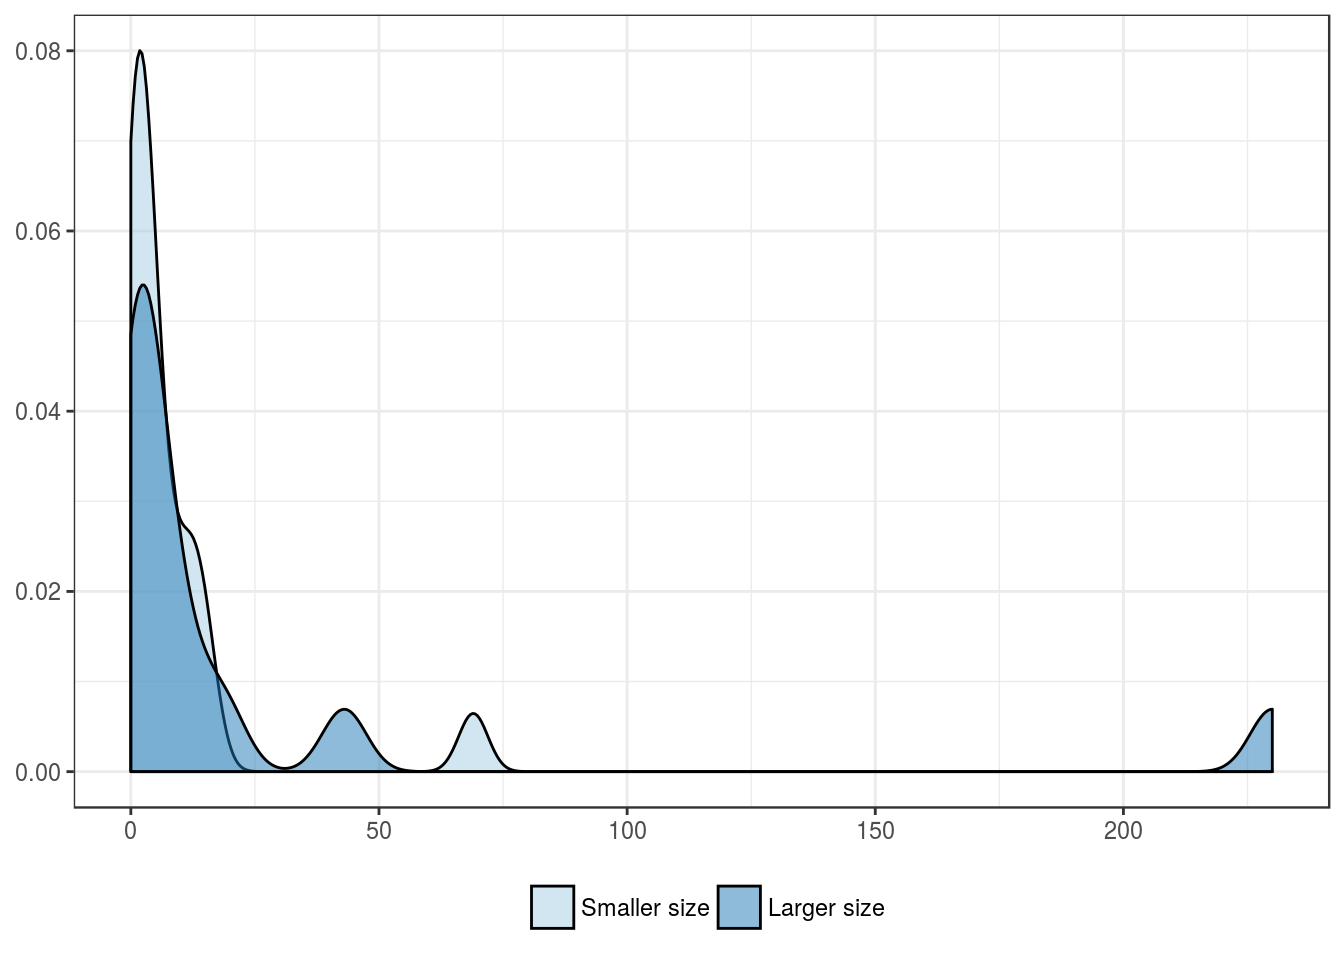
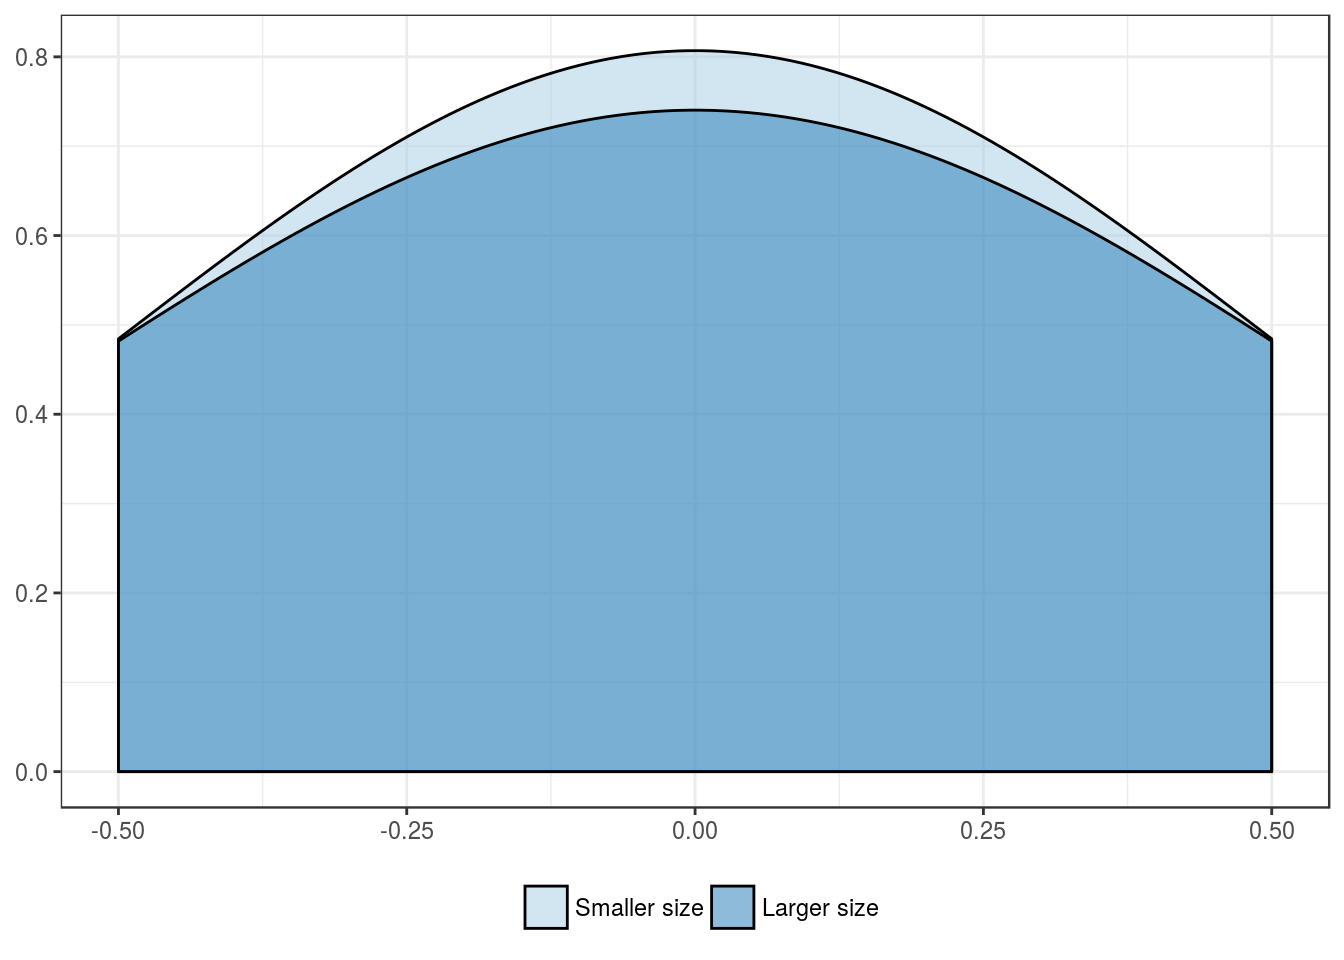
Tumor size group
| Smaller size | Larger size | |
|---|---|---|
| Mean | 31.5 | 35.0 |
| Standard deviation | 62.6 | 43.9 |
| Median | 10.5 | 14.0 |
| Interquartile range | 28.4 | 50.0 |
| Minimum | 0.0 | 0.0 |
| Maximum | 291.0 | 175.5 |
| Value | |
|---|---|
| U-statistic | 472 |
| P statistic | 1.4e-01 |
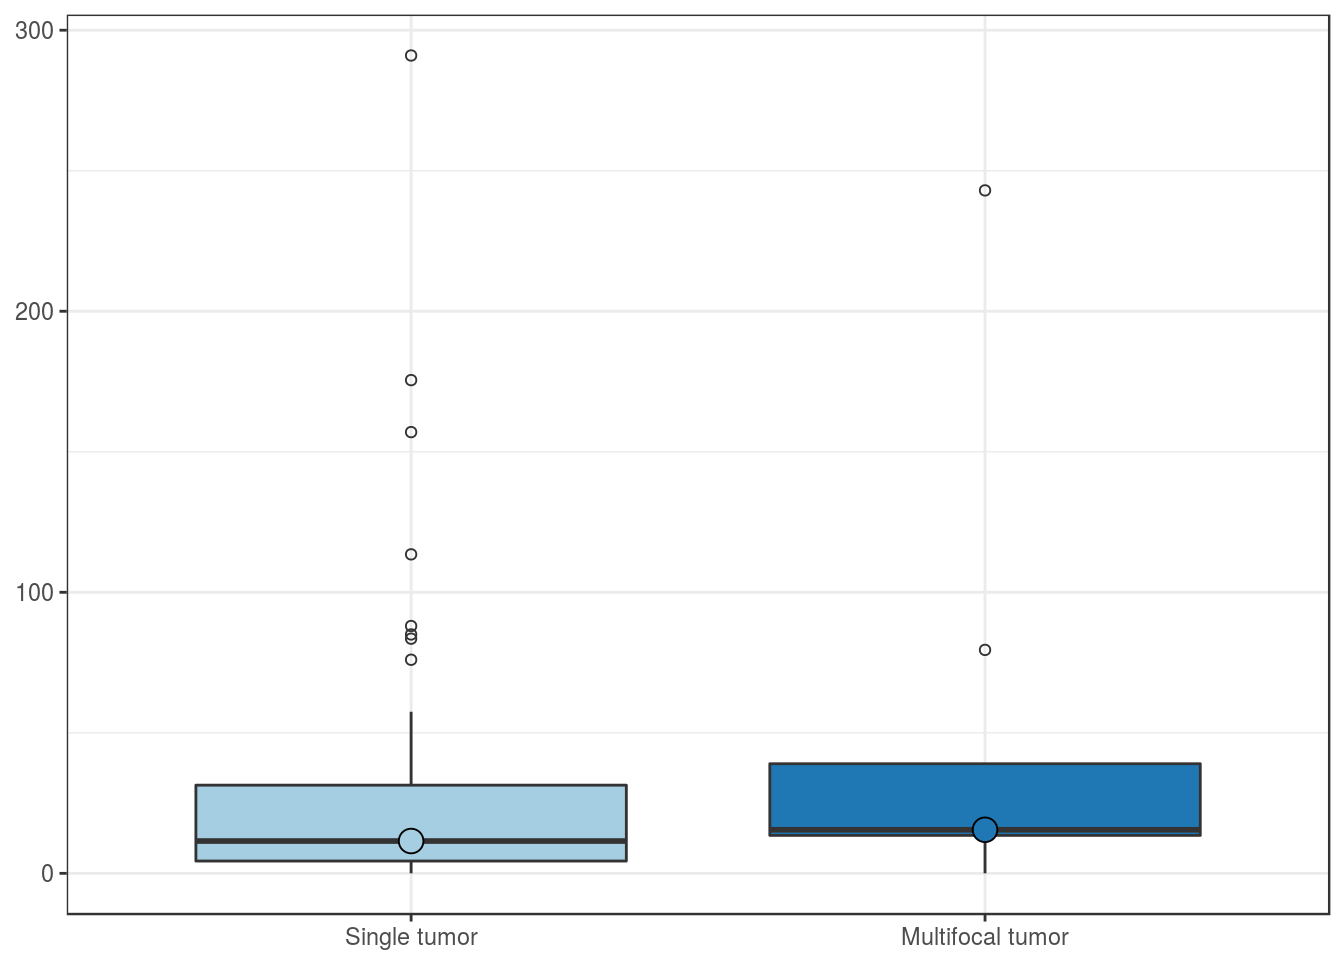
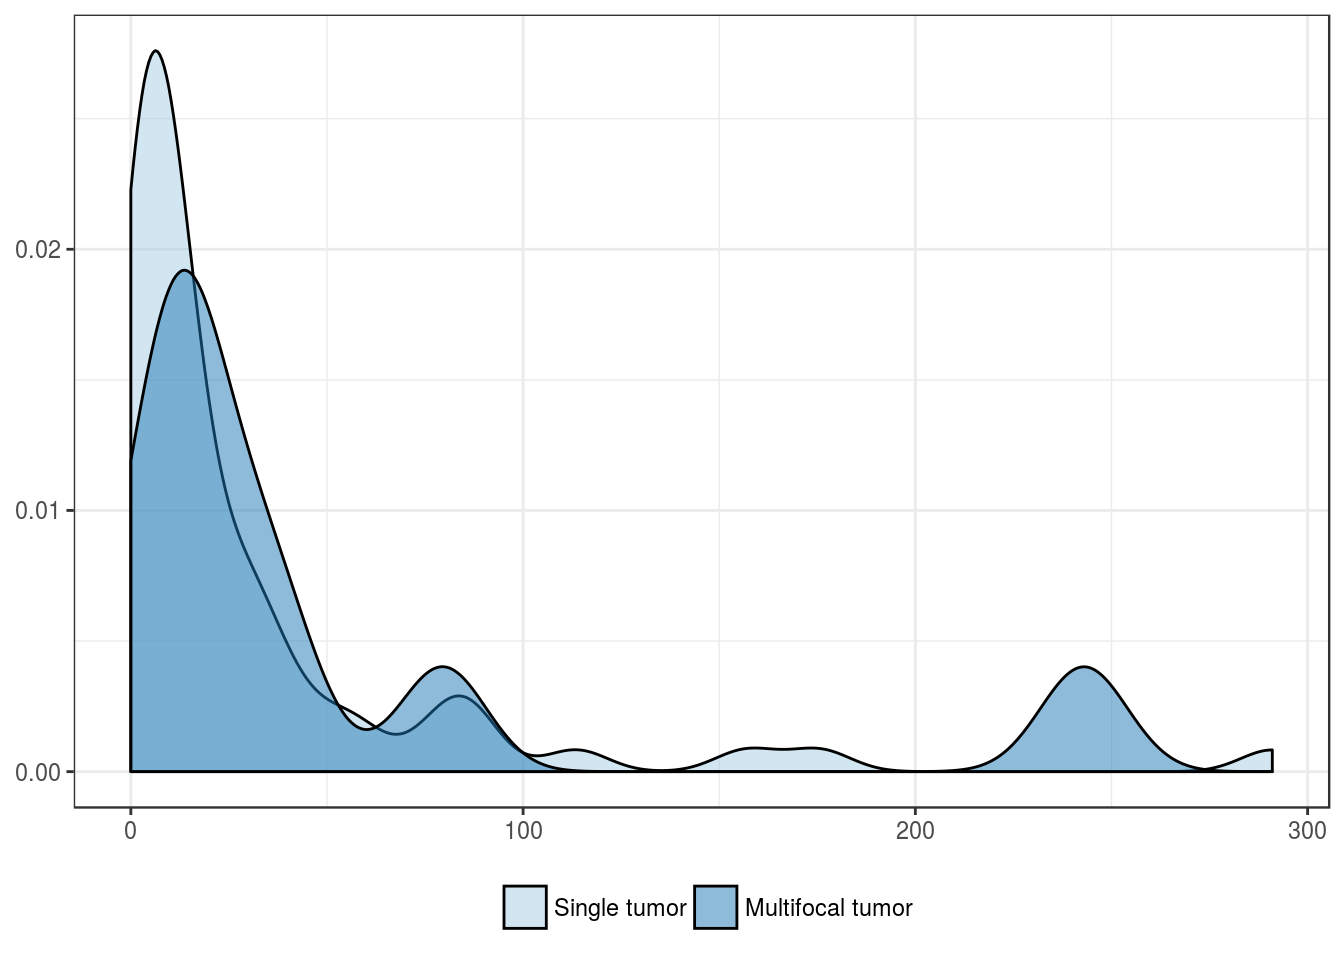
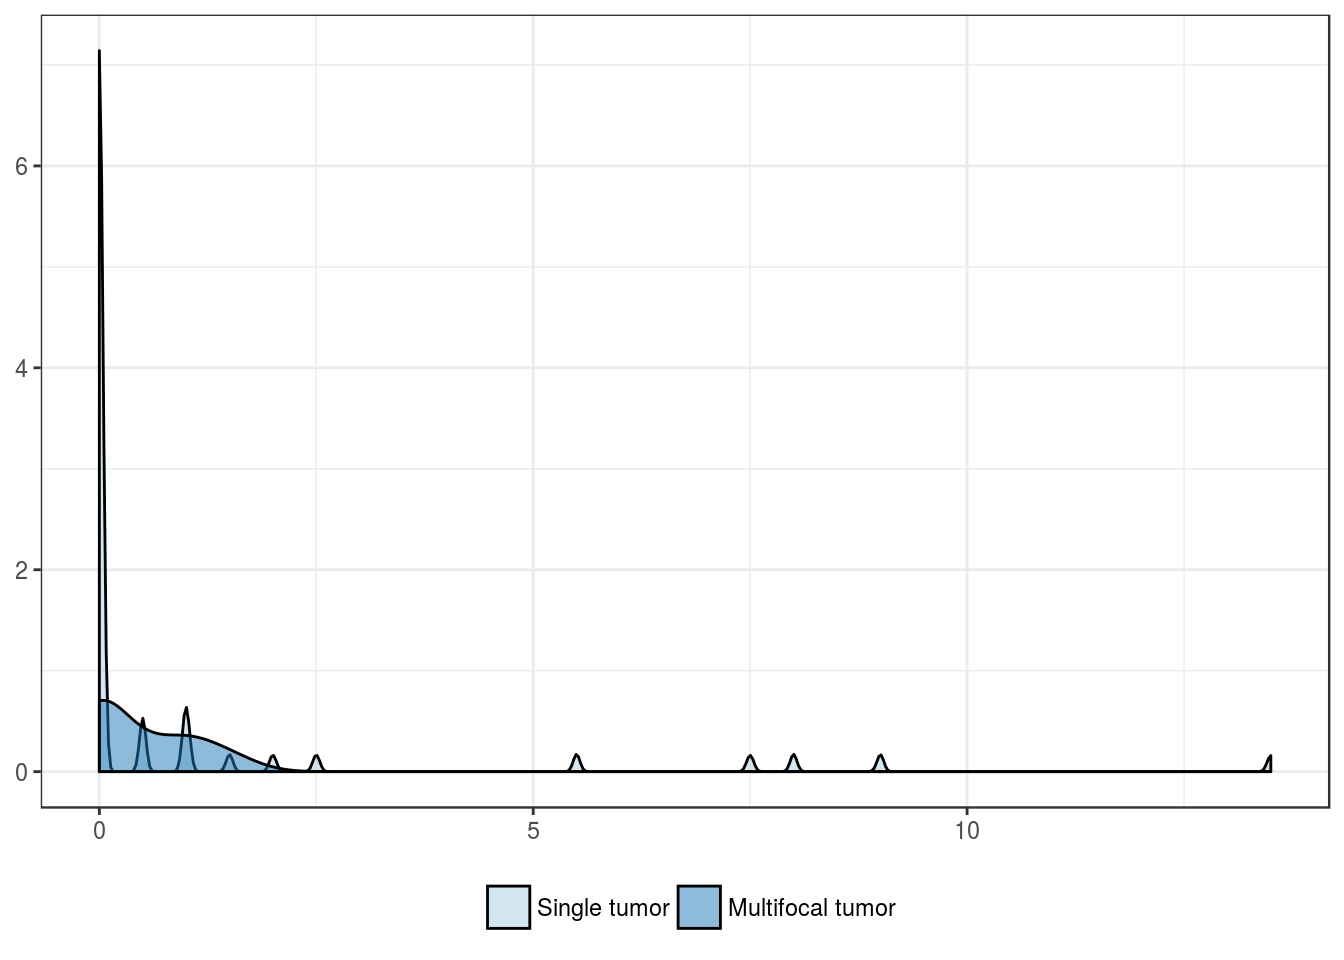
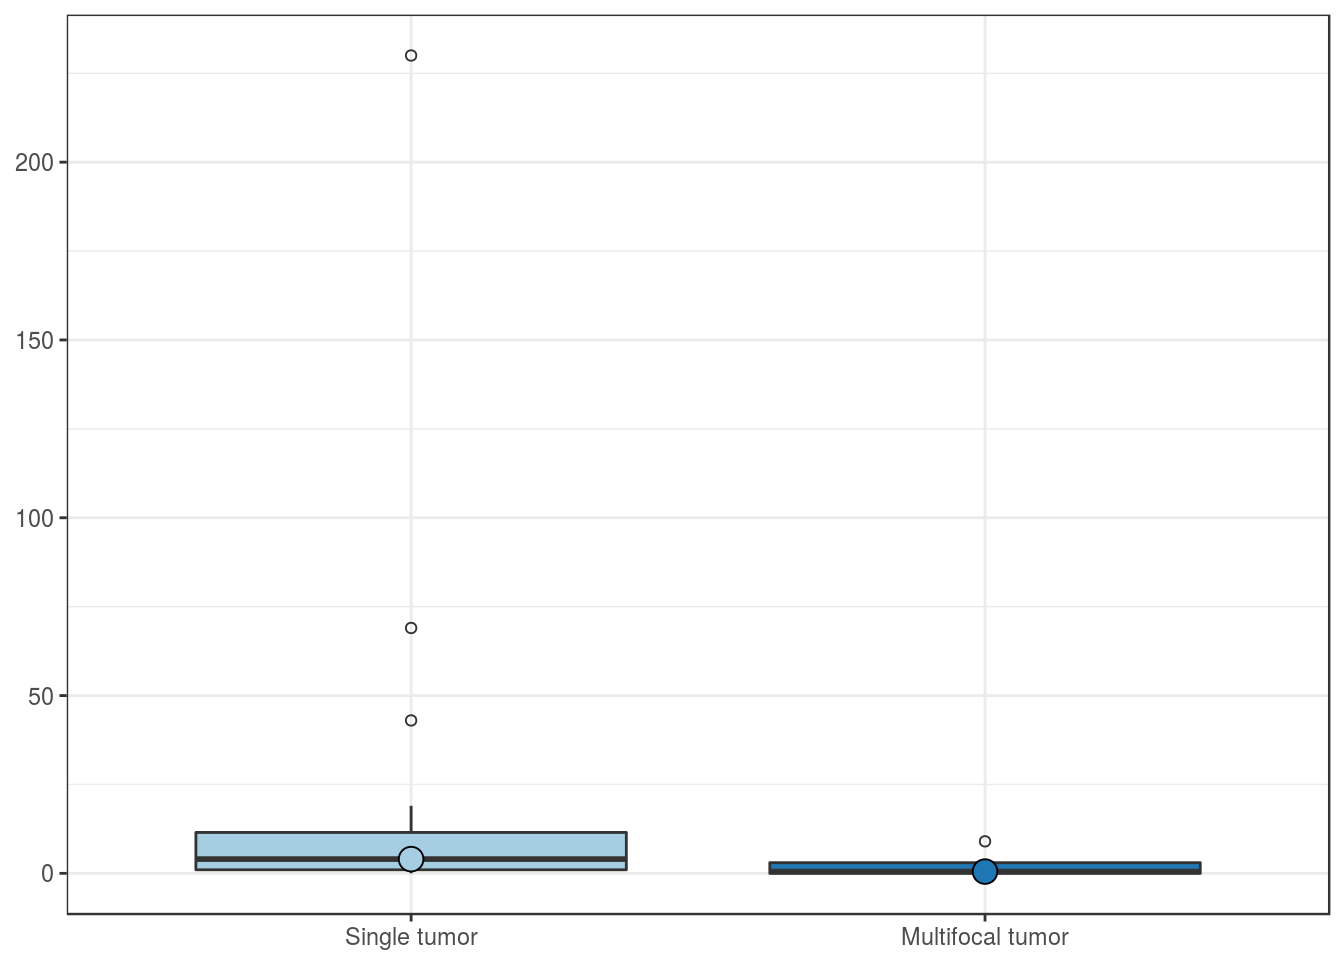
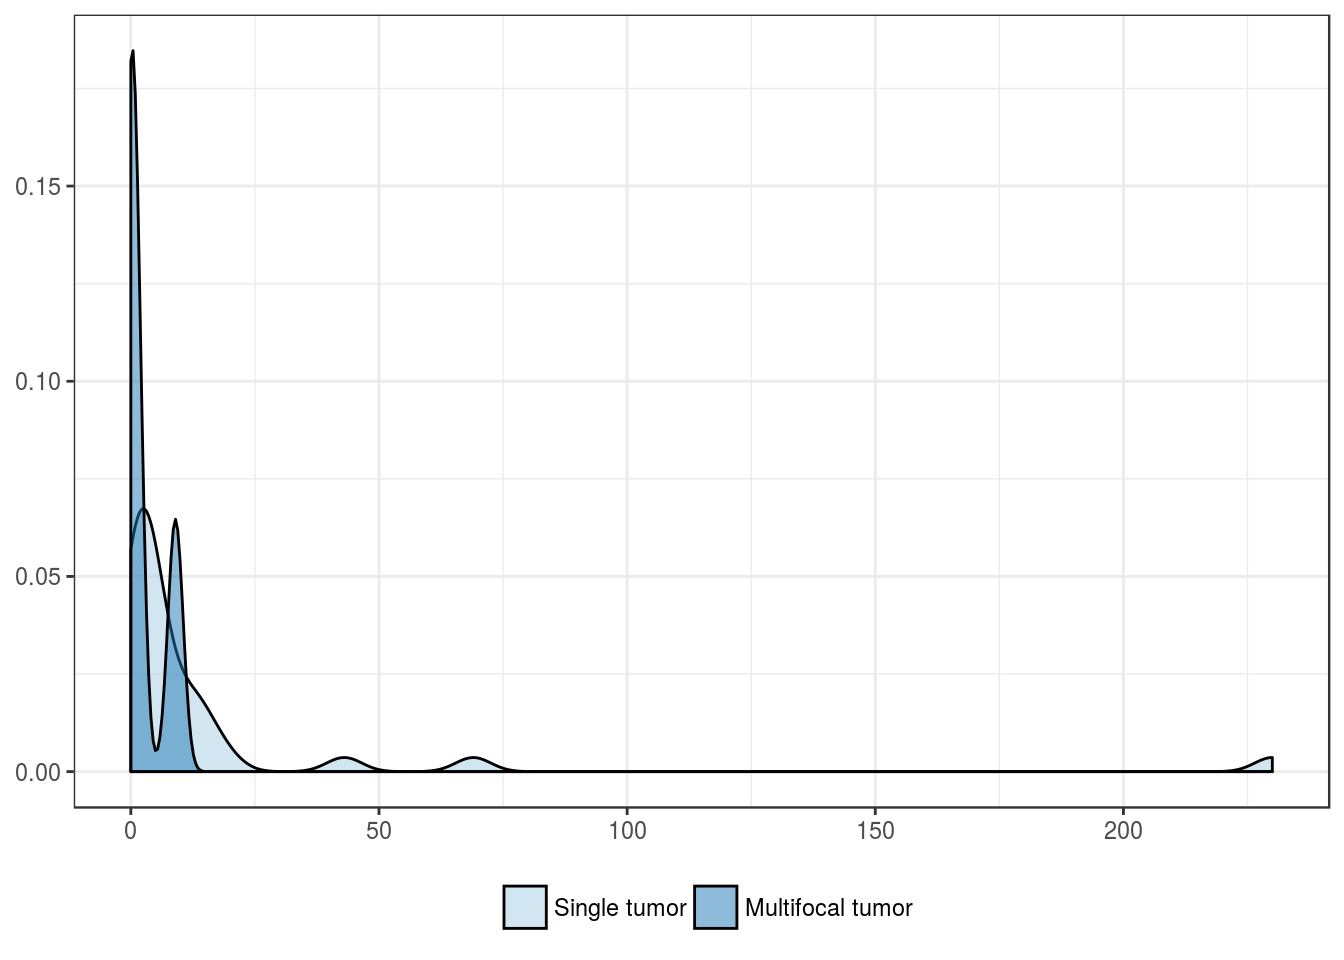
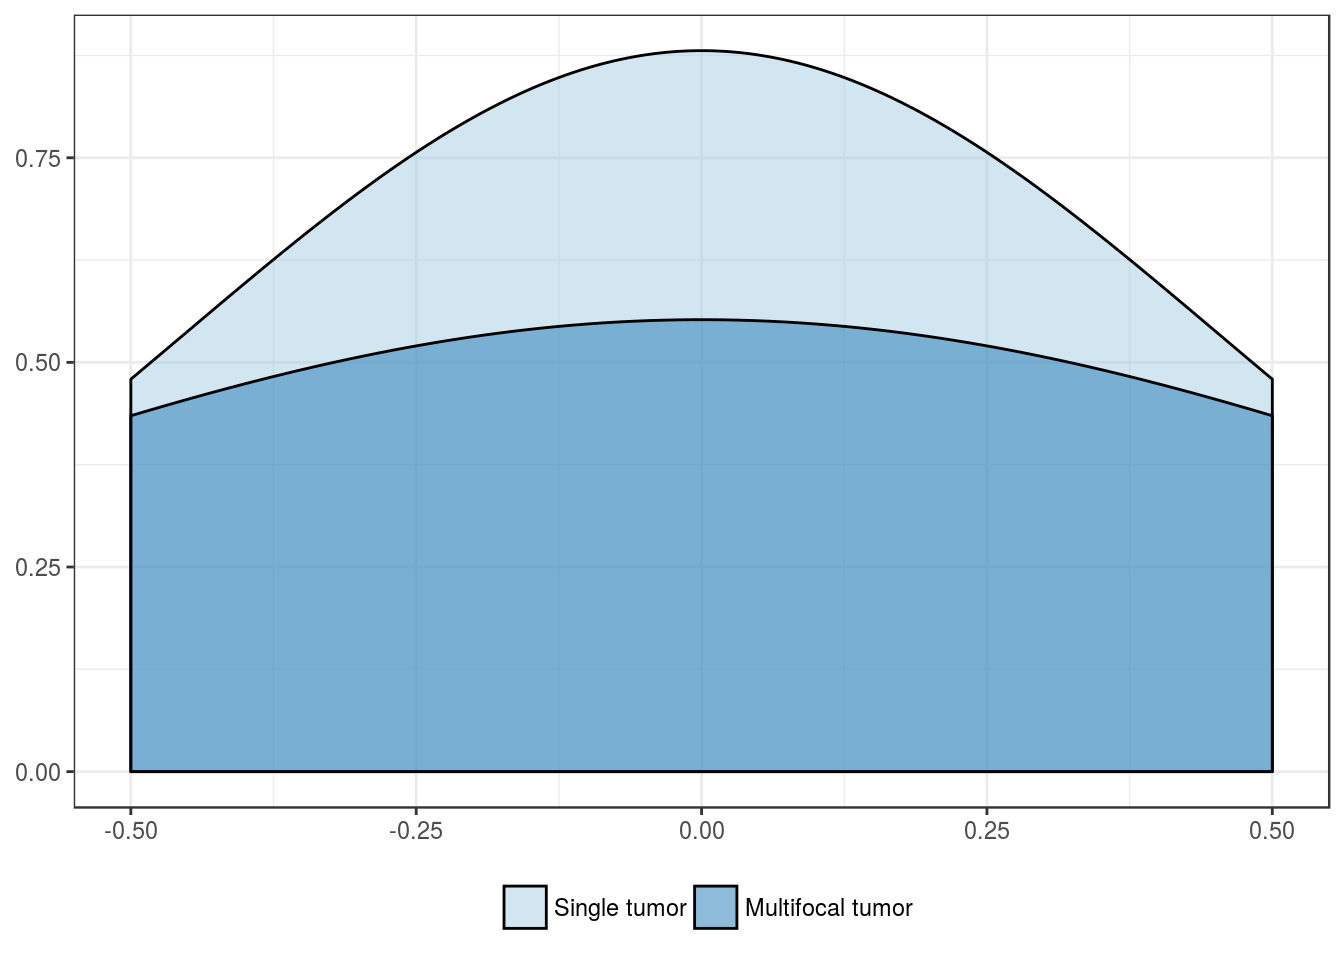
Multifocality
| Single tumor | Multifocal tumor | |
|---|---|---|
| Mean | 29.8 | 49.4 |
| Standard deviation | 50.1 | 76.3 |
| Median | 11.5 | 15.5 |
| Interquartile range | 27.0 | 25.5 |
| Minimum | 0.0 | 0.0 |
| Maximum | 291.0 | 243.0 |
| Value | |
|---|---|
| U-statistic | 202 |
| P statistic | 2.3e-01 |
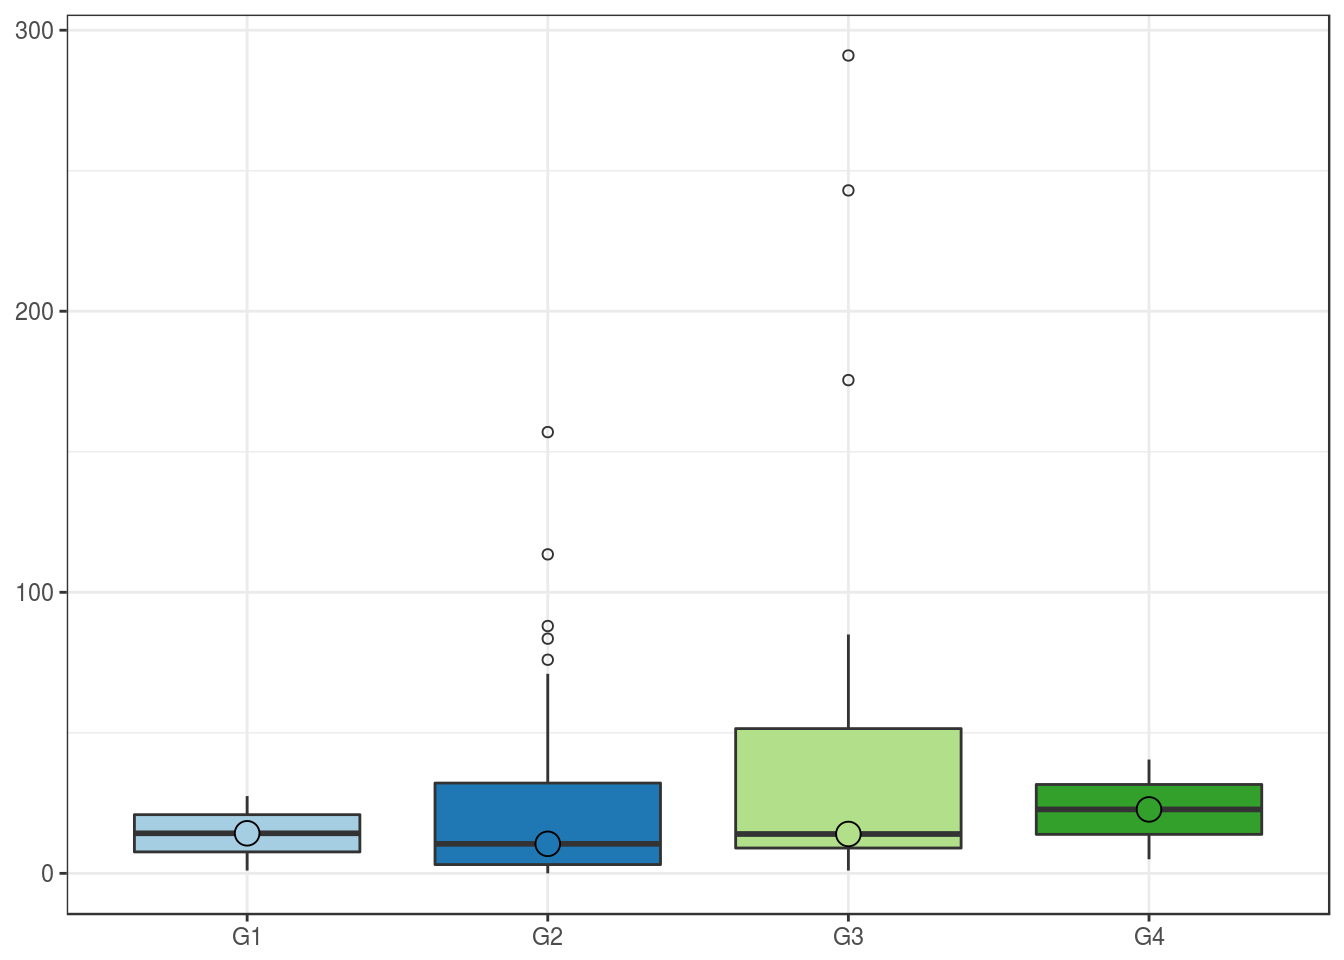
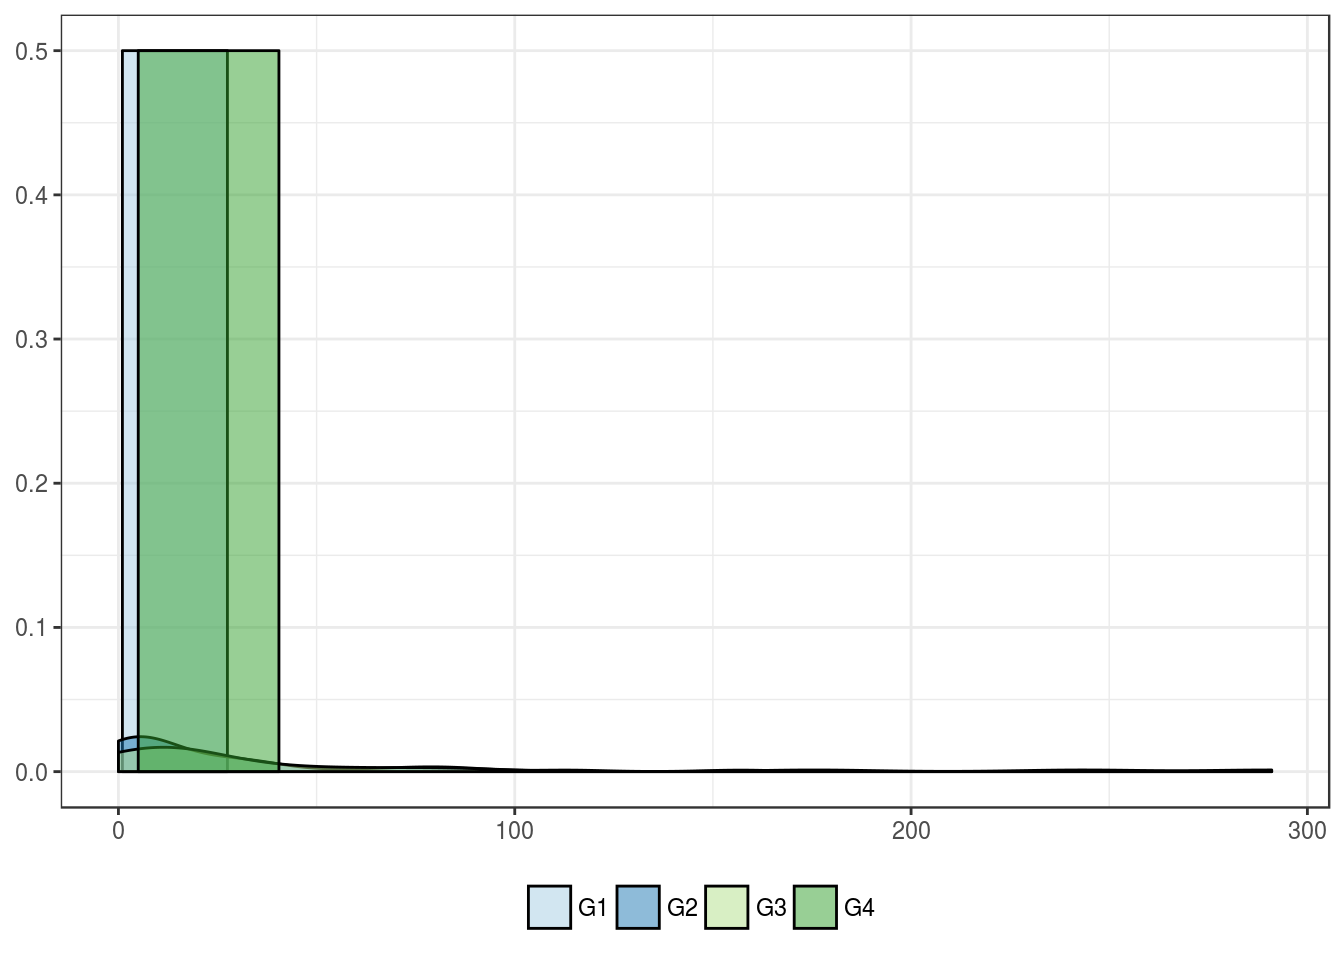
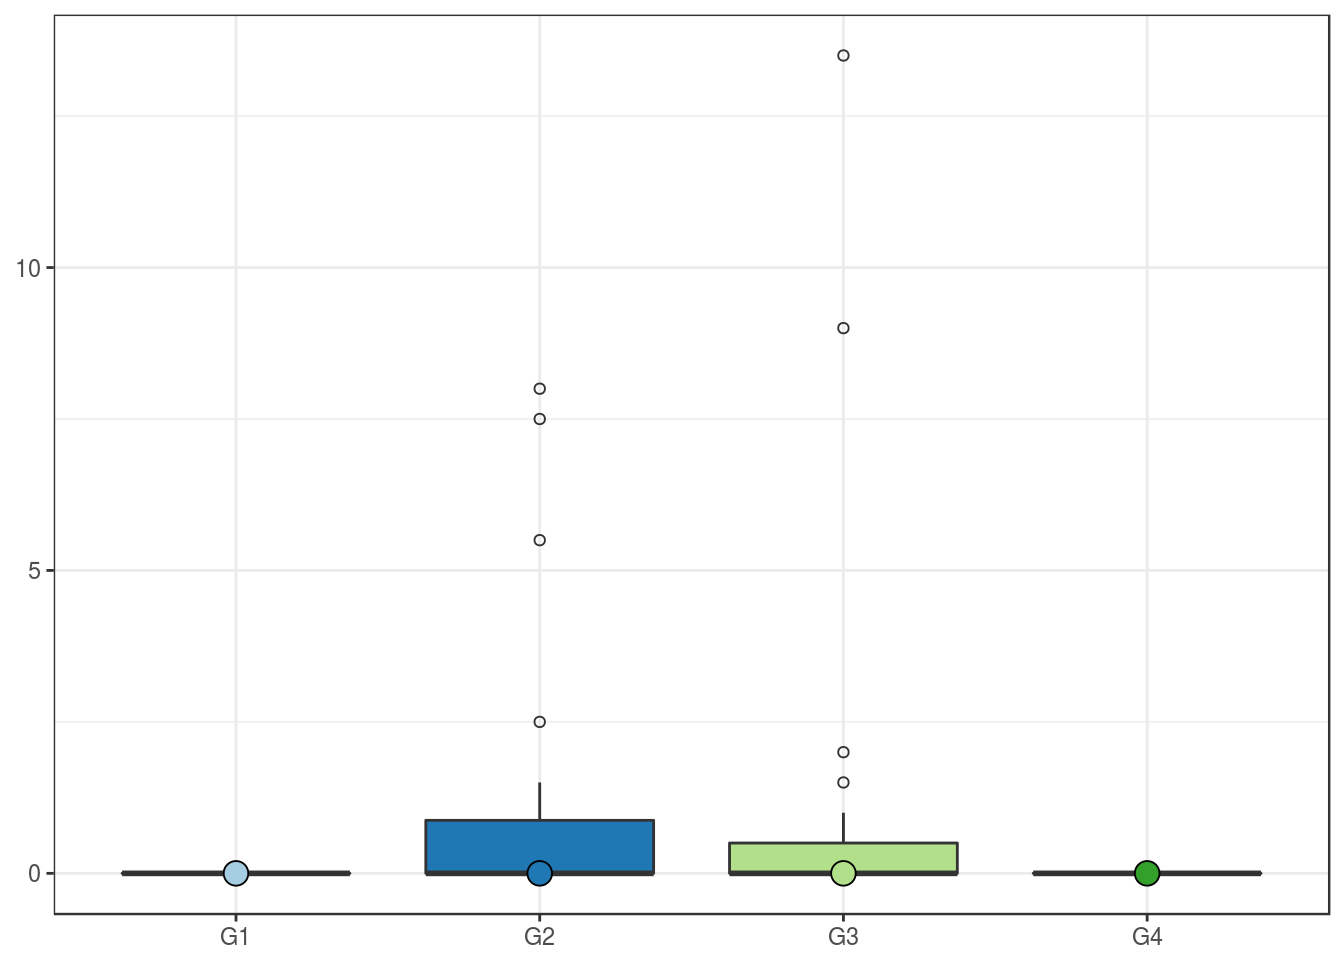
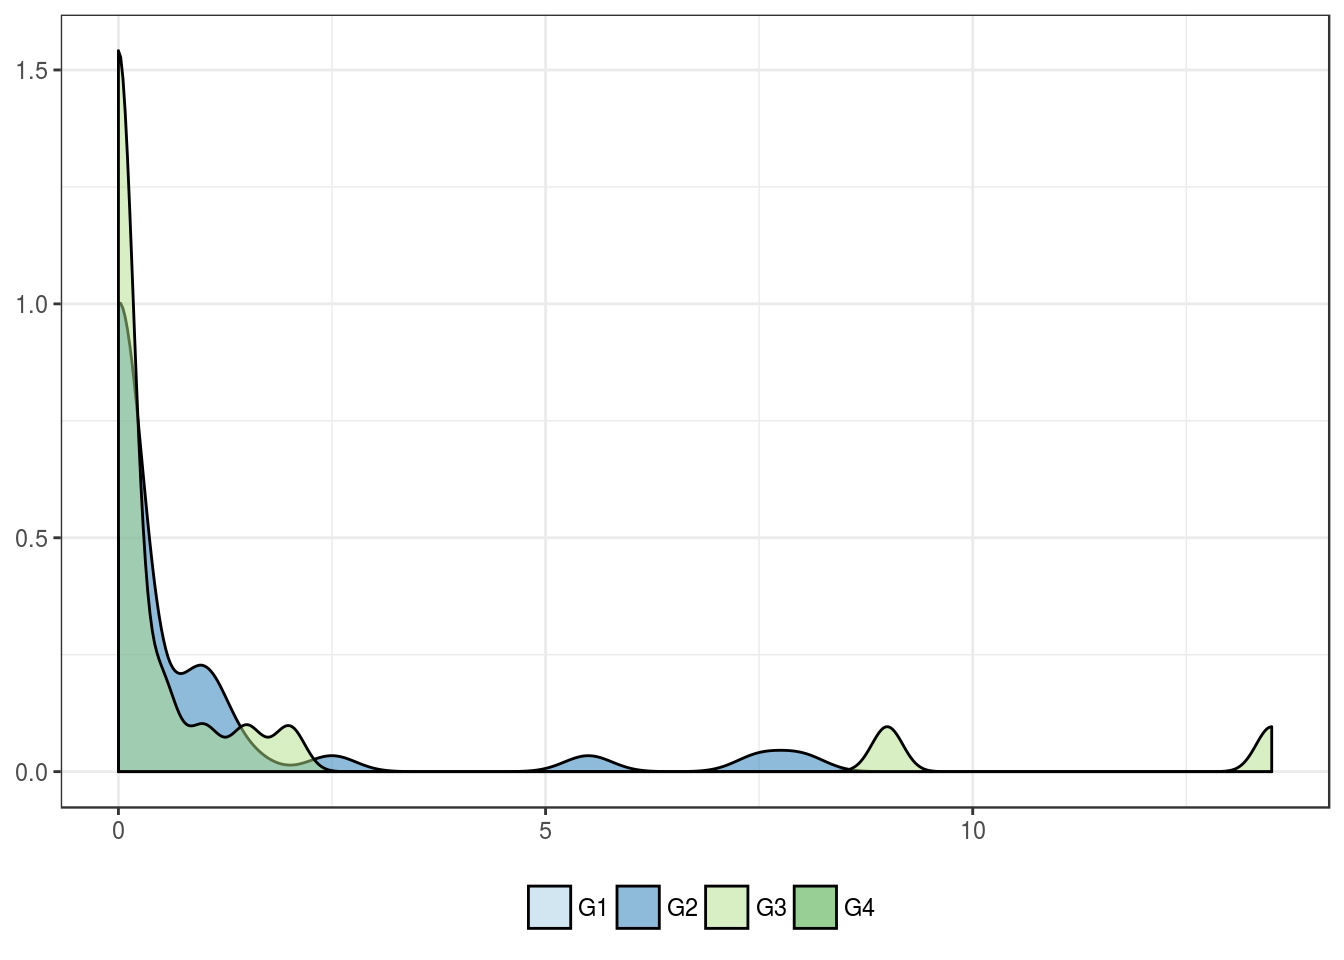
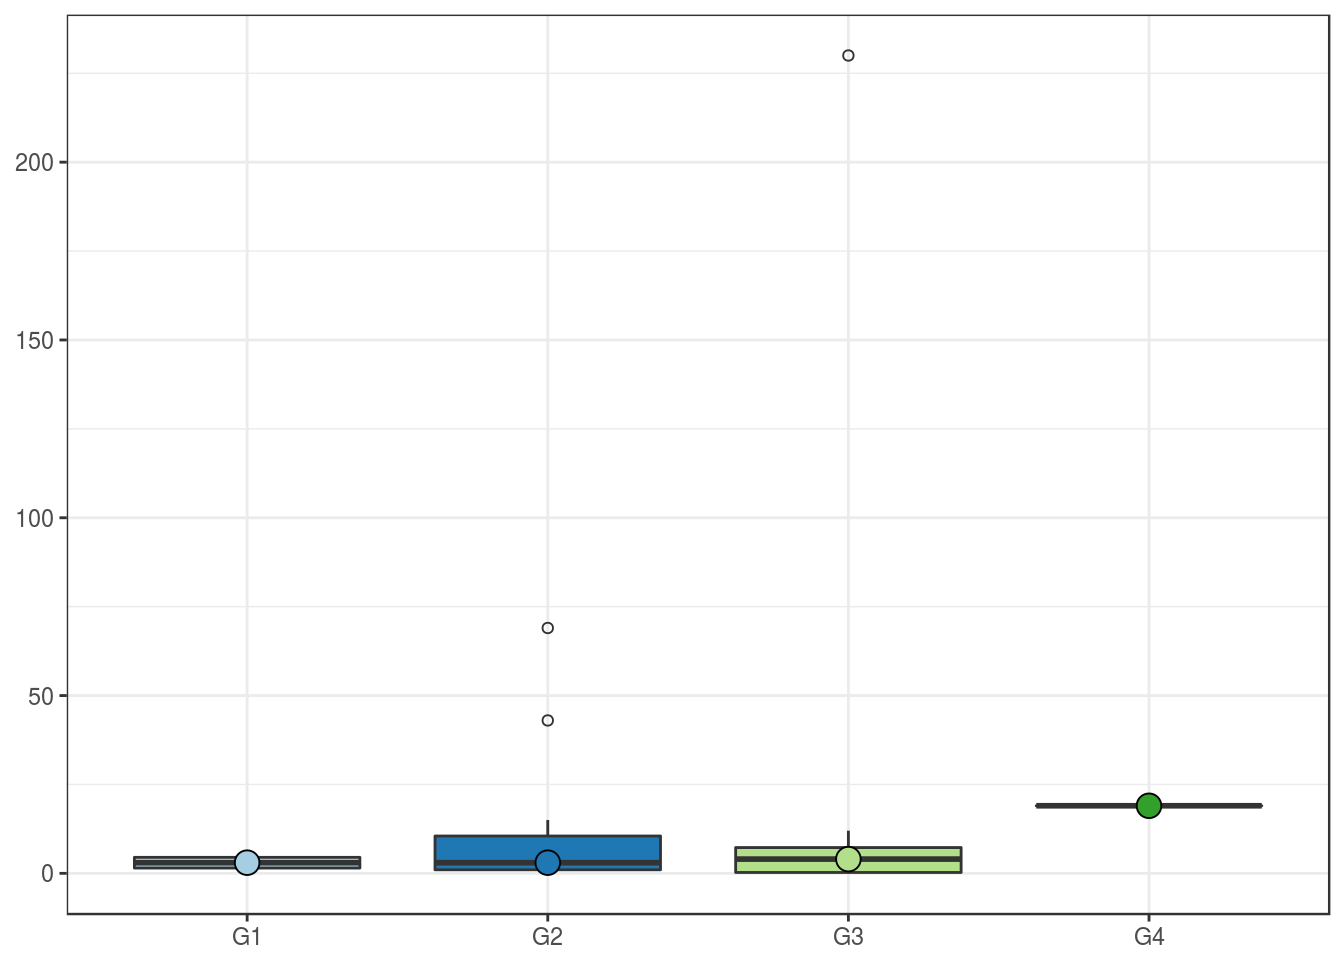
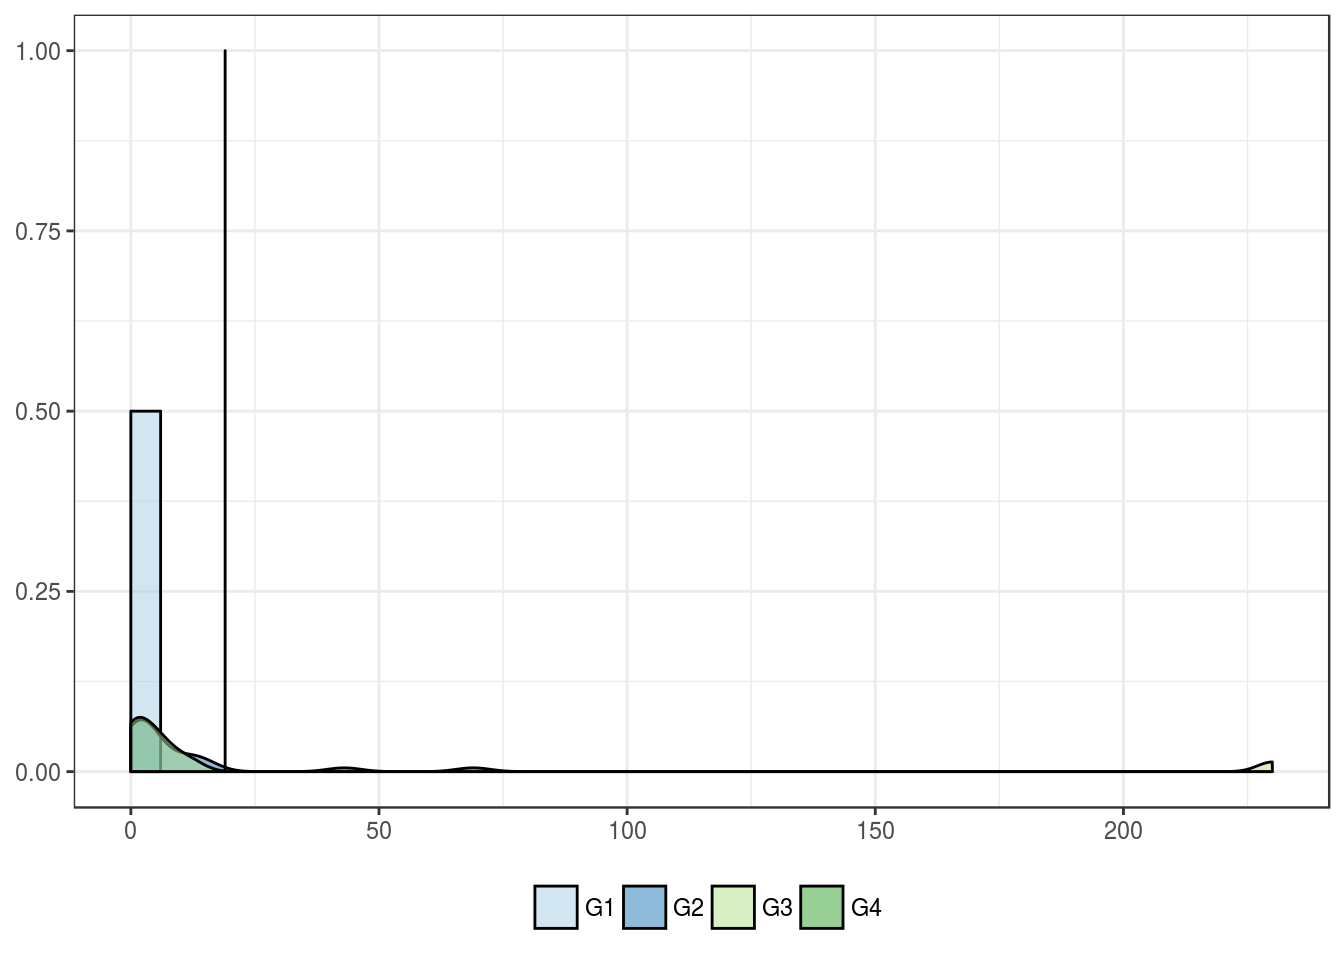
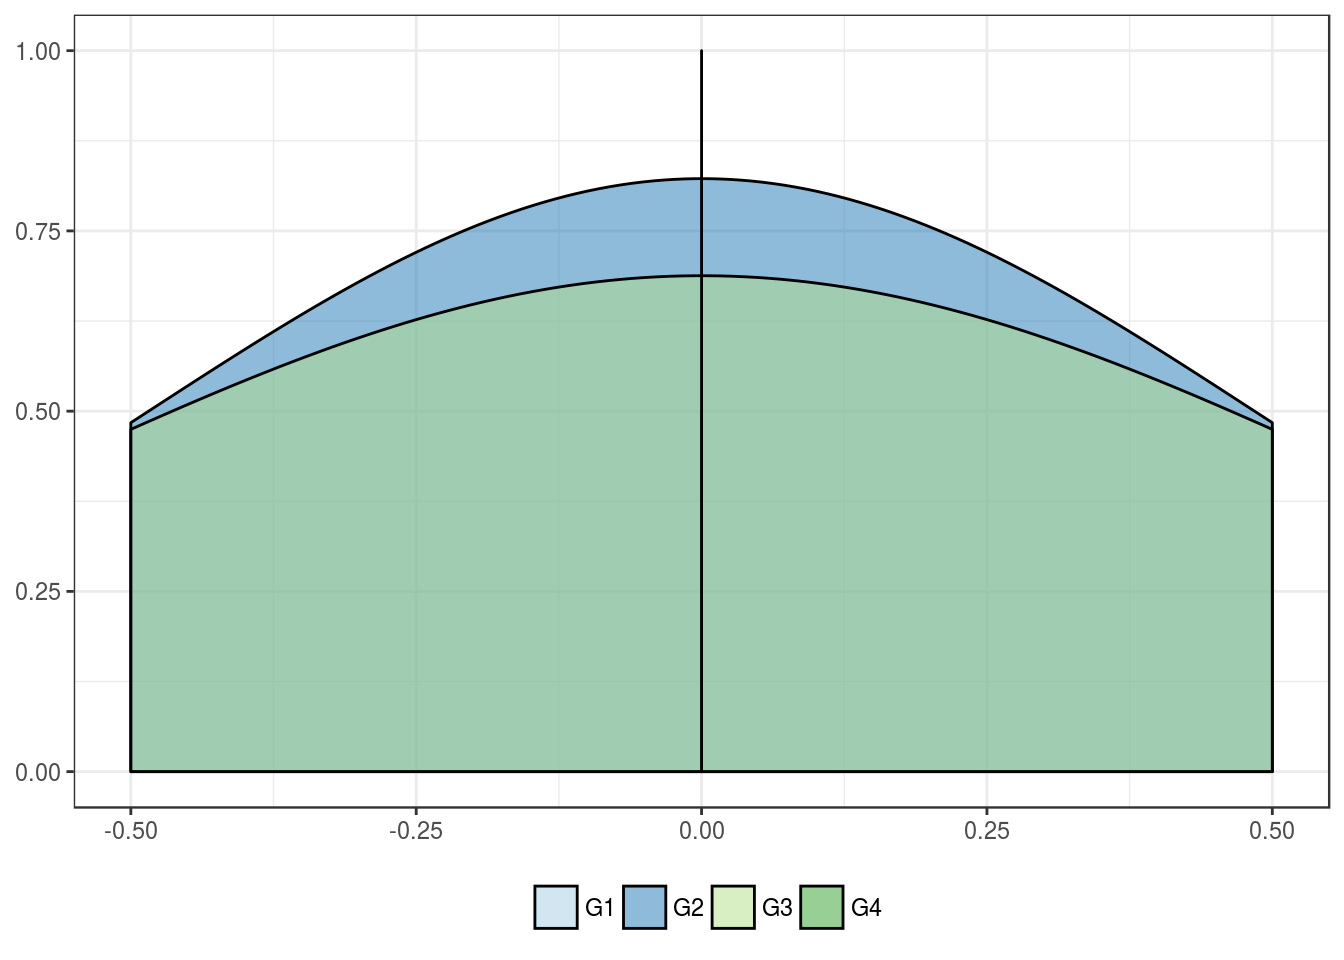
Fuhrman grade
| G1 | G2 | G3 | G4 | |
|---|---|---|---|---|
| Mean | 14.2 | 25.2 | 50.5 | 22.8 |
| Standard deviation | 18.7 | 34.7 | 79.1 | 25.1 |
| Median | 14.2 | 10.5 | 14.0 | 22.8 |
| Interquartile range | 13.2 | 29.0 | 42.5 | 17.8 |
| Minimum | 1.0 | 0.0 | 1.0 | 5.0 |
| Maximum | 27.5 | 157.0 | 291.0 | 40.5 |
| Value | |
|---|---|
| Statistic | 3.011 |
| Parameter | 3 |
| P statistic | 0.39 |
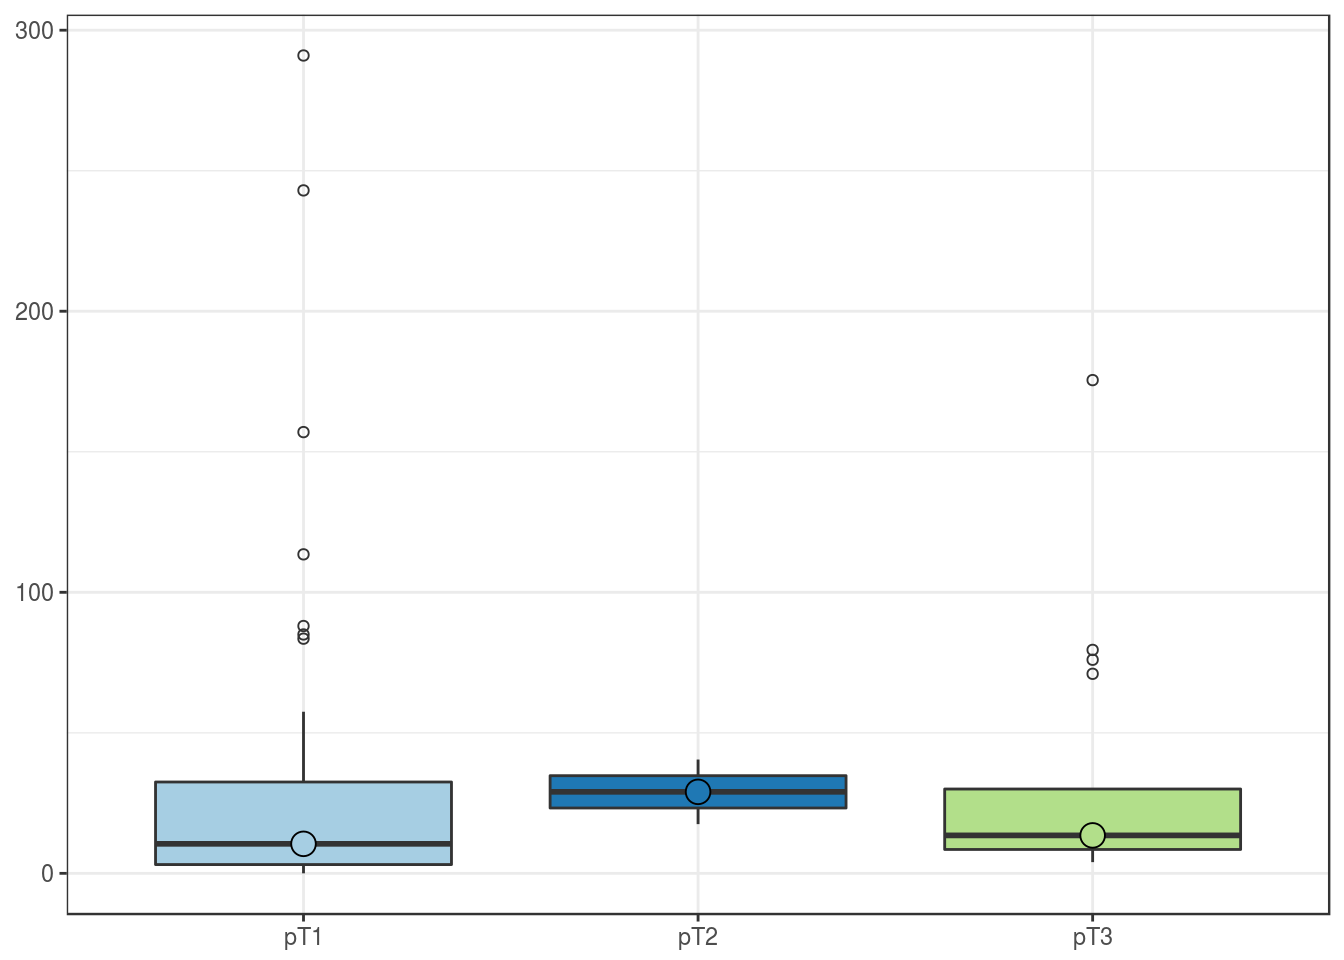
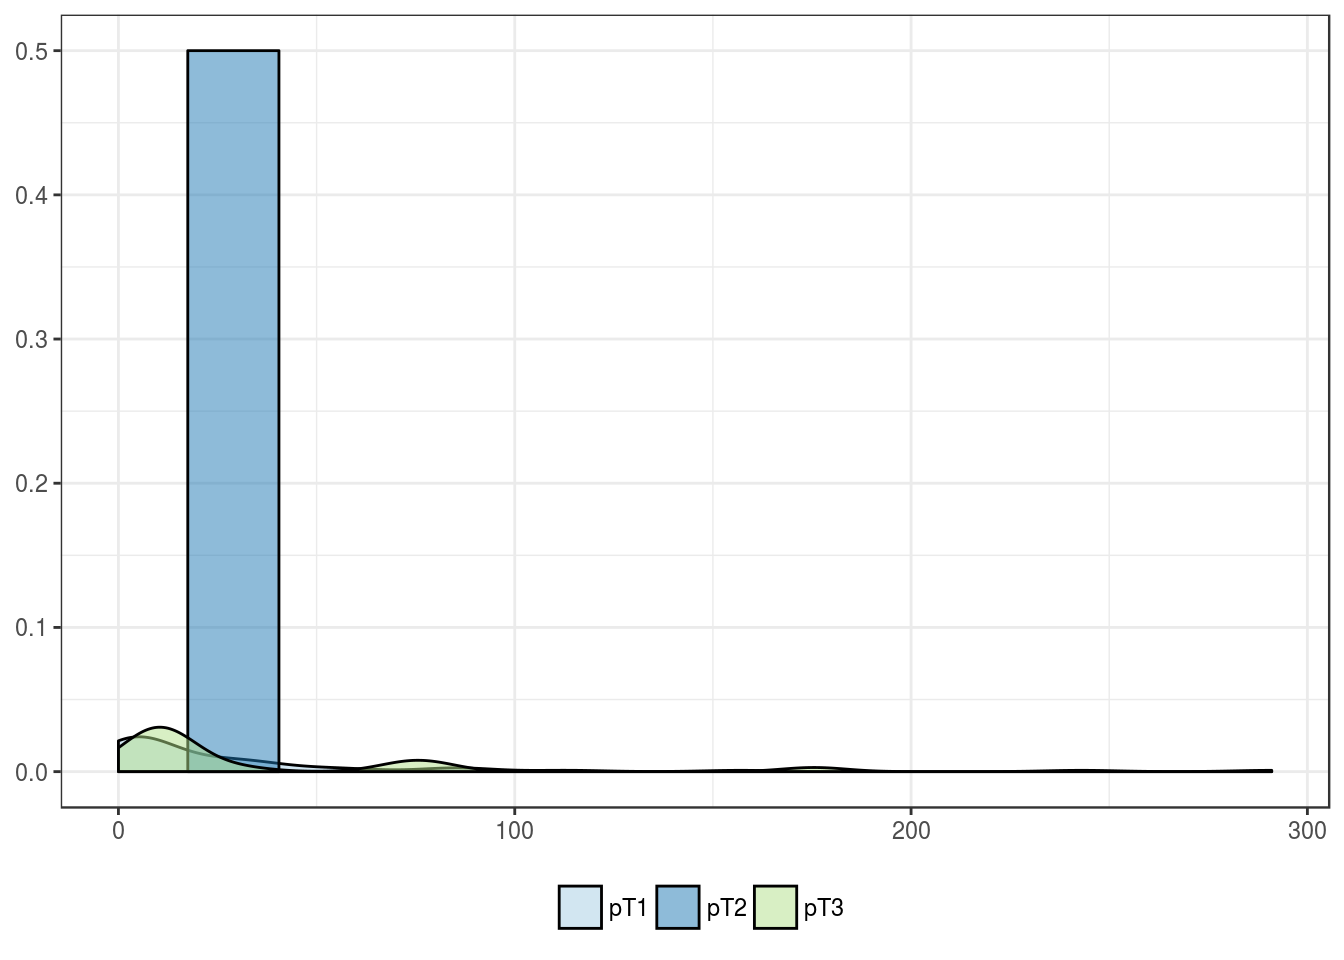
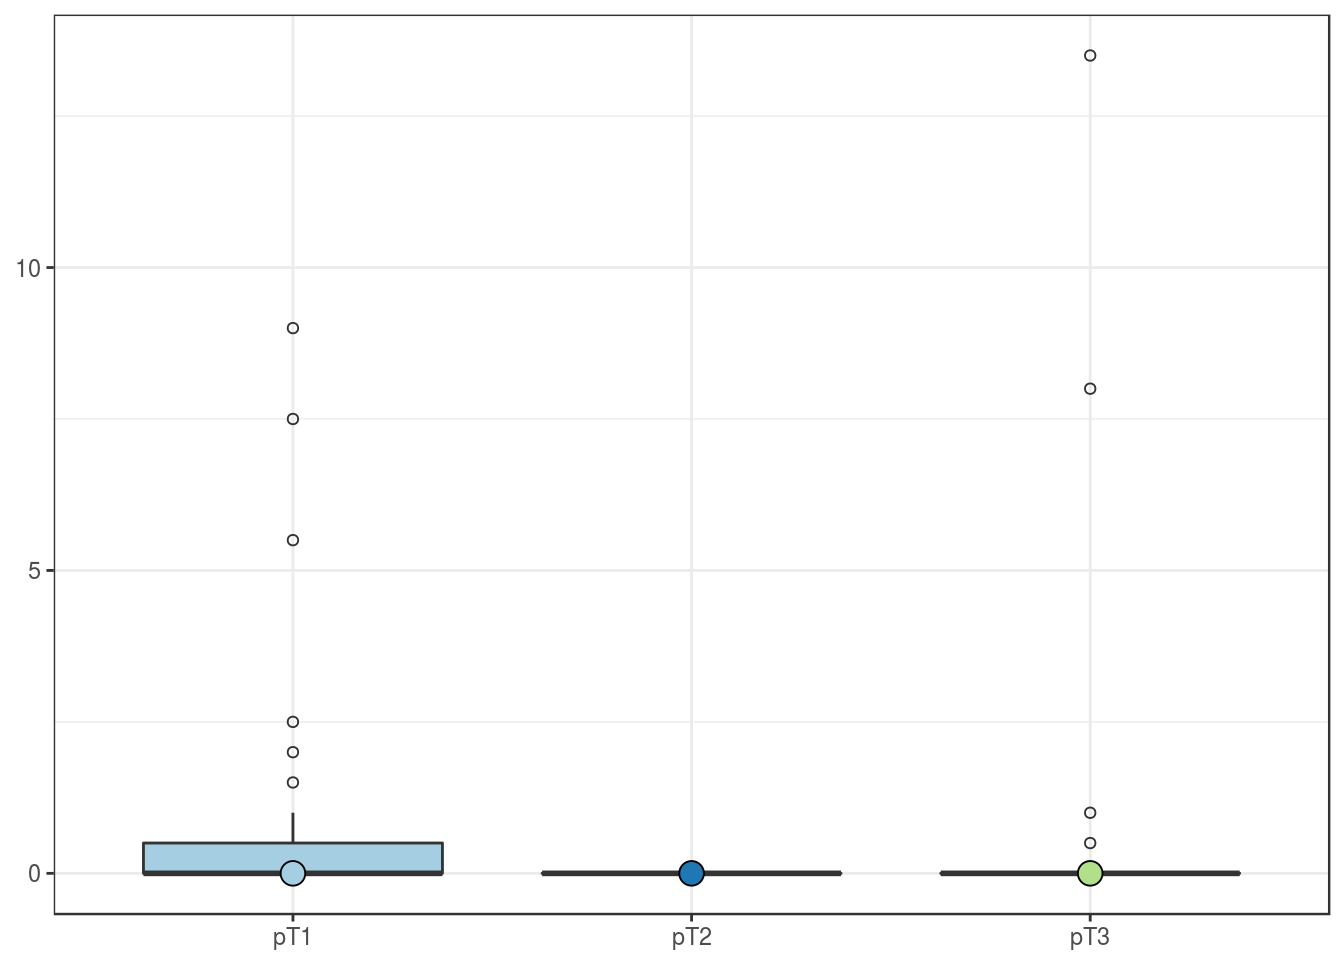
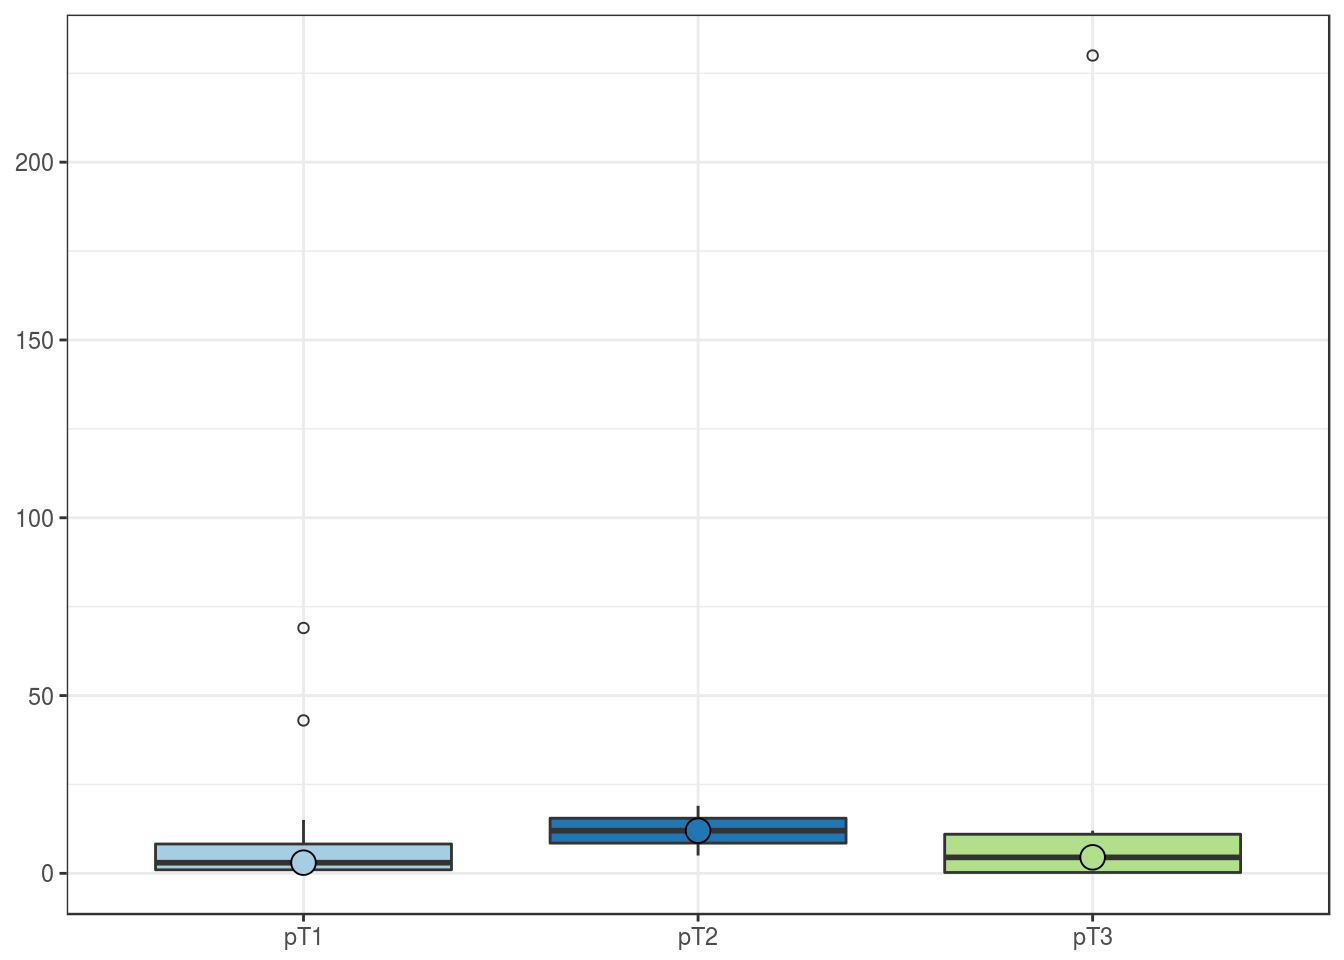
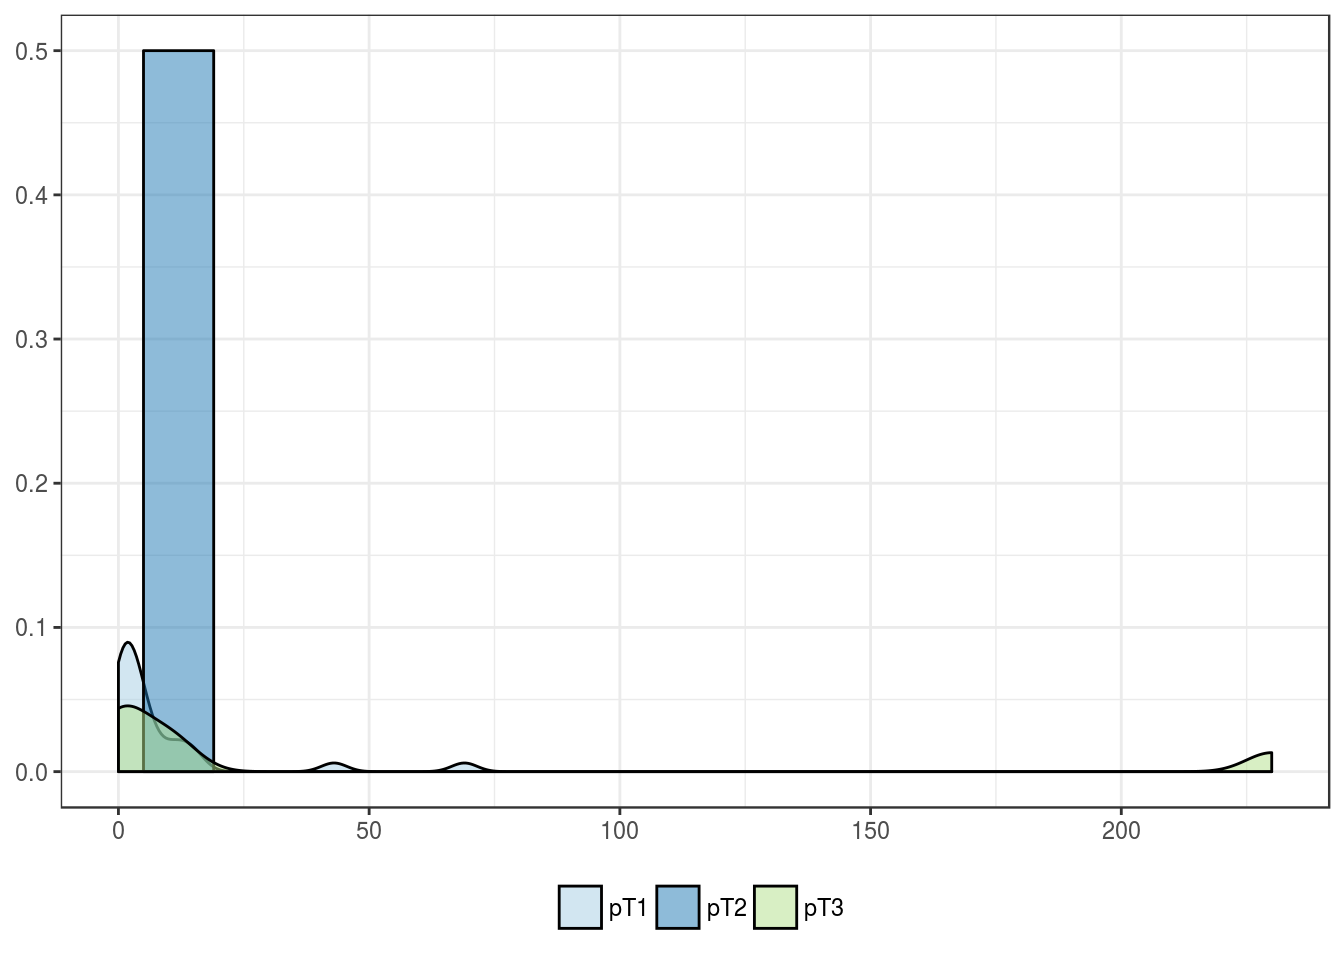
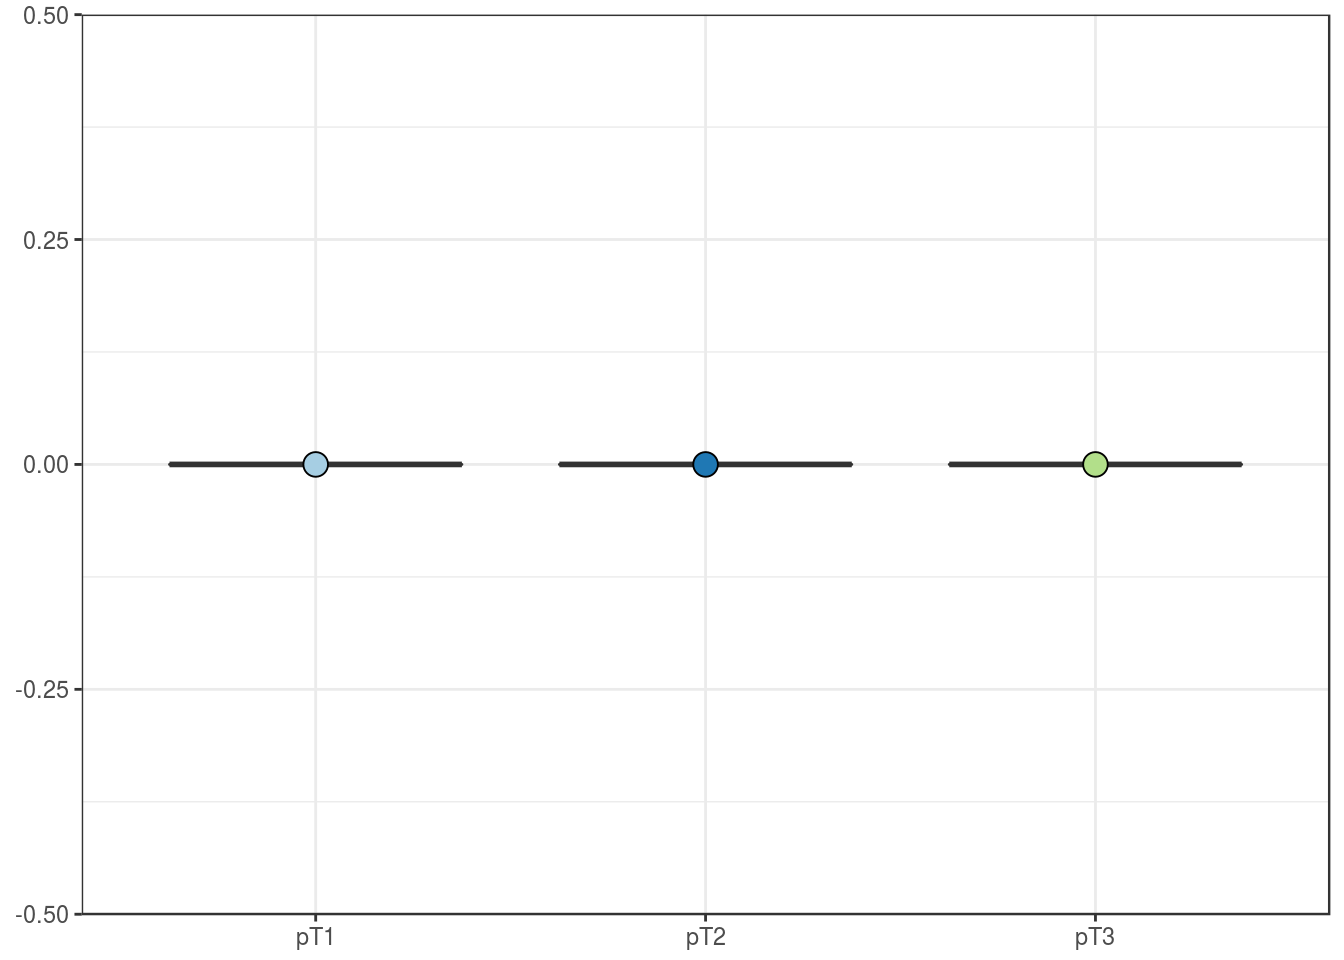
pT stage
| pT1 | pT2 | pT3 | |
|---|---|---|---|
| Mean | 33.5 | 29.0 | 32.6 |
| Standard deviation | 58.3 | 16.3 | 44.8 |
| Median | 10.5 | 29.0 | 13.5 |
| Interquartile range | 29.4 | 11.5 | 21.5 |
| Minimum | 0.0 | 17.5 | 4.0 |
| Maximum | 291.0 | 40.5 | 175.5 |
| Value | |
|---|---|
| Statistic | 2.131 |
| Parameter | 2 |
| P statistic | 0.34 |
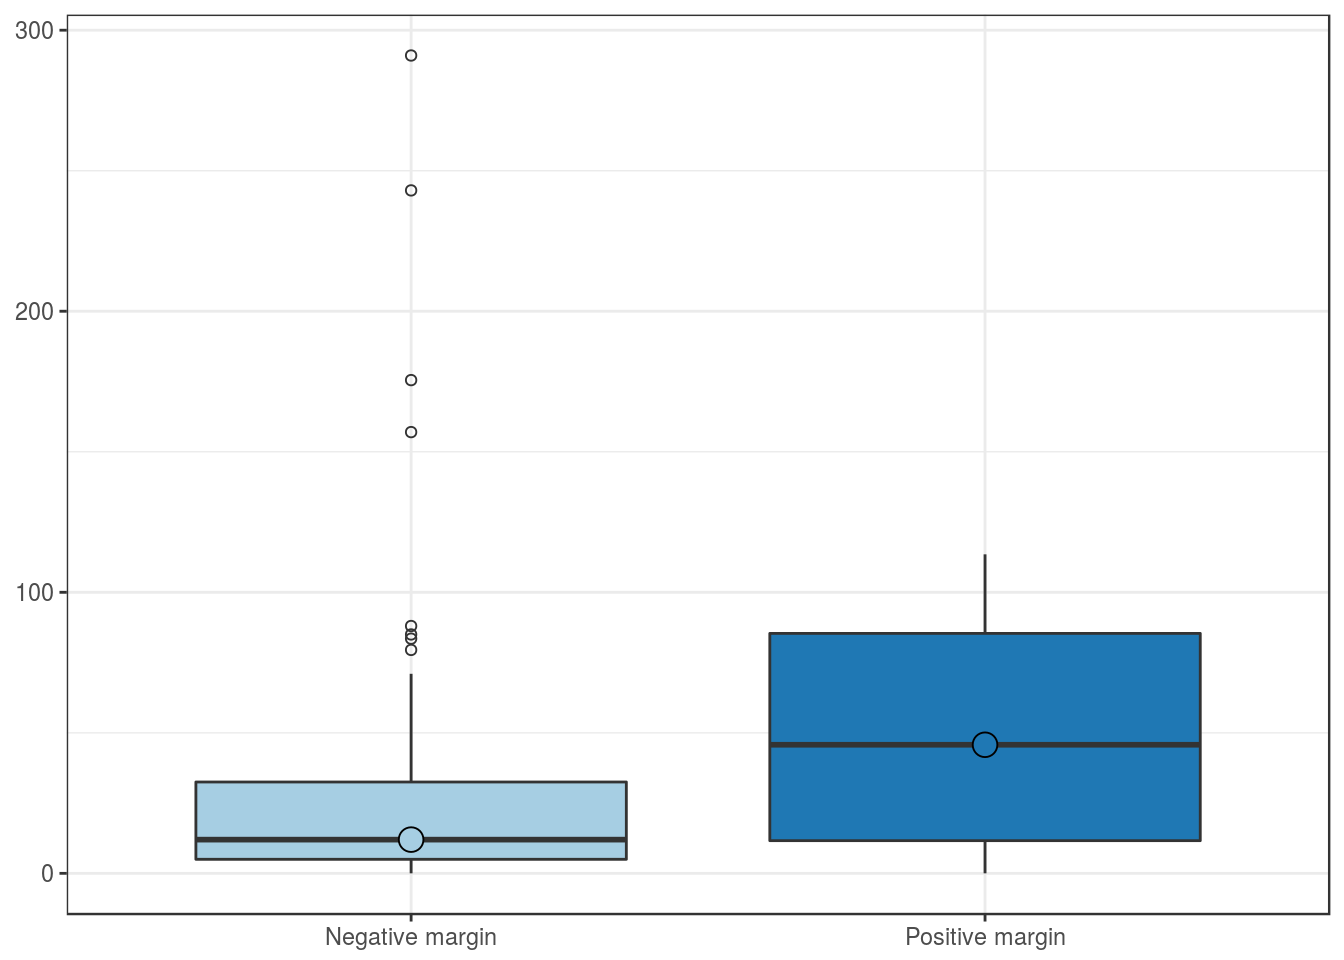
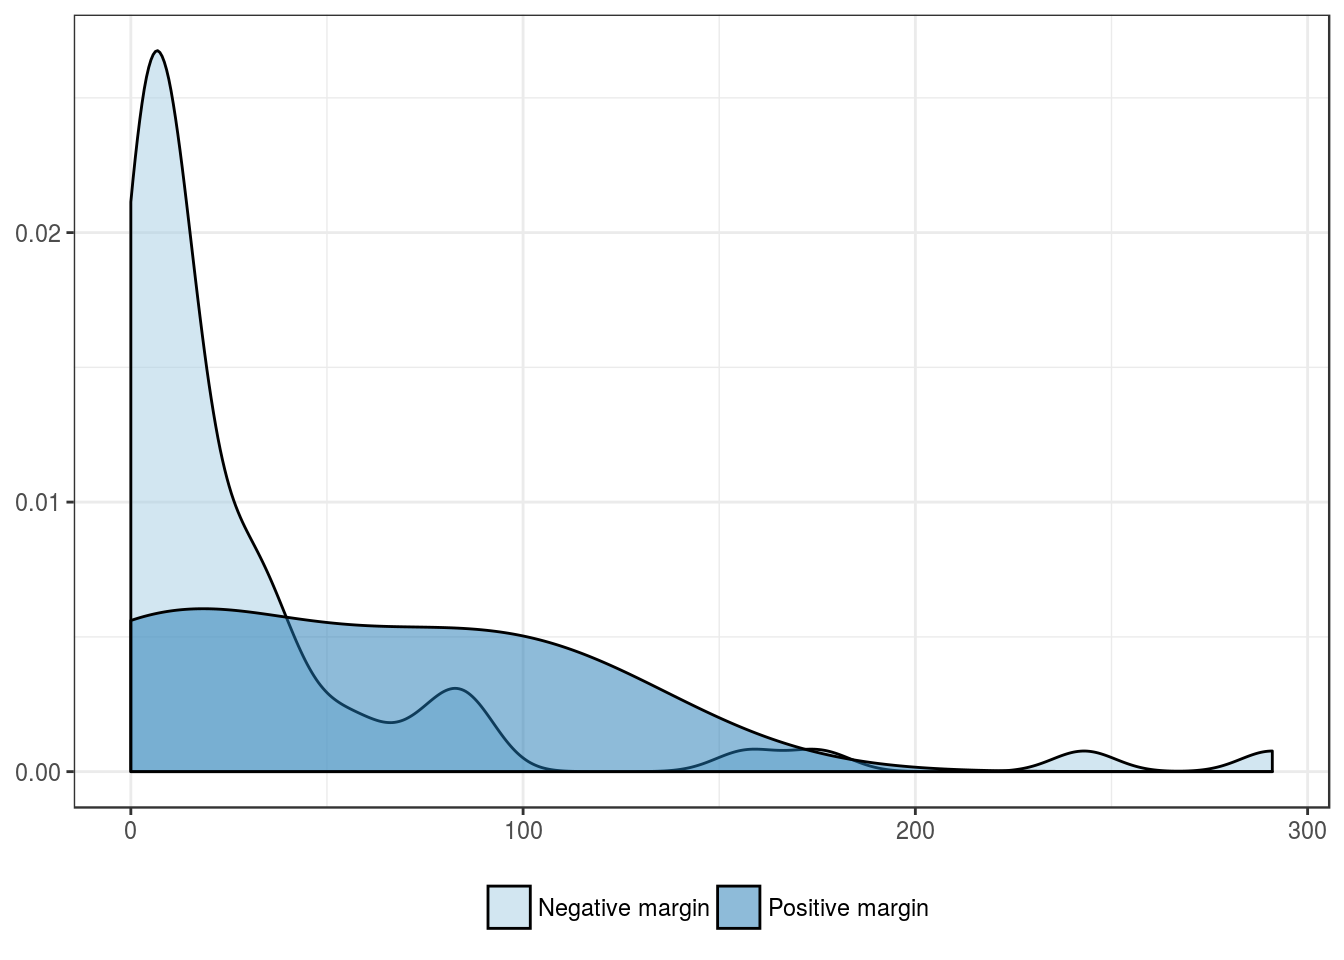
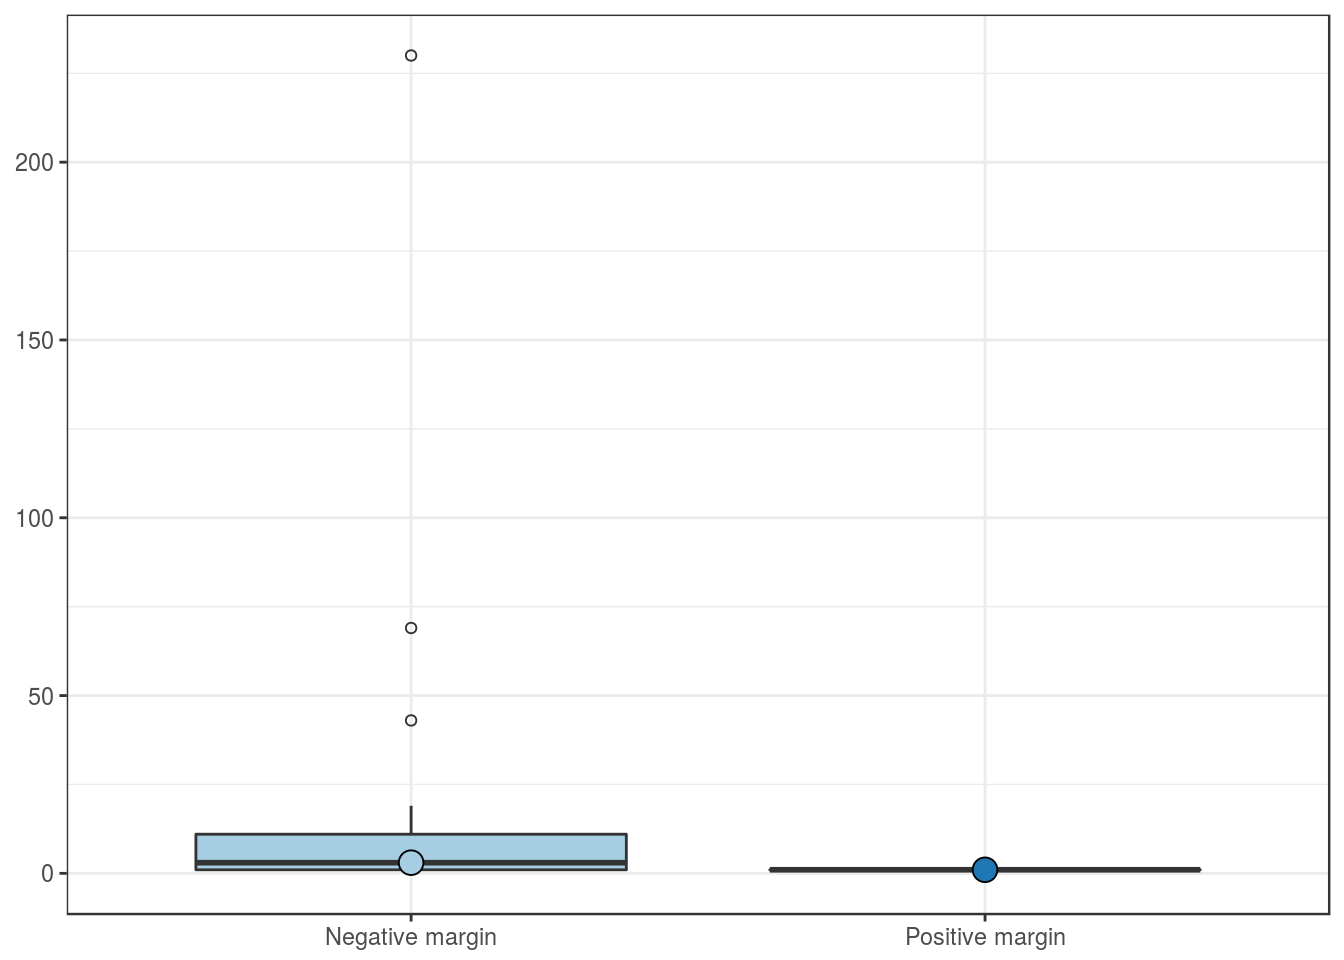
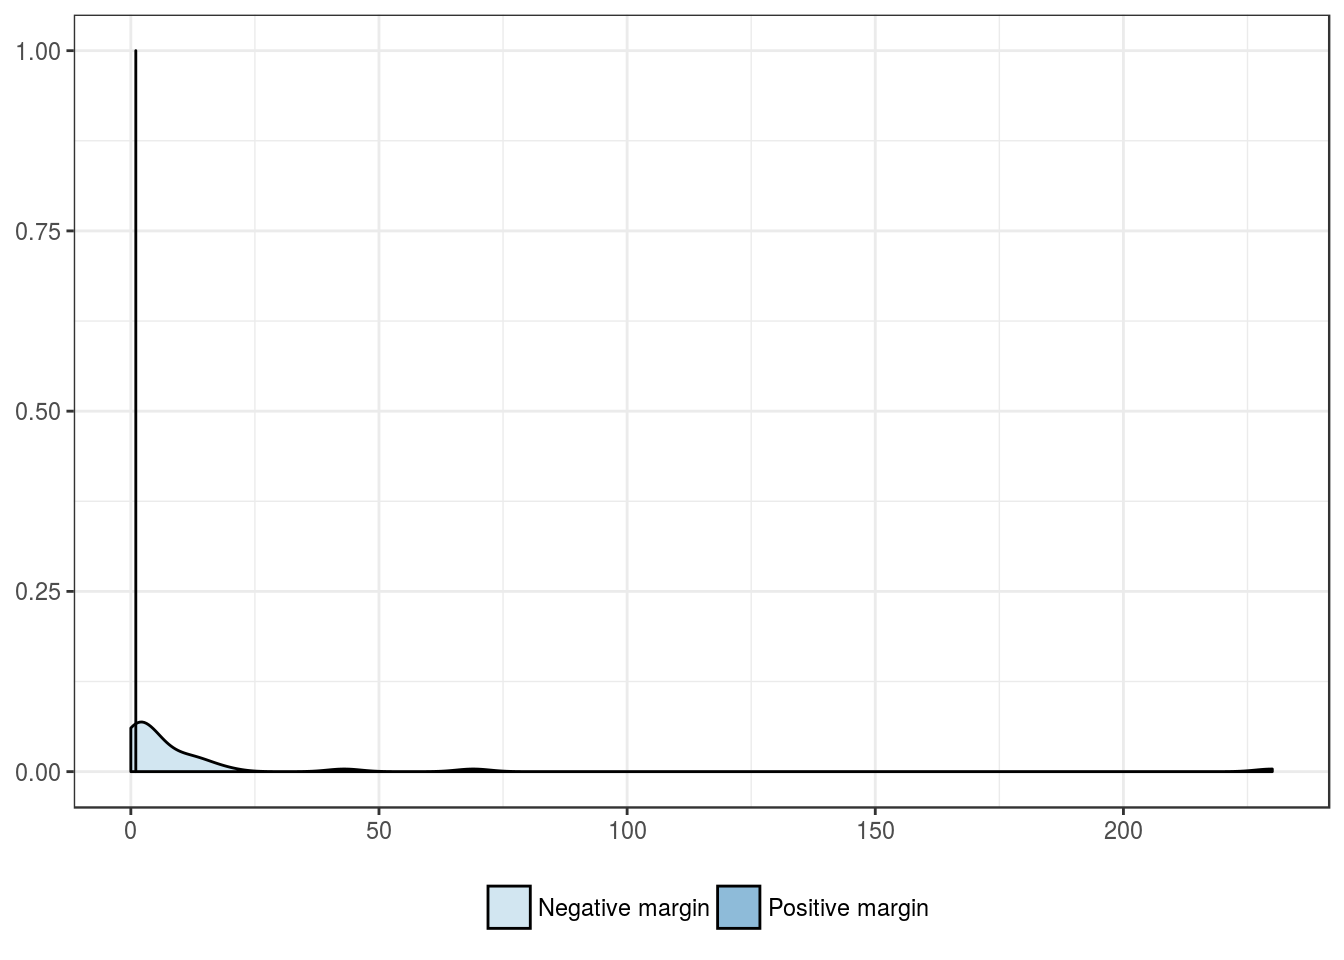
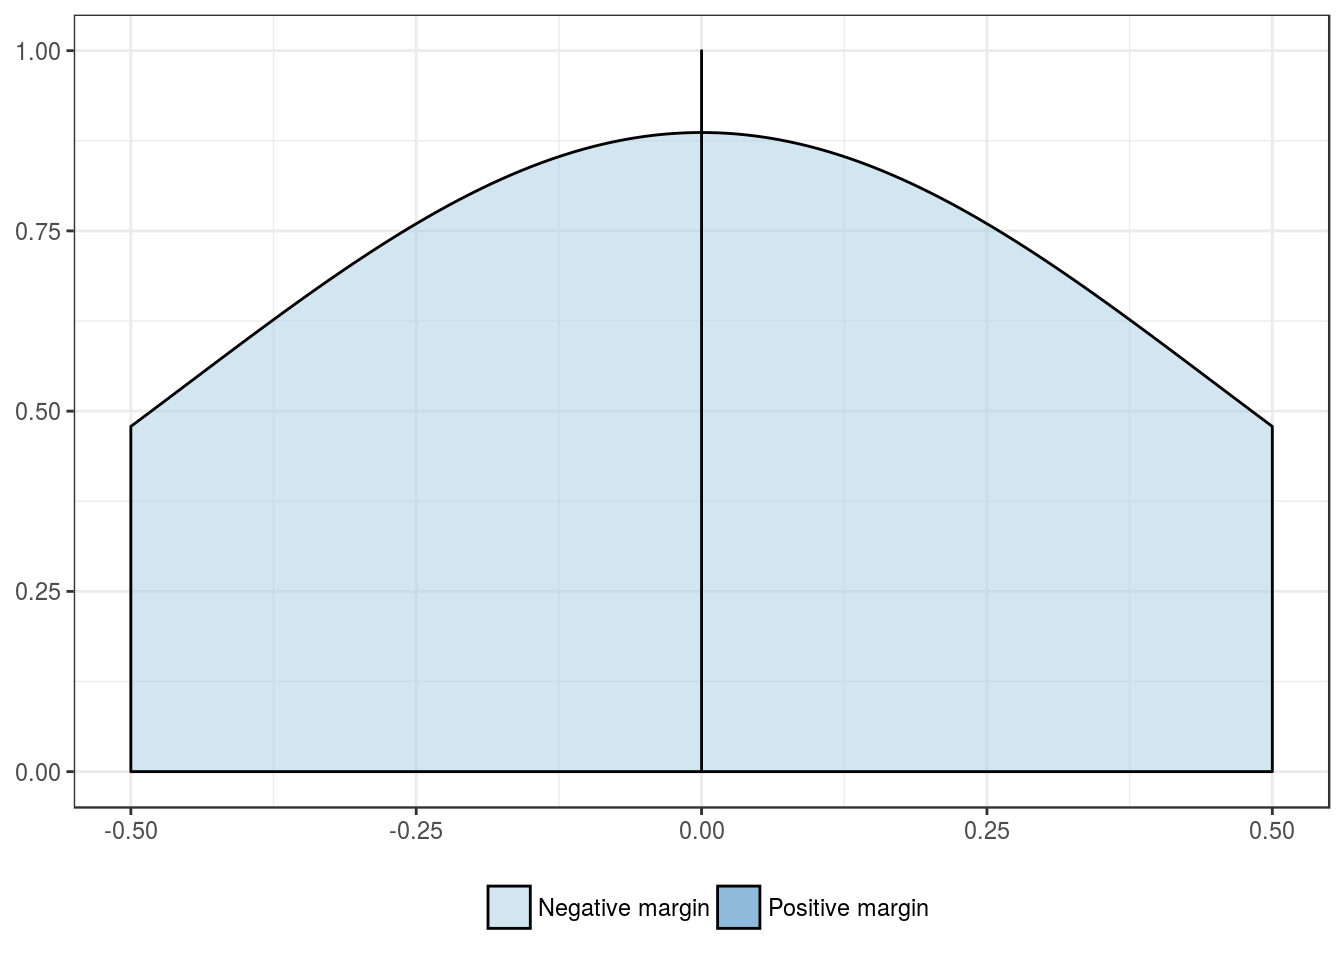
Surgical margin
| Negative margin | Positive margin | |
|---|---|---|
| Mean | 32.0 | 51.2 |
| Standard deviation | 54.4 | 52.9 |
| Median | 12.0 | 45.8 |
| Interquartile range | 27.5 | 73.8 |
| Minimum | 0.0 | 0.0 |
| Maximum | 291.0 | 113.5 |
| Value | |
|---|---|
| U-statistic | 102 |
| P statistic | 4.7e-01 |
Outcome features
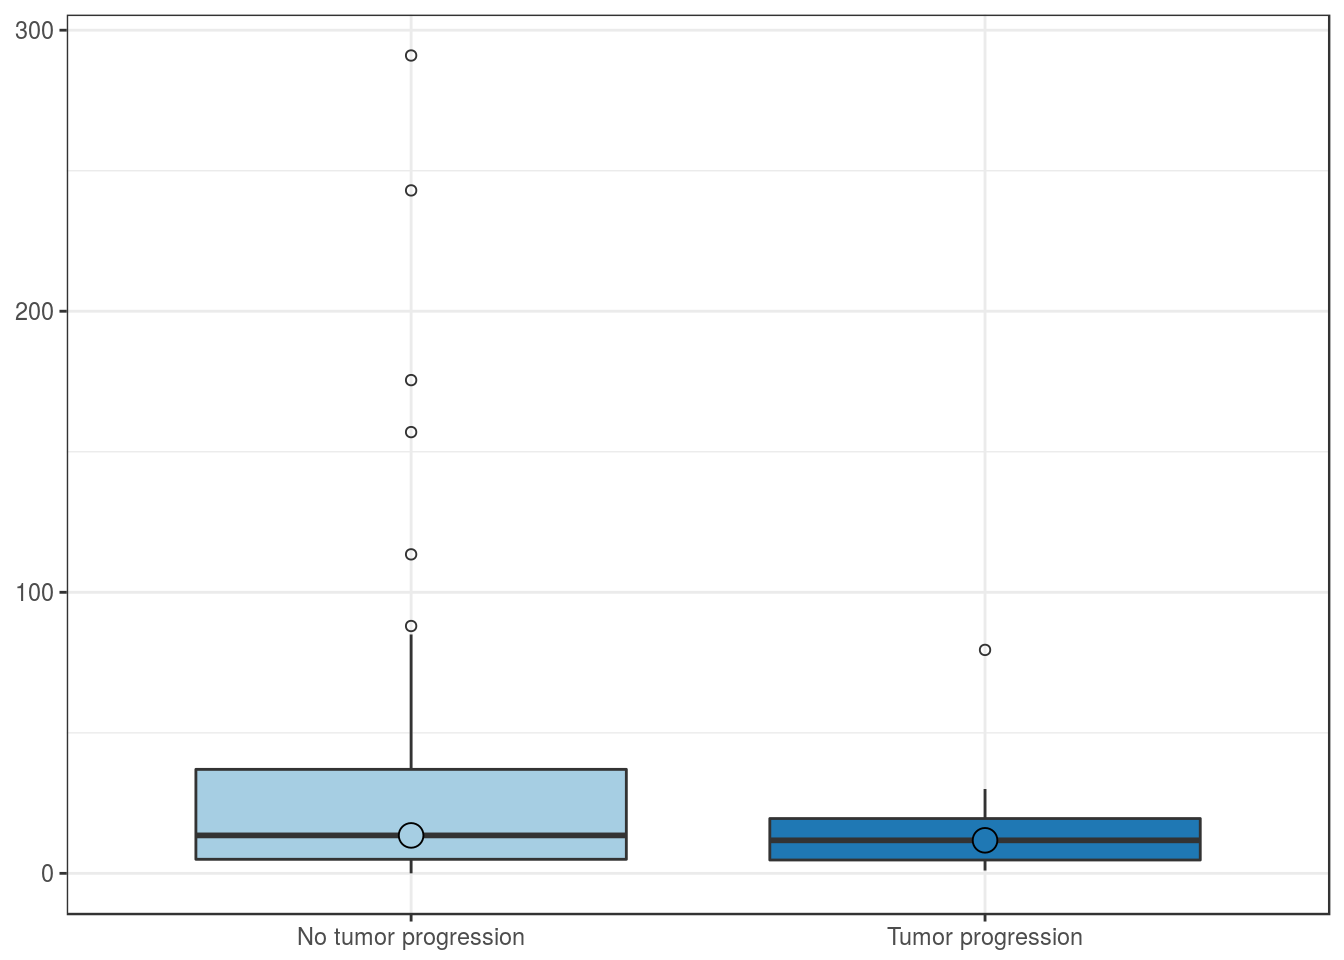
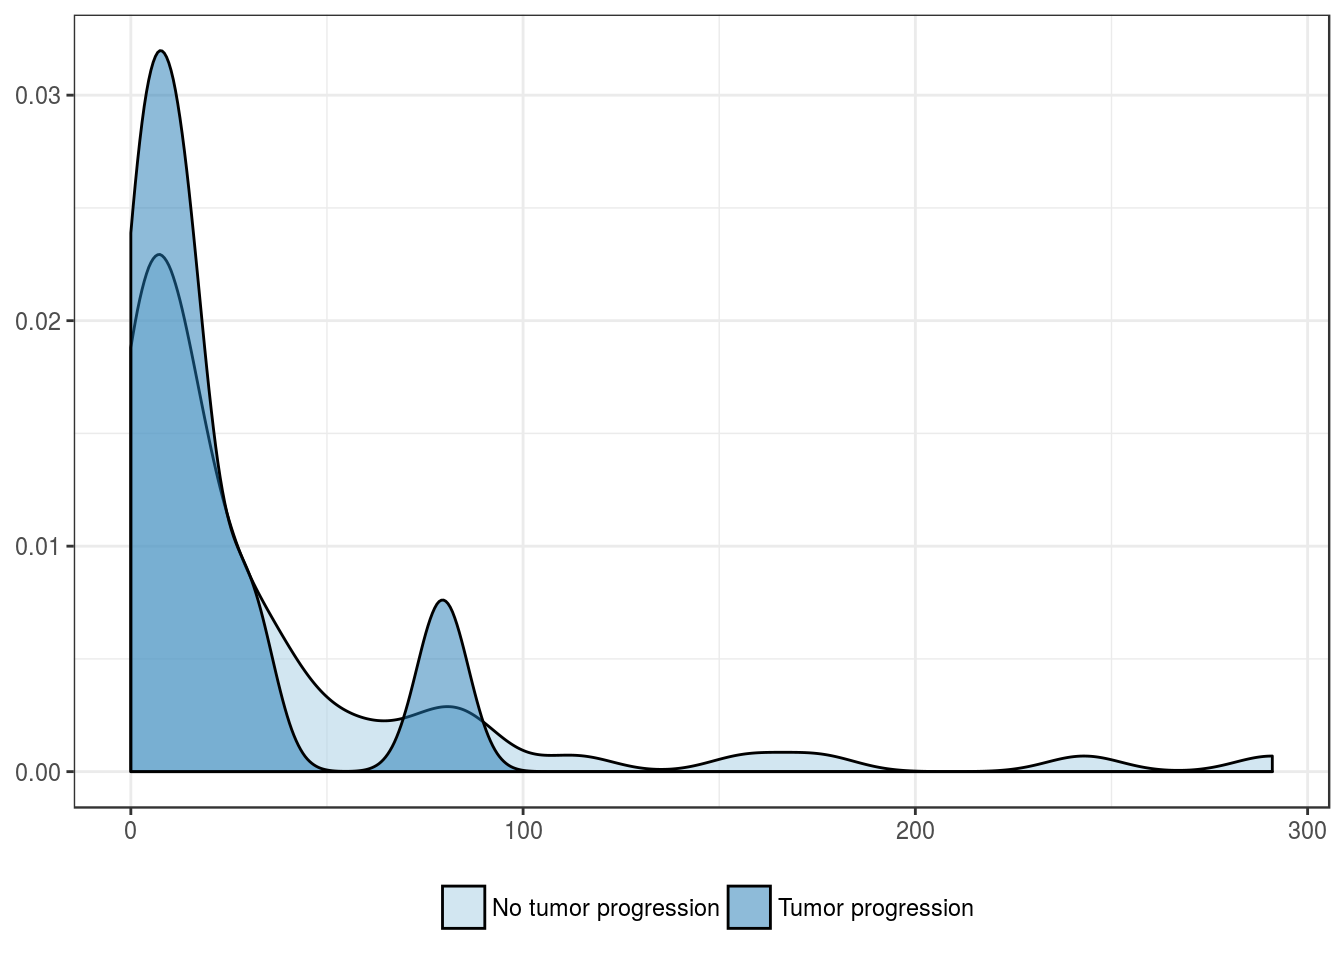
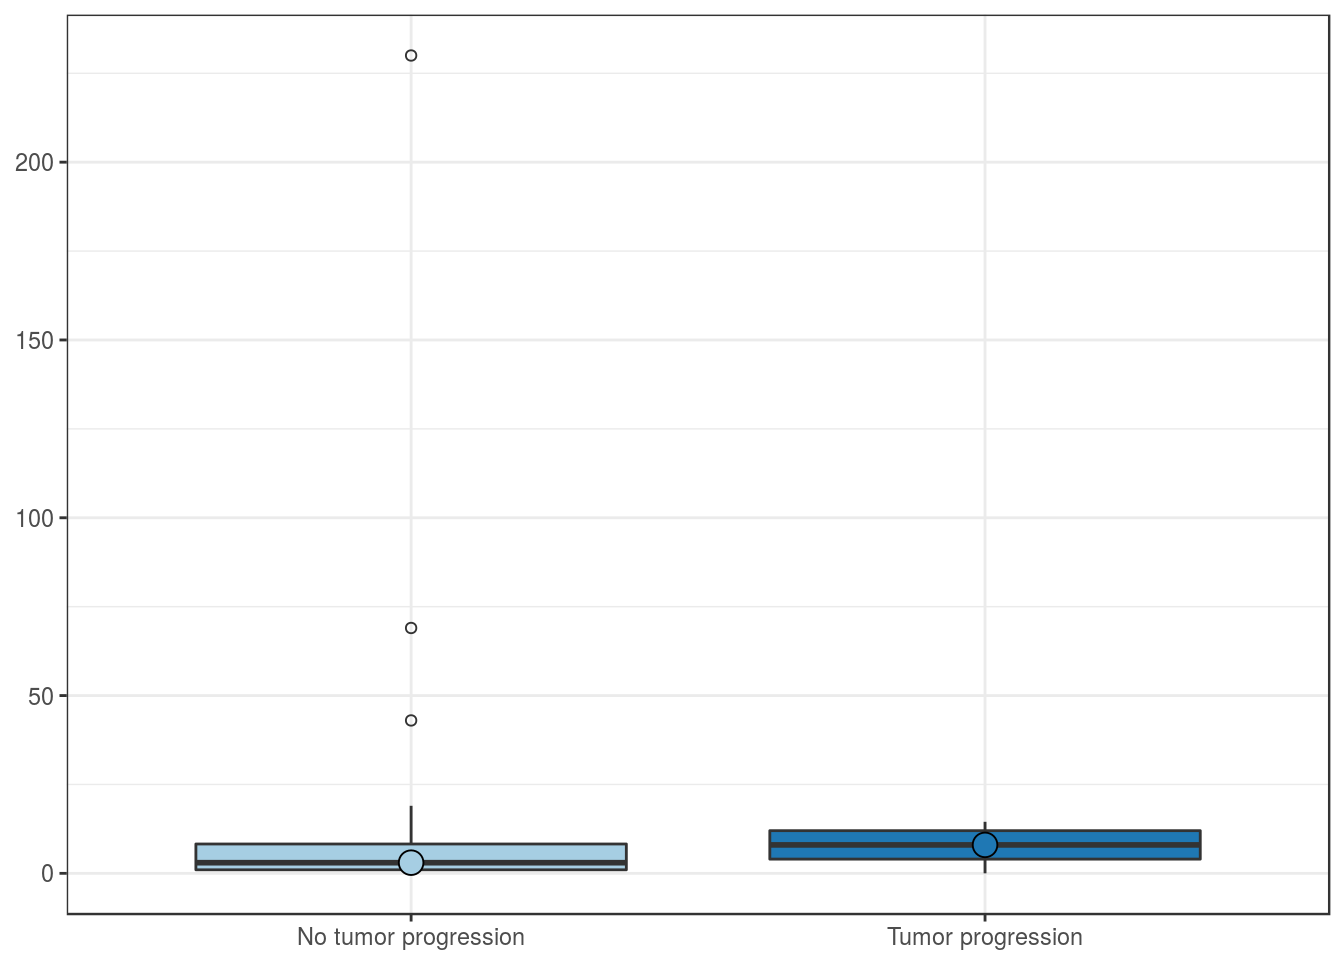
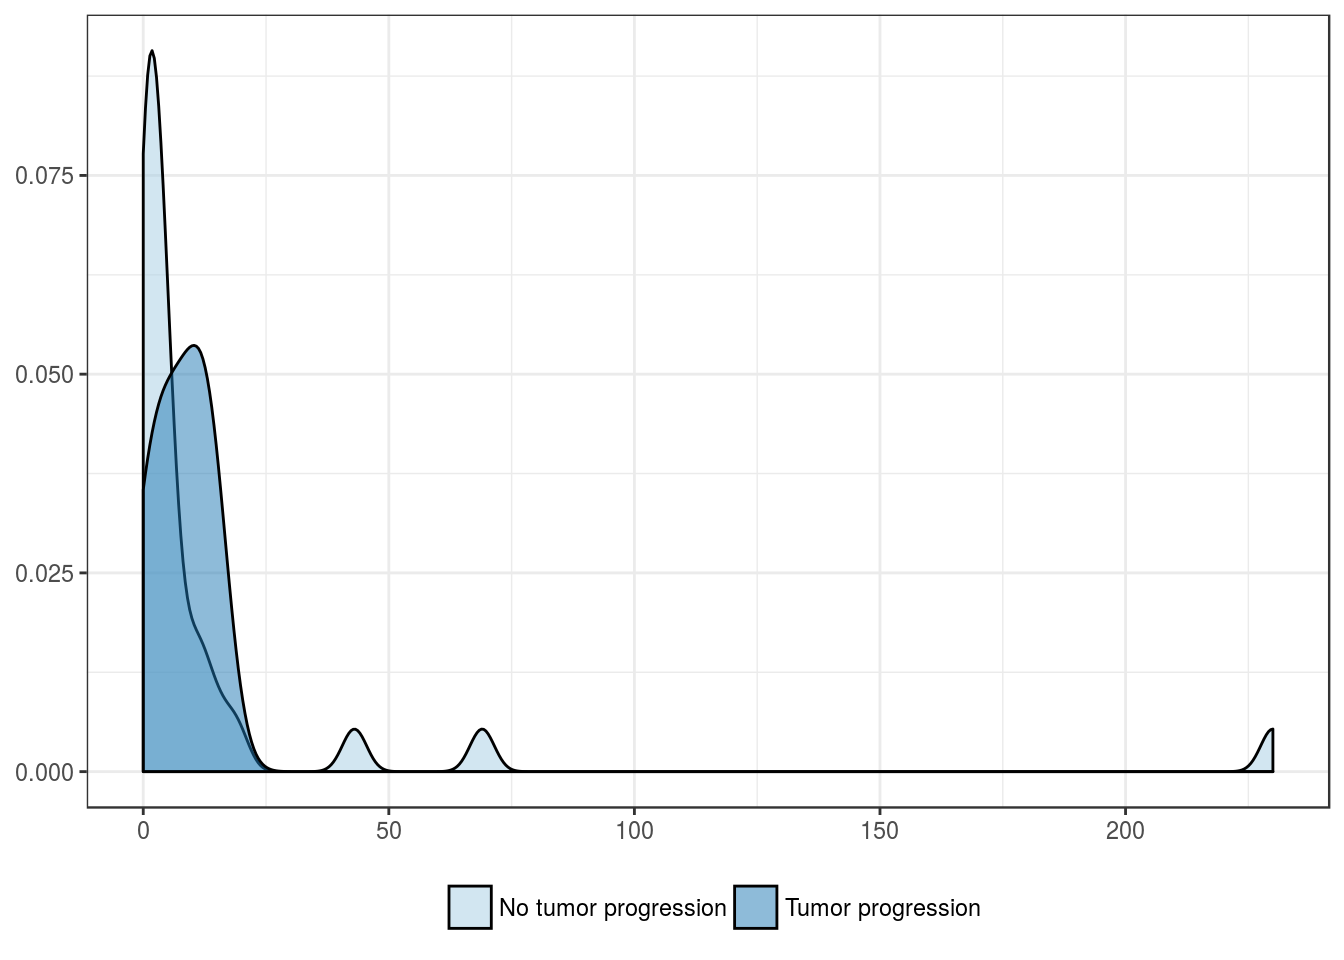
Tumor progression
| No tumor progression | Tumor progression | |
|---|---|---|
| Mean | 35.0 | 19.6 |
| Standard deviation | 56.6 | 26.0 |
| Median | 13.5 | 11.8 |
| Interquartile range | 32.0 | 14.8 |
| Minimum | 0.0 | 1.0 |
| Maximum | 291.0 | 79.5 |
| Value | |
|---|---|
| U-statistic | 270 |
| P statistic | 6.4e-01 |
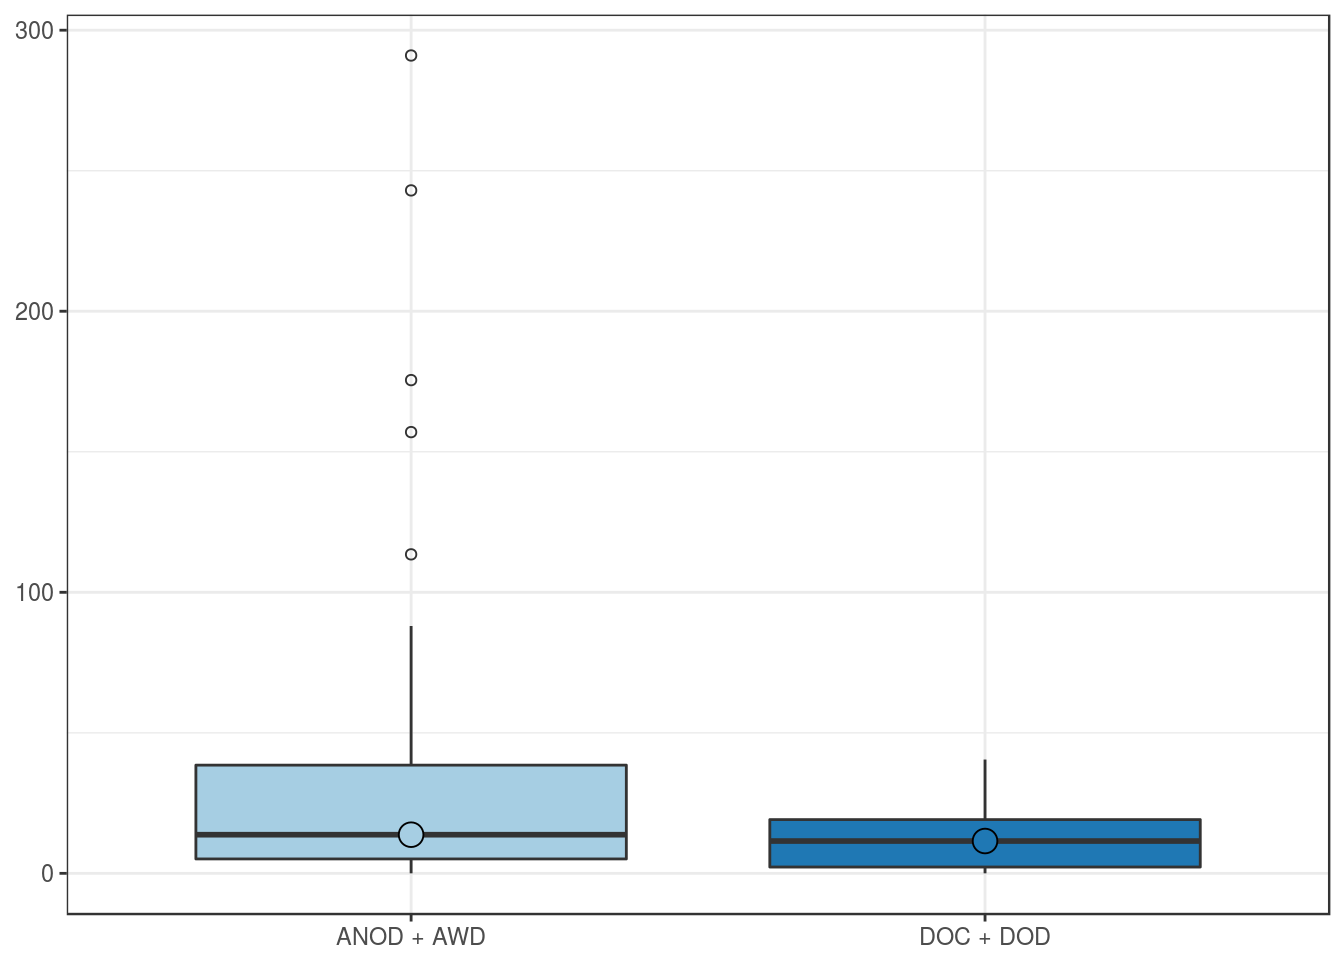
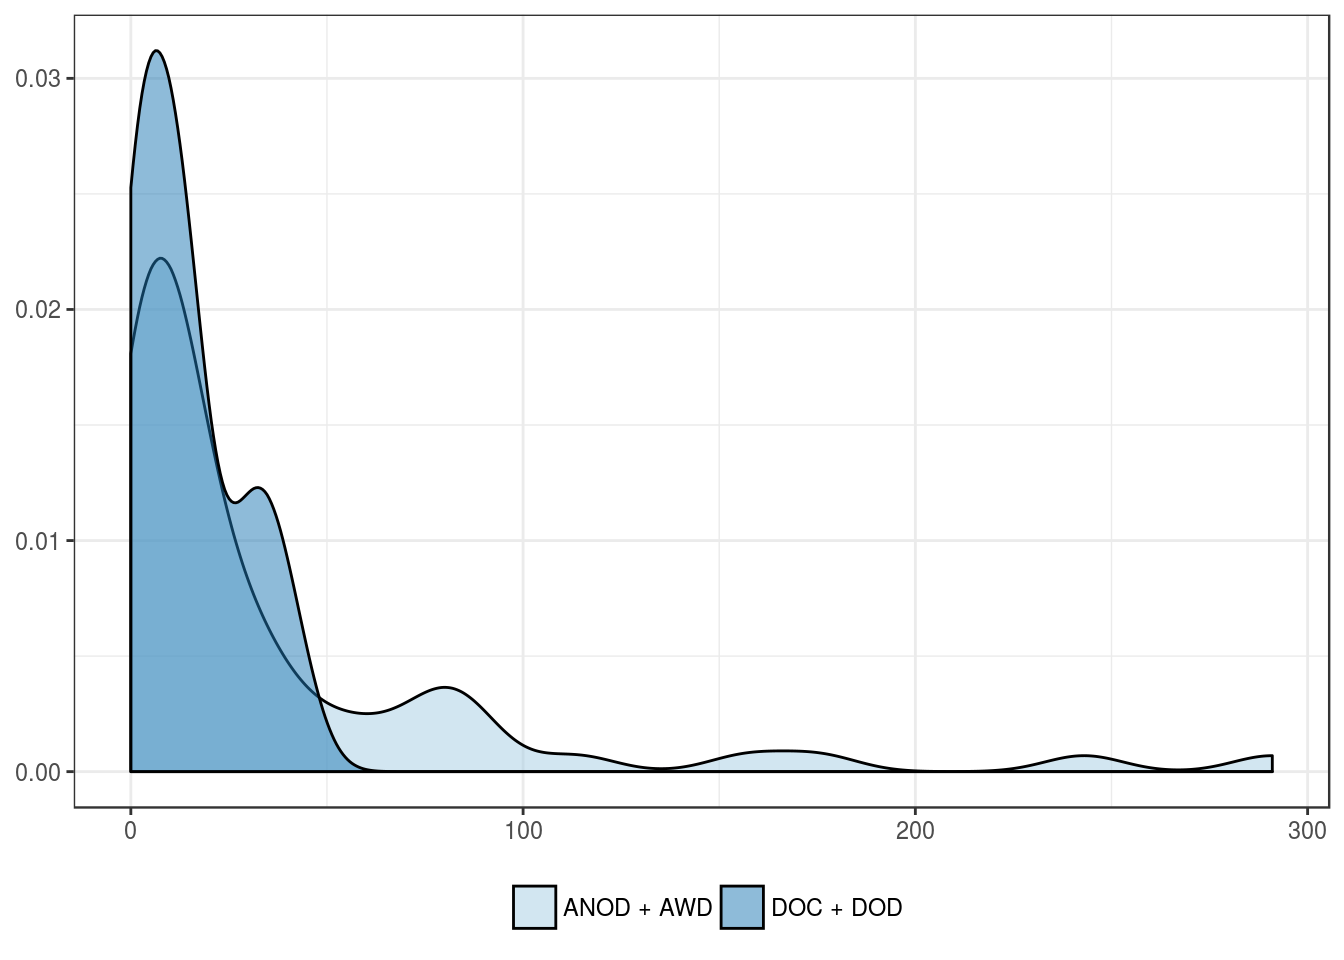
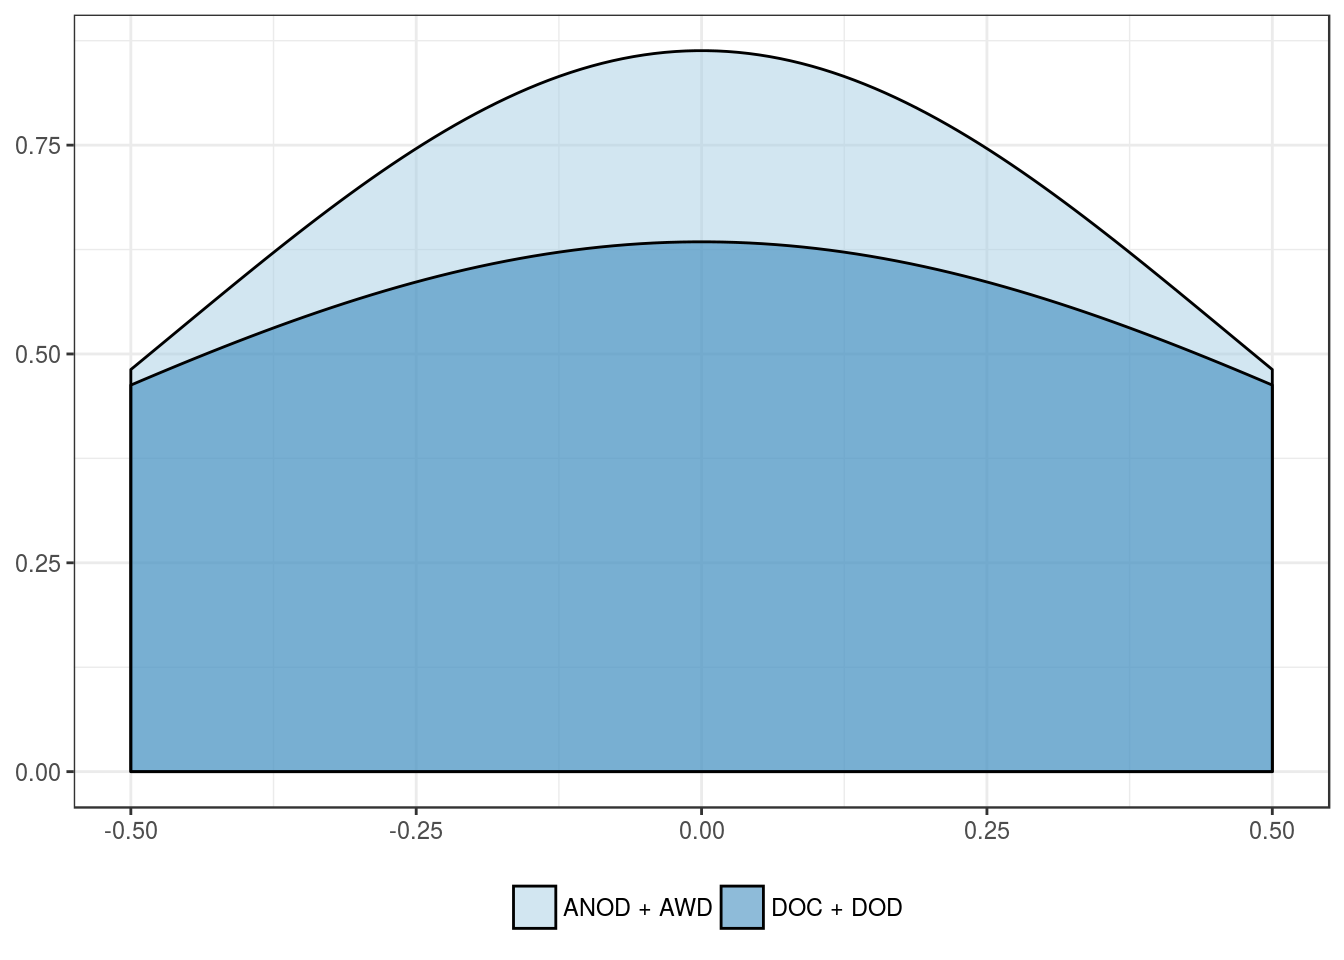
Overall mortality
| ANOD + AWD | DOC + DOD | |
|---|---|---|
| Mean | 36.8 | 14.0 |
| Standard deviation | 58.0 | 13.6 |
| Median | 13.8 | 11.5 |
| Interquartile range | 33.4 | 16.9 |
| Minimum | 0.0 | 0.0 |
| Maximum | 291.0 | 40.5 |
| Value | |
|---|---|
| U-statistic | 416 |
| P statistic | 2.9e-01 |
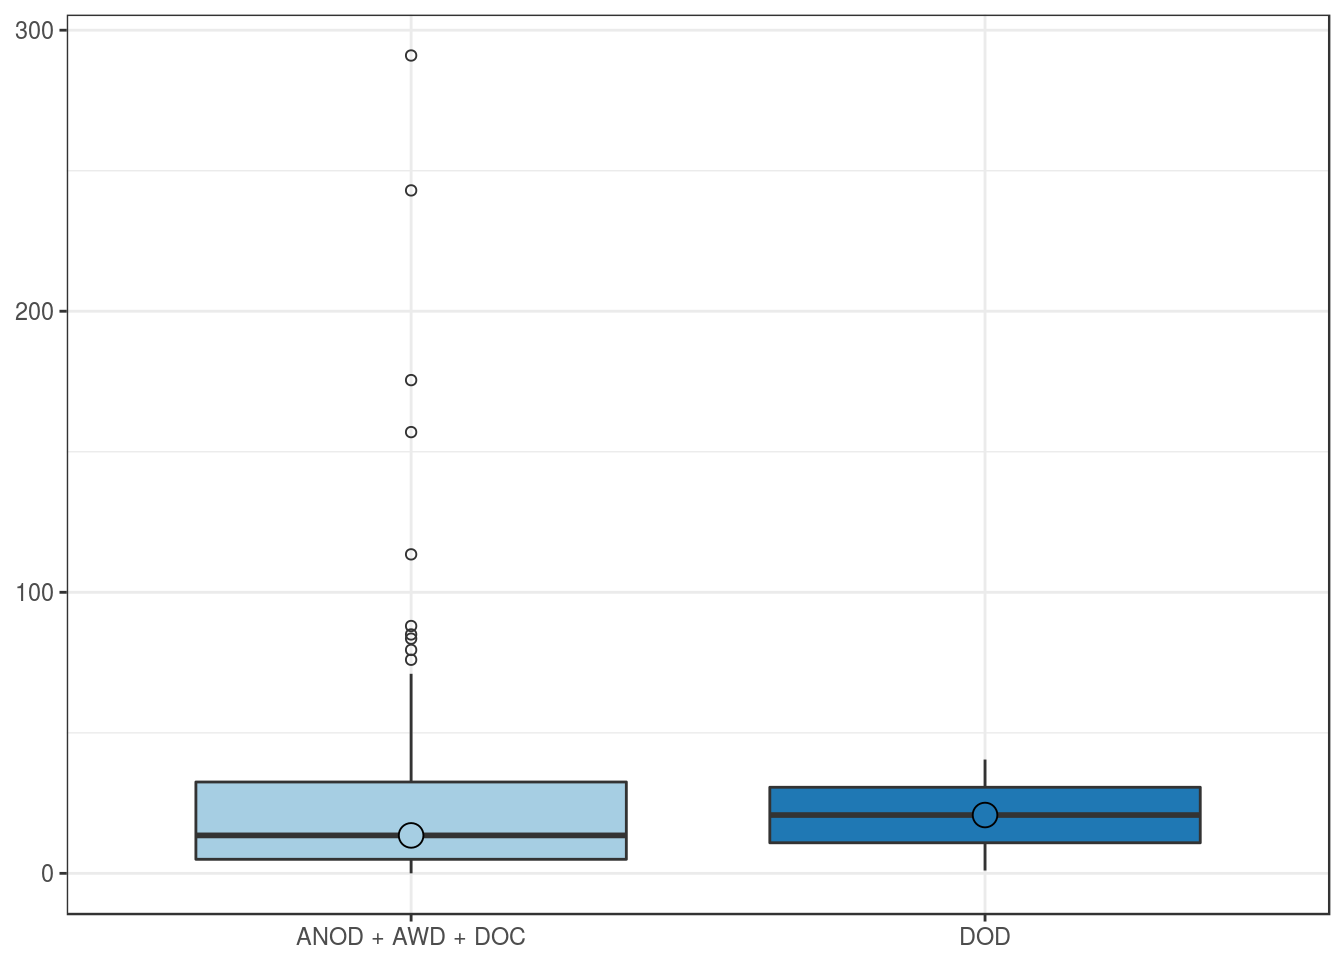
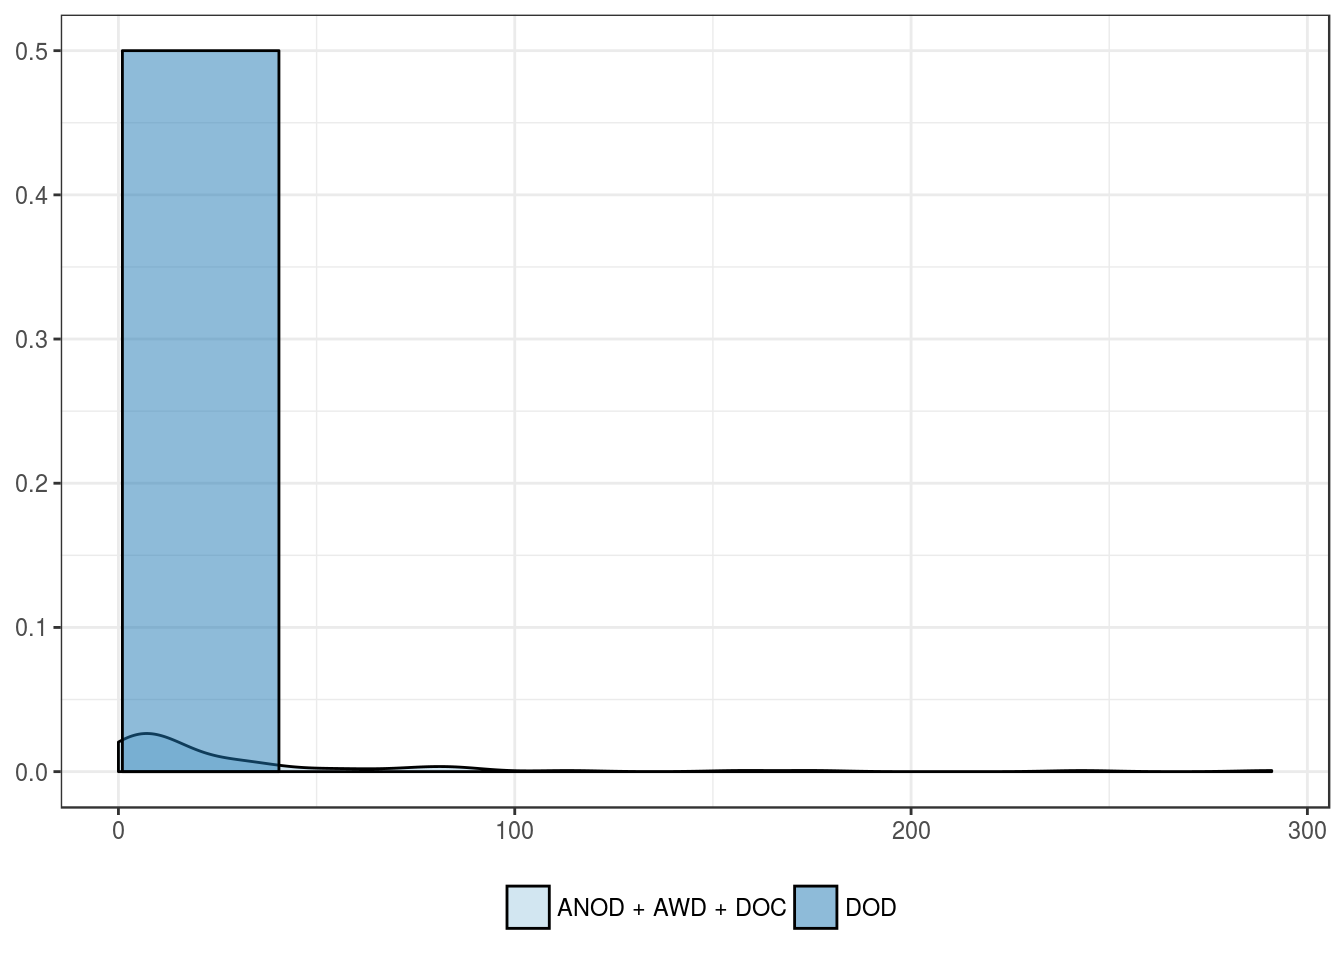
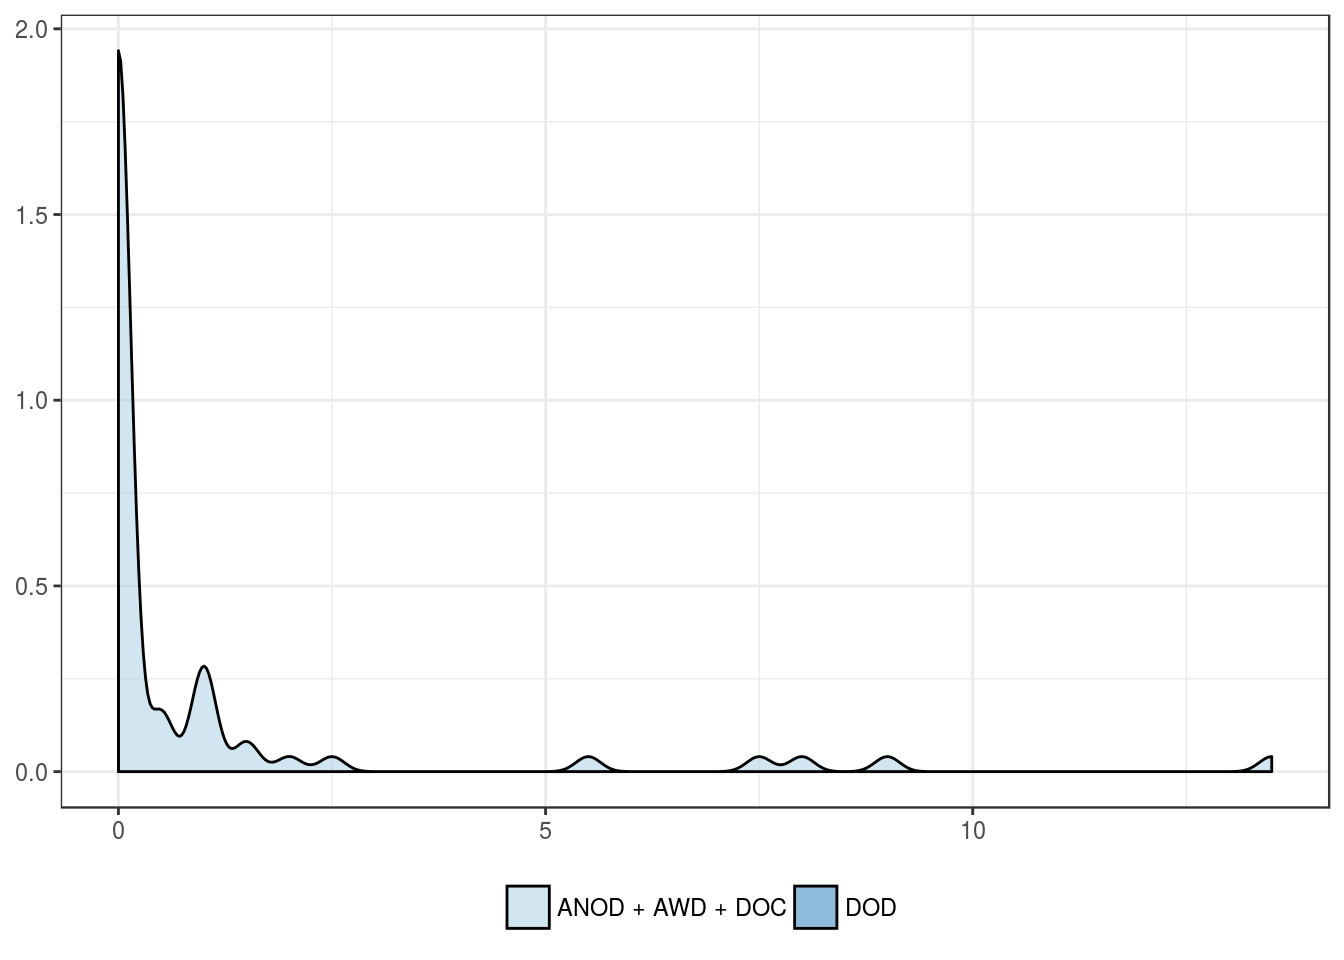
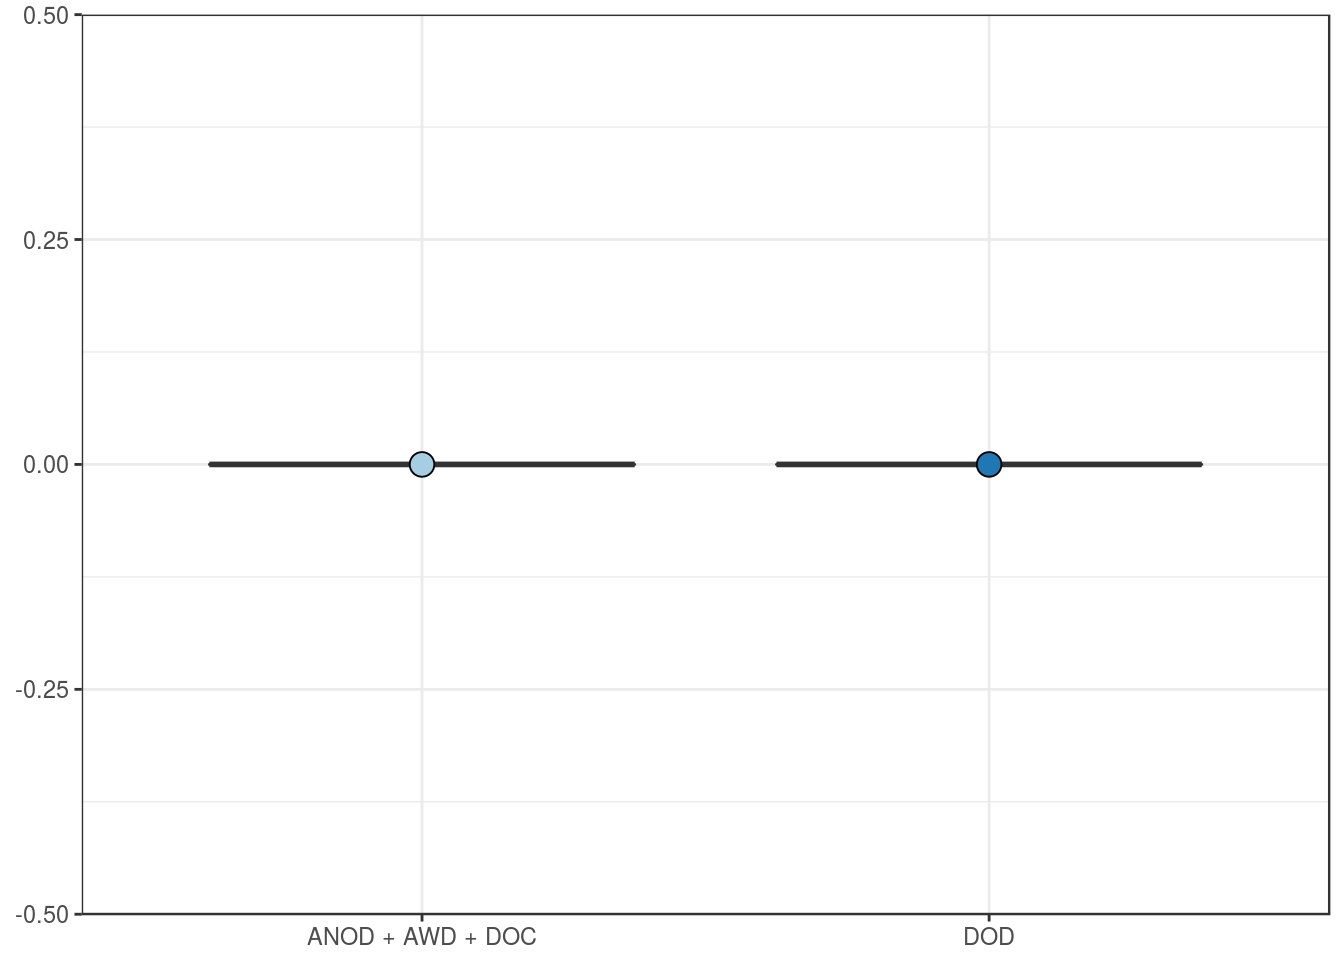
Cancer-related mortality
| ANOD + AWD + DOC | DOD | |
|---|---|---|
| Mean | 33.3 | 20.8 |
| Standard deviation | 54.4 | 27.9 |
| Median | 13.5 | 20.8 |
| Interquartile range | 27.5 | 19.8 |
| Minimum | 0.0 | 1.0 |
| Maximum | 291.0 | 40.5 |
| Value | |
|---|---|
| U-statistic | 76 |
| P statistic | 7.9e-01 |
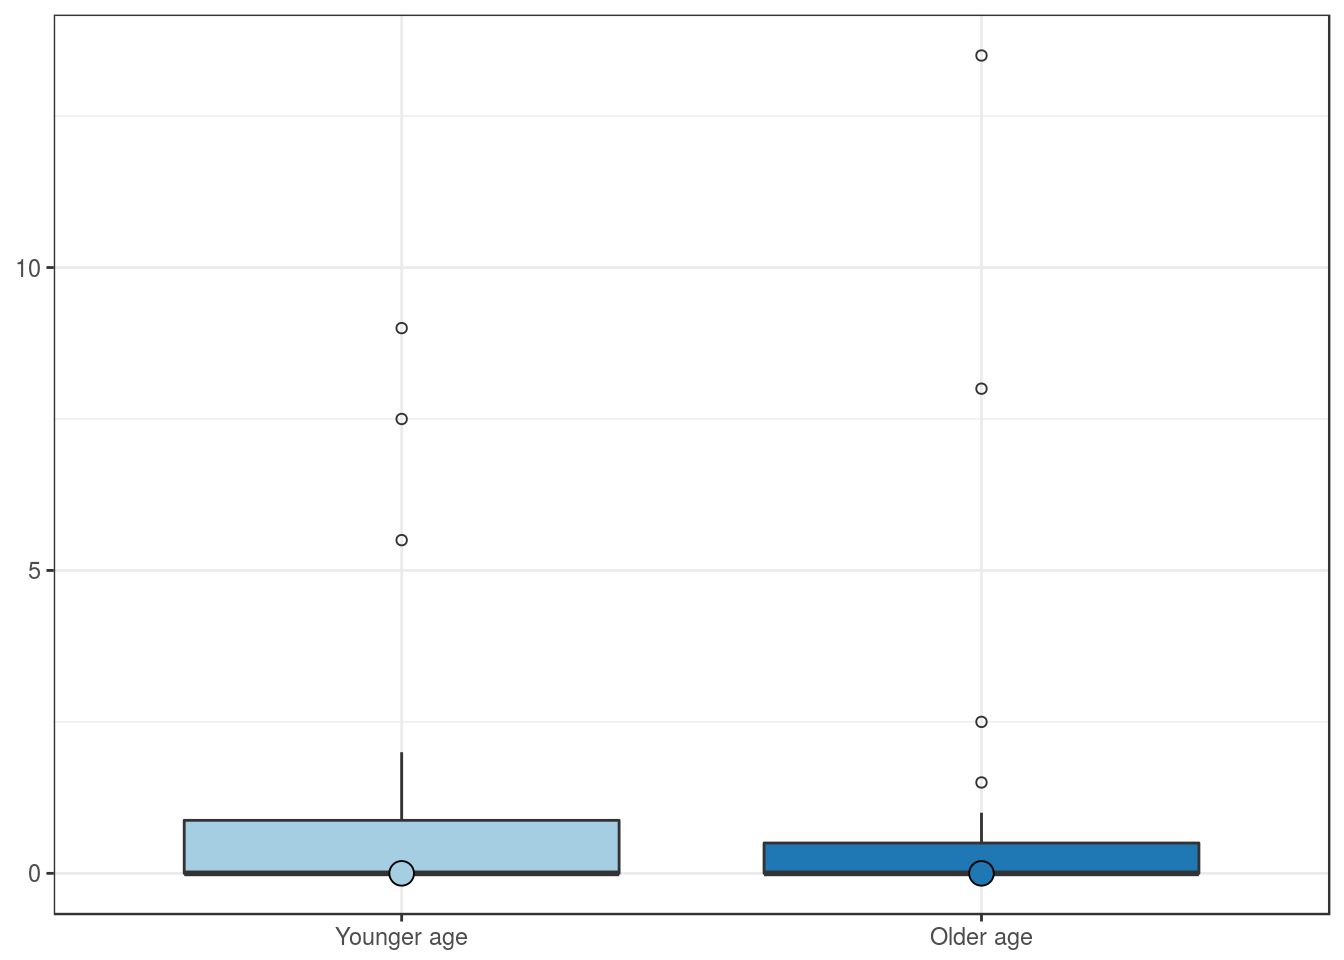
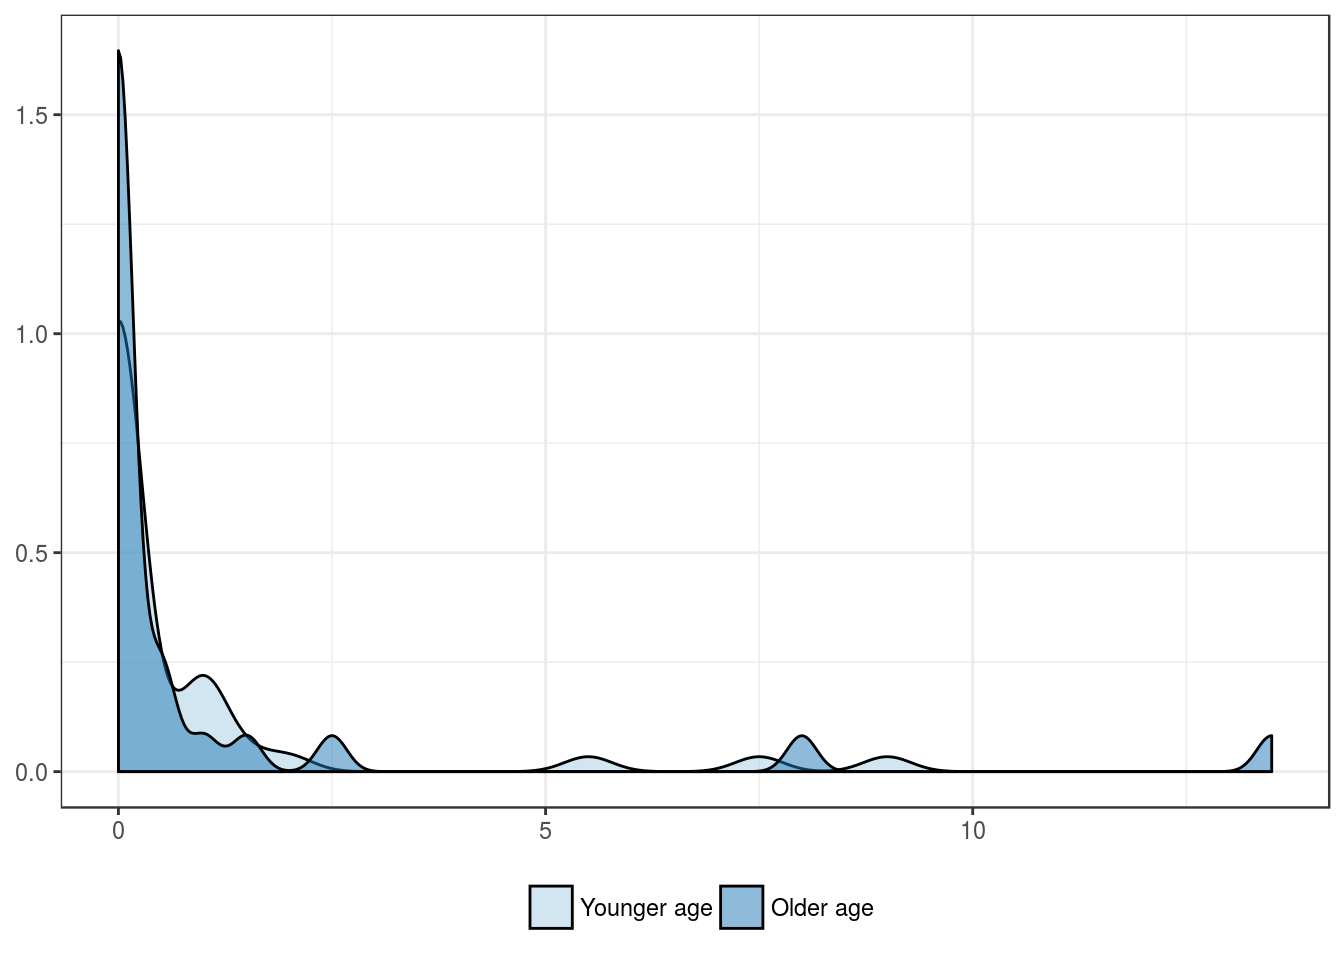
CD8–Ki67 positivity in intratumoral lymphocytes
Clinical features
Patients’ age group, in years
| Younger age | Older age | |
|---|---|---|
| Mean | 0.8 | 1.0 |
| Standard deviation | 1.9 | 2.9 |
| Median | 0.0 | 0.0 |
| Interquartile range | 0.9 | 0.5 |
| Minimum | 0.0 | 0.0 |
| Maximum | 9.0 | 13.5 |
| Value | |
|---|---|
| U-statistic | 591 |
| P statistic | 9.7e-01 |
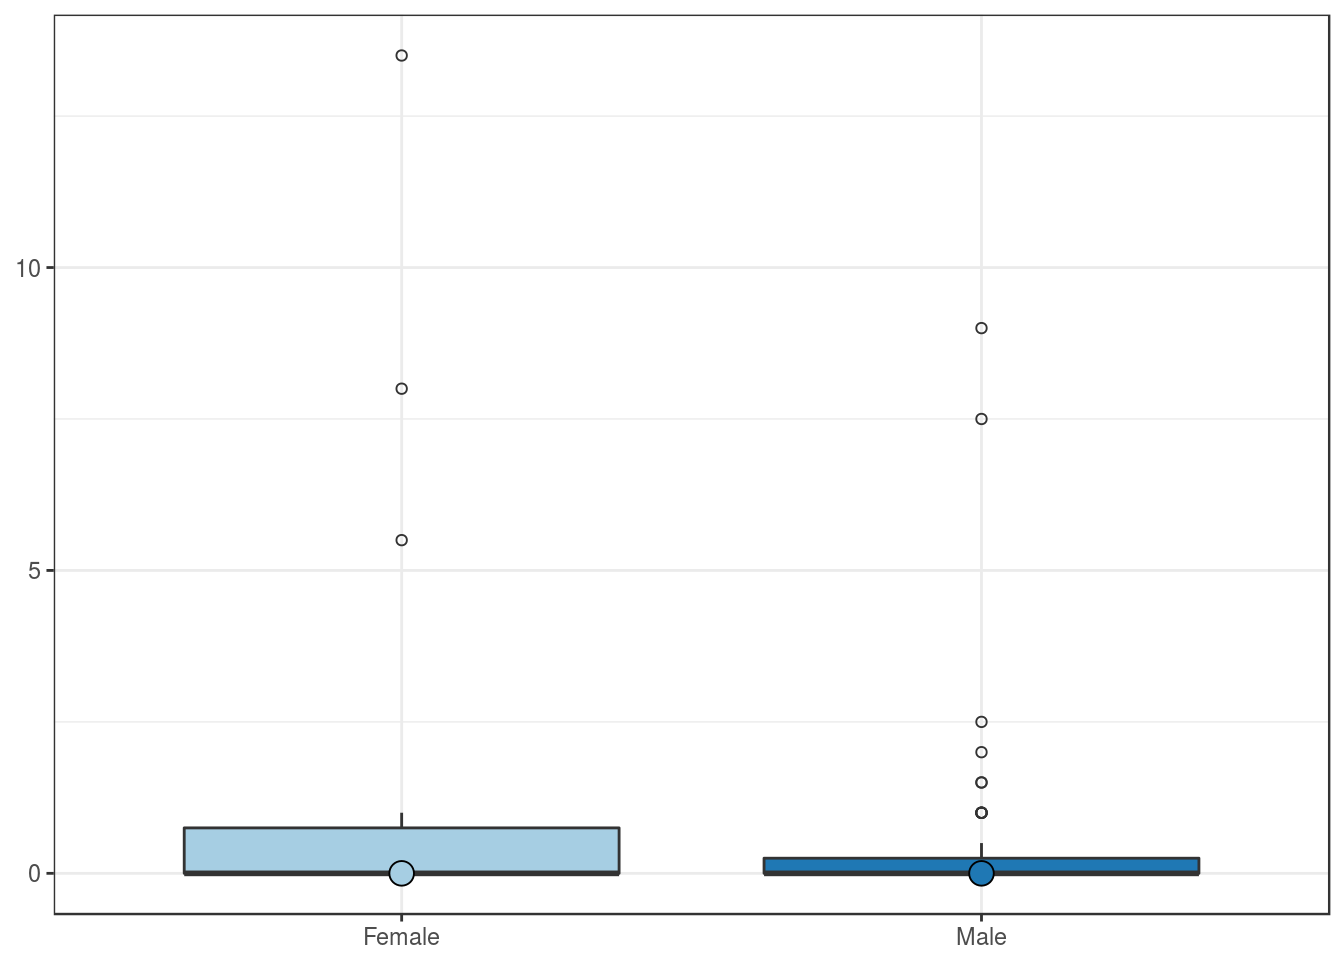
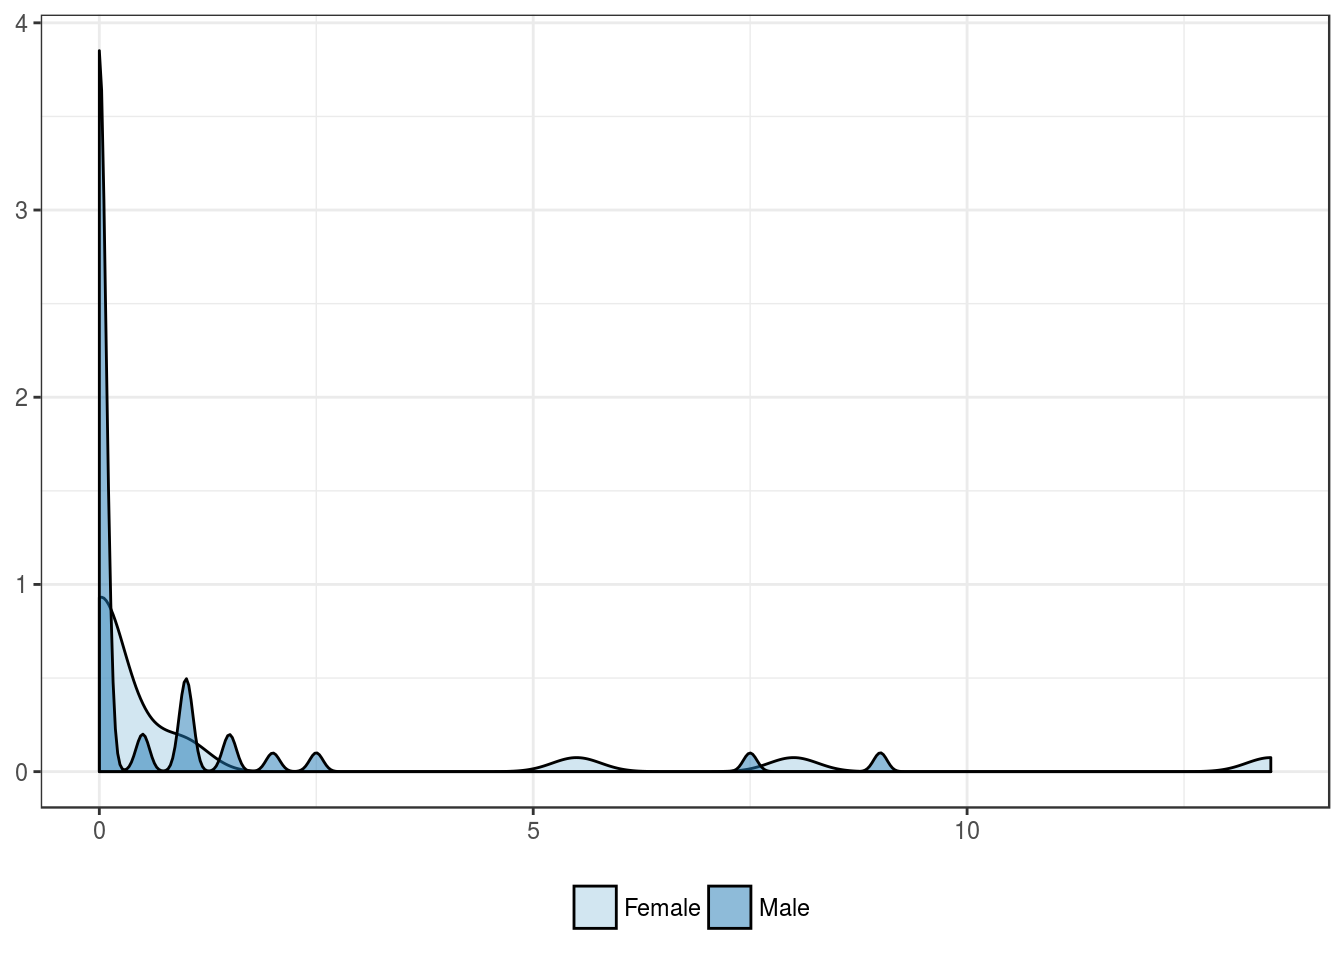
Patients’ sex
| Female | Male | |
|---|---|---|
| Mean | 1.6 | 0.6 |
| Standard deviation | 3.6 | 1.7 |
| Median | 0.0 | 0.0 |
| Interquartile range | 0.8 | 0.2 |
| Minimum | 0.0 | 0.0 |
| Maximum | 13.5 | 9.0 |
| Value | |
|---|---|
| U-statistic | 541 |
| P statistic | 3.5e-01 |
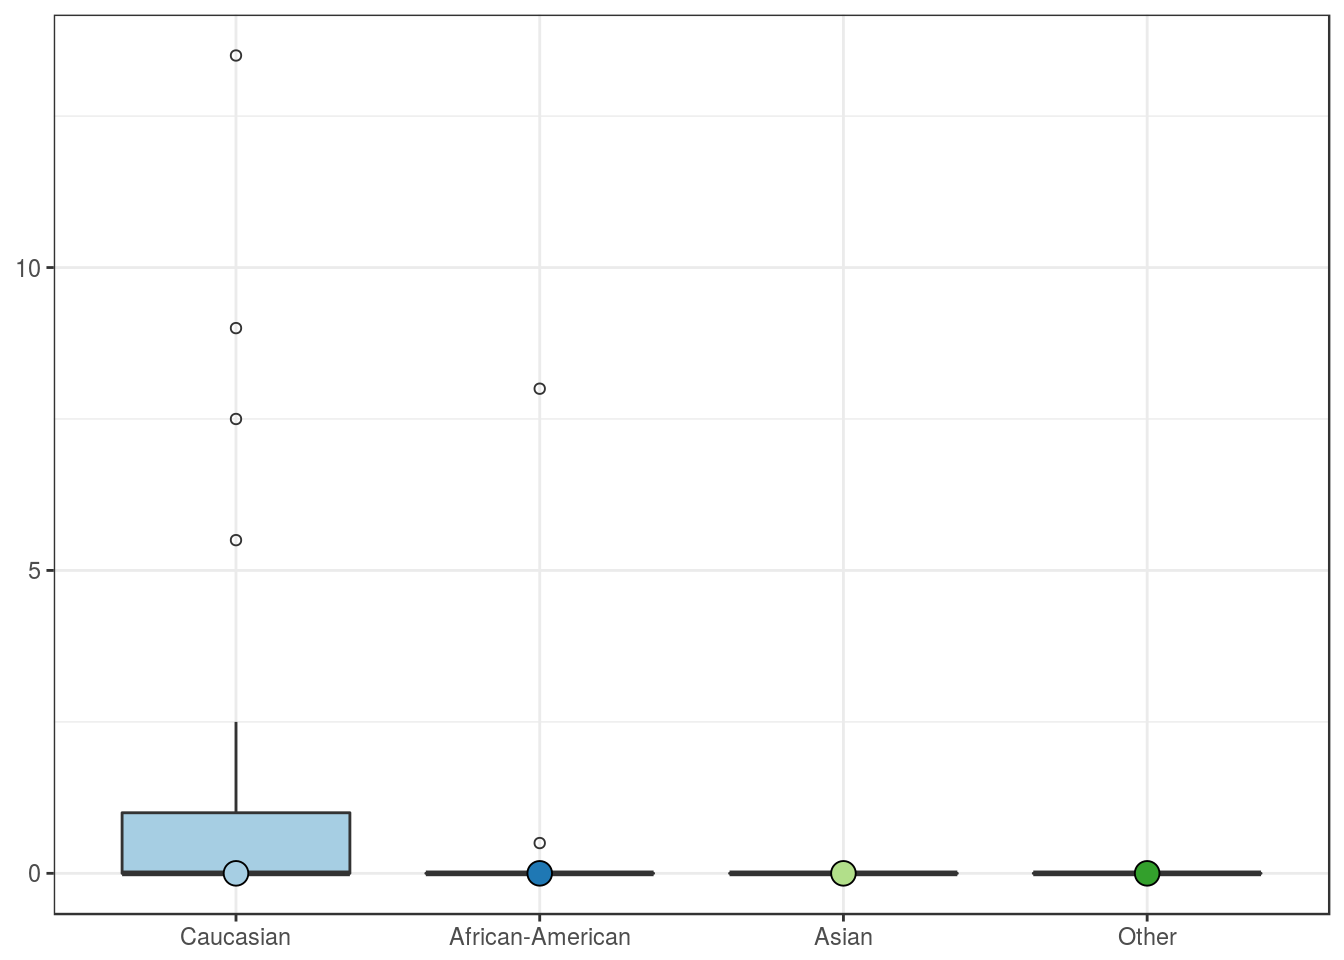
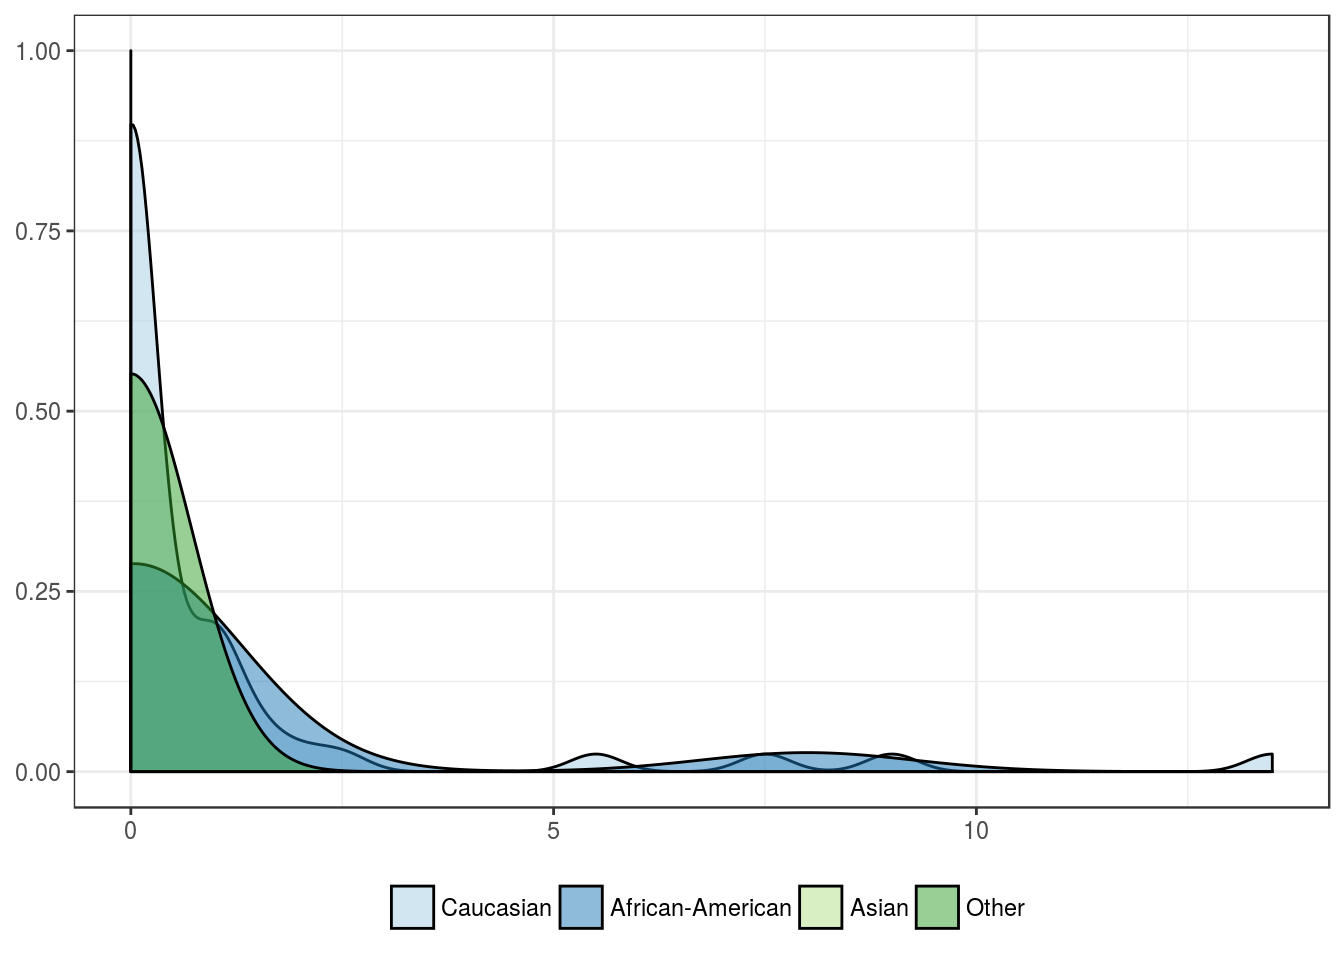
Patients’ race
| Caucasian | African-American | Asian | Other | |
|---|---|---|---|---|
| Mean | 1.0 | 0.7 | 0 | 0 |
| Standard deviation | 2.5 | 2.3 | NA | 0 |
| Median | 0.0 | 0.0 | 0 | 0 |
| Interquartile range | 1.0 | 0.0 | 0 | 0 |
| Minimum | 0.0 | 0.0 | 0 | 0 |
| Maximum | 13.5 | 8.0 | 0 | 0 |
| Value | |
|---|---|
| Statistic | 2.908 |
| Parameter | 3 |
| P statistic | 0.41 |
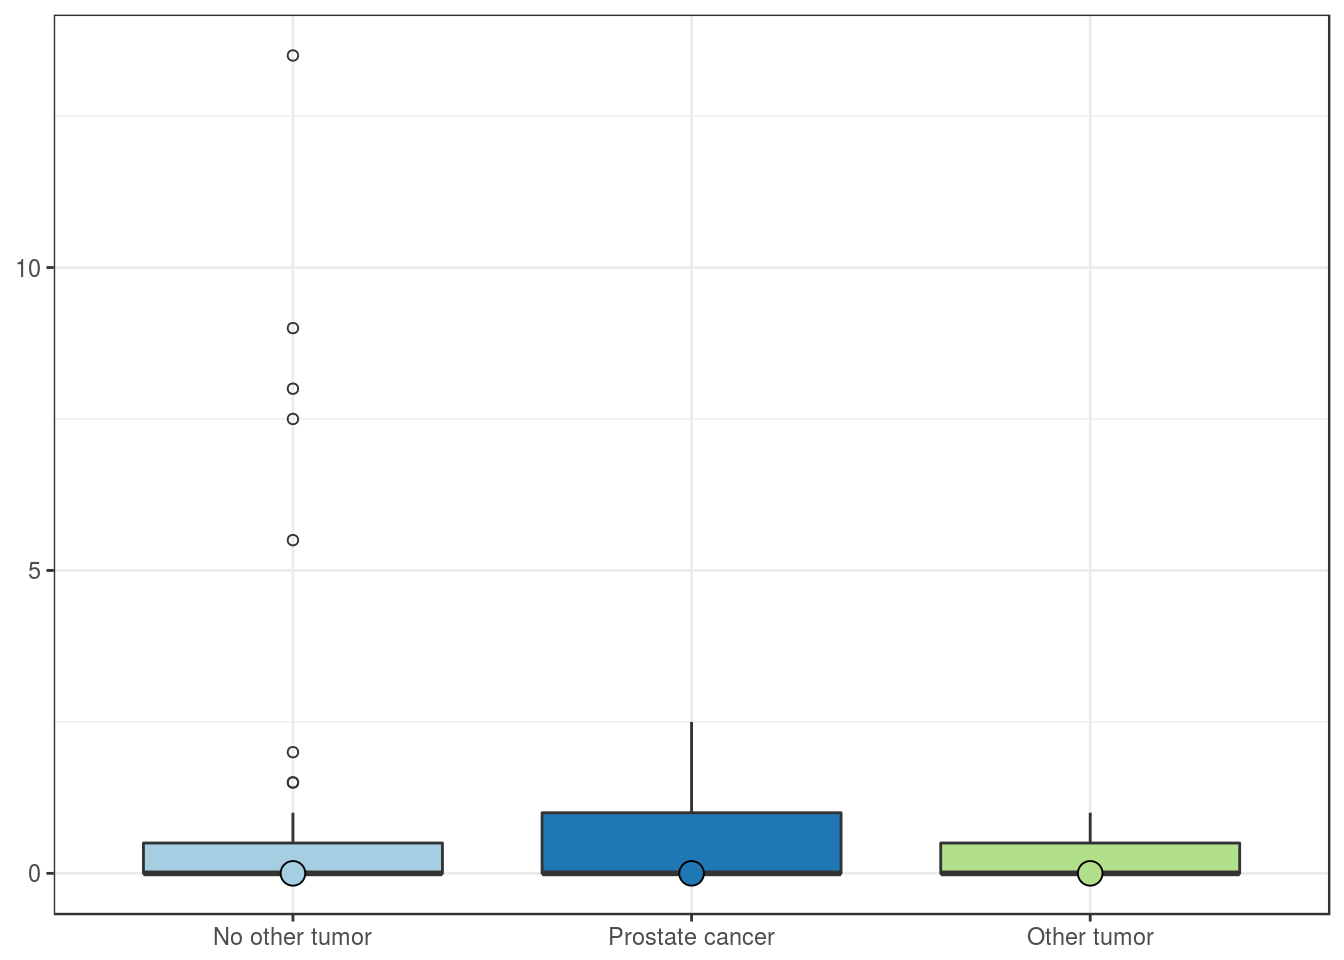
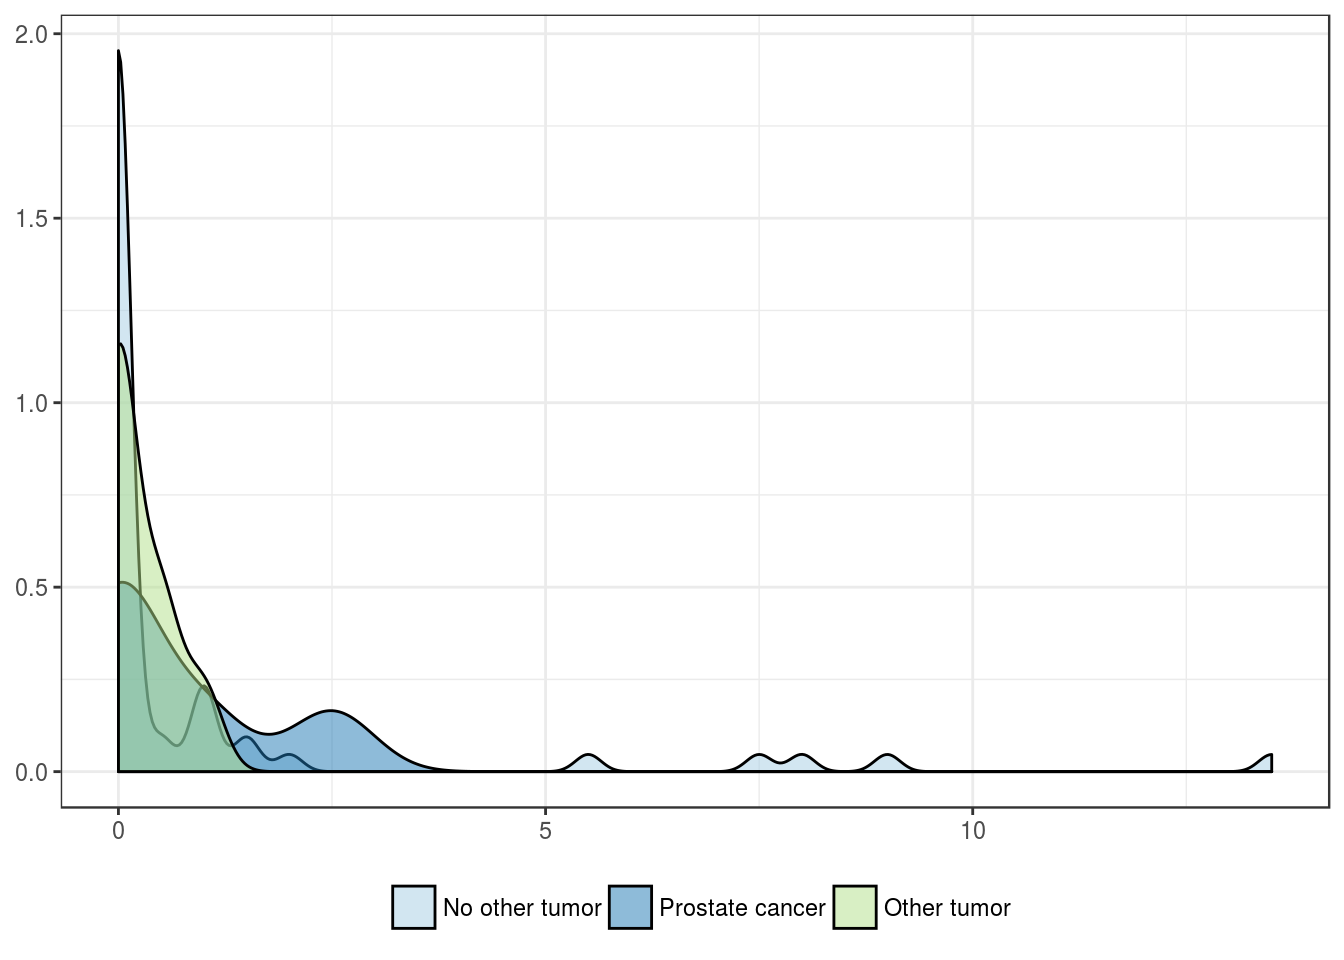
History of other malignancies
| No other tumor | Prostate cancer | Other tumor | |
|---|---|---|---|
| Mean | 1.0 | 0.7 | 0.2 |
| Standard deviation | 2.6 | 1.1 | 0.4 |
| Median | 0.0 | 0.0 | 0.0 |
| Interquartile range | 0.5 | 1.0 | 0.5 |
| Minimum | 0.0 | 0.0 | 0.0 |
| Maximum | 13.5 | 2.5 | 1.0 |
| Value | |
|---|---|
| Statistic | 0.4427 |
| Parameter | 2 |
| P statistic | 0.8 |
Pathologic features
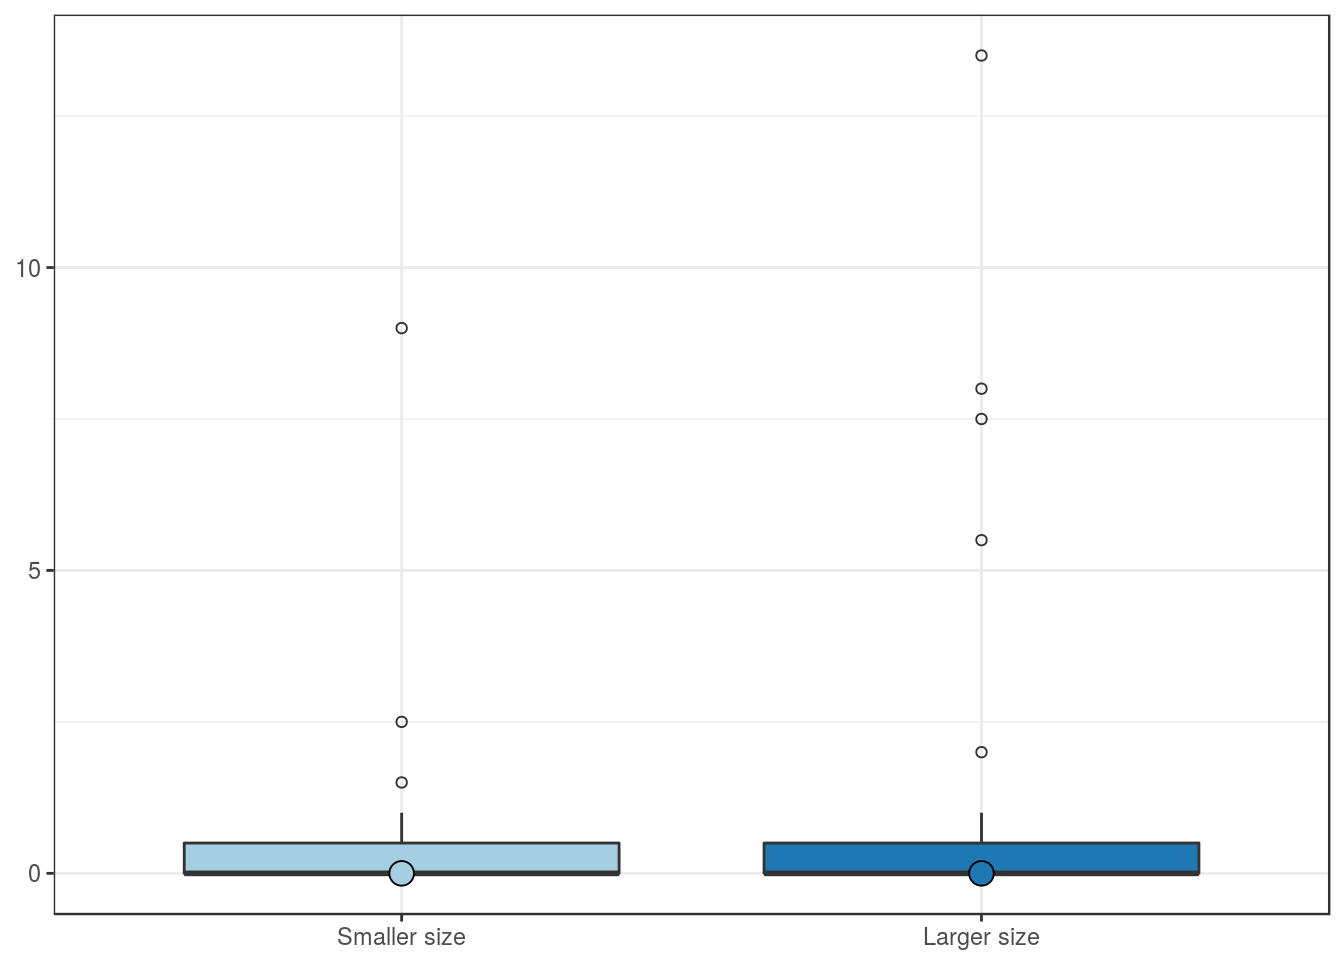
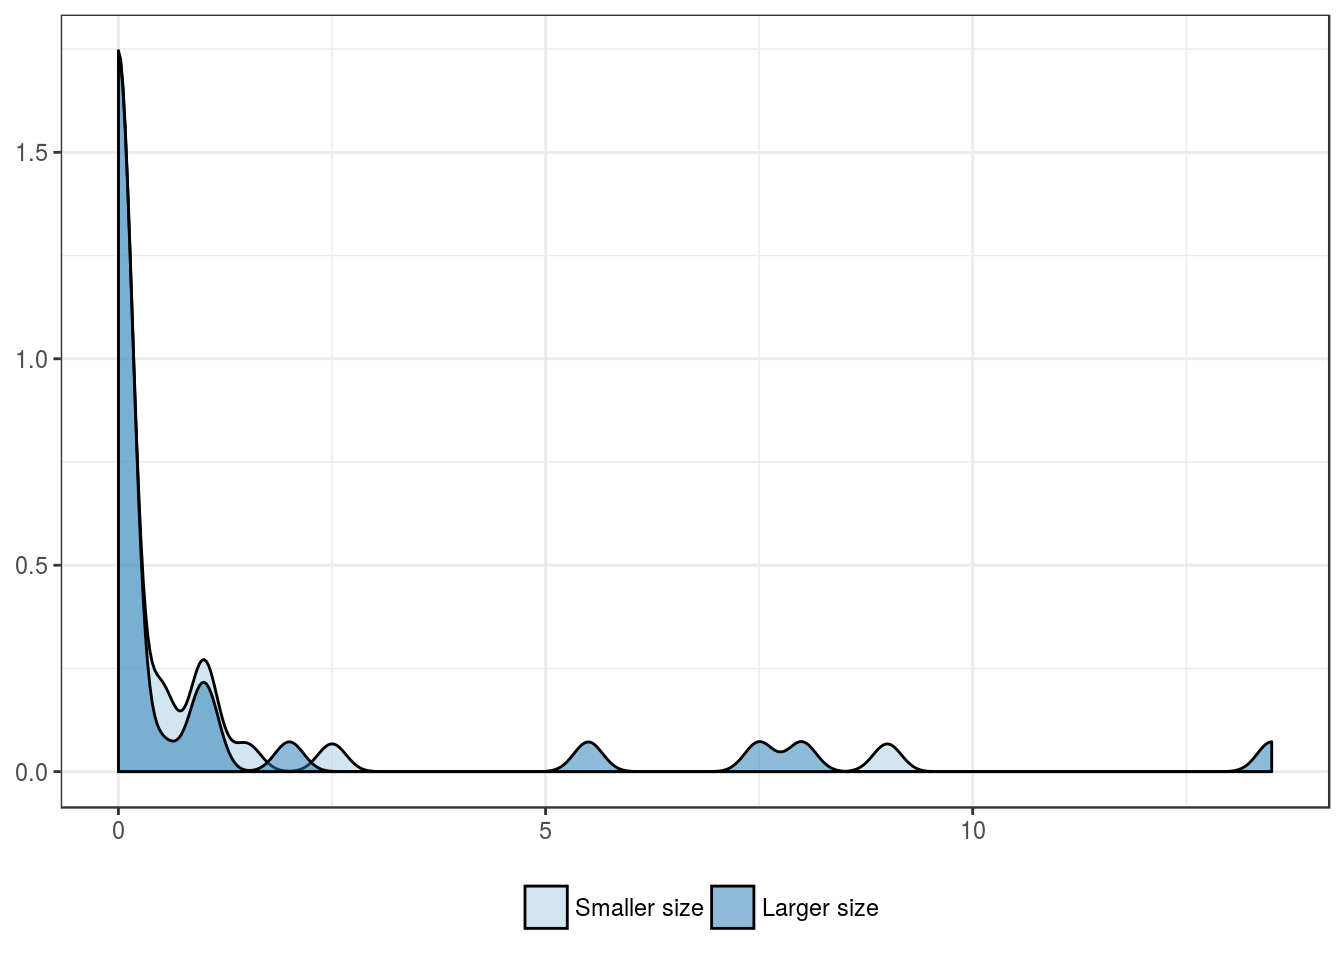
Tumor size group
| Smaller size | Larger size | |
|---|---|---|
| Mean | 0.5 | 1.2 |
| Standard deviation | 1.6 | 3.0 |
| Median | 0.0 | 0.0 |
| Interquartile range | 0.5 | 0.5 |
| Minimum | 0.0 | 0.0 |
| Maximum | 9.0 | 13.5 |
| Value | |
|---|---|
| U-statistic | 580 |
| P statistic | 8.4e-01 |
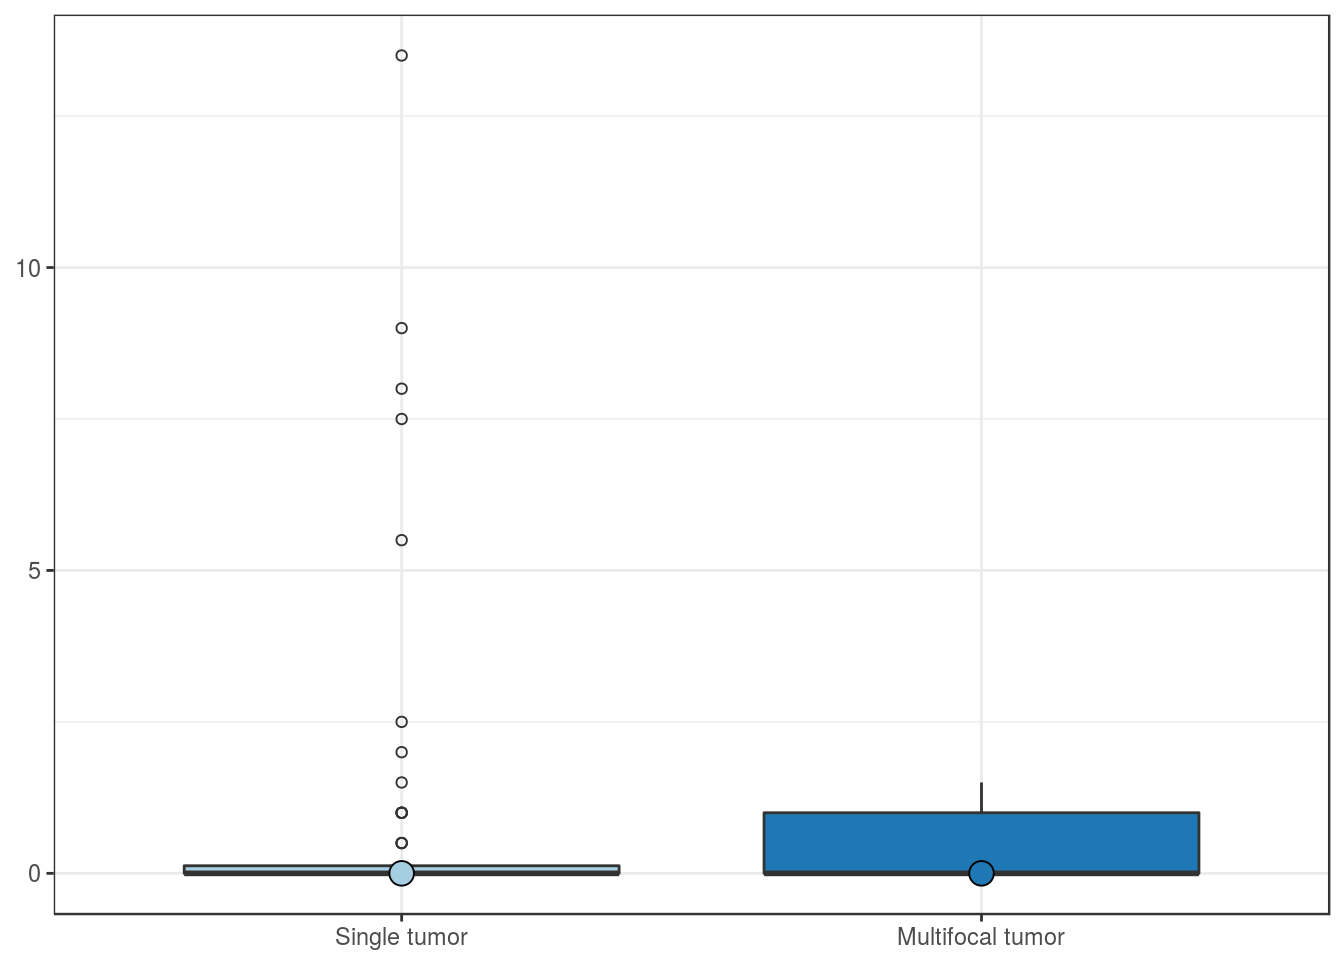
Multifocality
| Single tumor | Multifocal tumor | |
|---|---|---|
| Mean | 0.9 | 0.4 |
| Standard deviation | 2.5 | 0.6 |
| Median | 0.0 | 0.0 |
| Interquartile range | 0.1 | 1.0 |
| Minimum | 0.0 | 0.0 |
| Maximum | 13.5 | 1.5 |
| Value | |
|---|---|
| U-statistic | 228 |
| P statistic | 3.5e-01 |
Fuhrman grade
| G1 | G2 | G3 | G4 | |
|---|---|---|---|---|
| Mean | 0 | 0.8 | 1.2 | 0 |
| Standard deviation | 0 | 1.9 | 3.3 | 0 |
| Median | 0 | 0.0 | 0.0 | 0 |
| Interquartile range | 0 | 0.9 | 0.5 | 0 |
| Minimum | 0 | 0.0 | 0.0 | 0 |
| Maximum | 0 | 8.0 | 13.5 | 0 |
| Value | |
|---|---|
| Statistic | 1.648 |
| Parameter | 3 |
| P statistic | 0.65 |
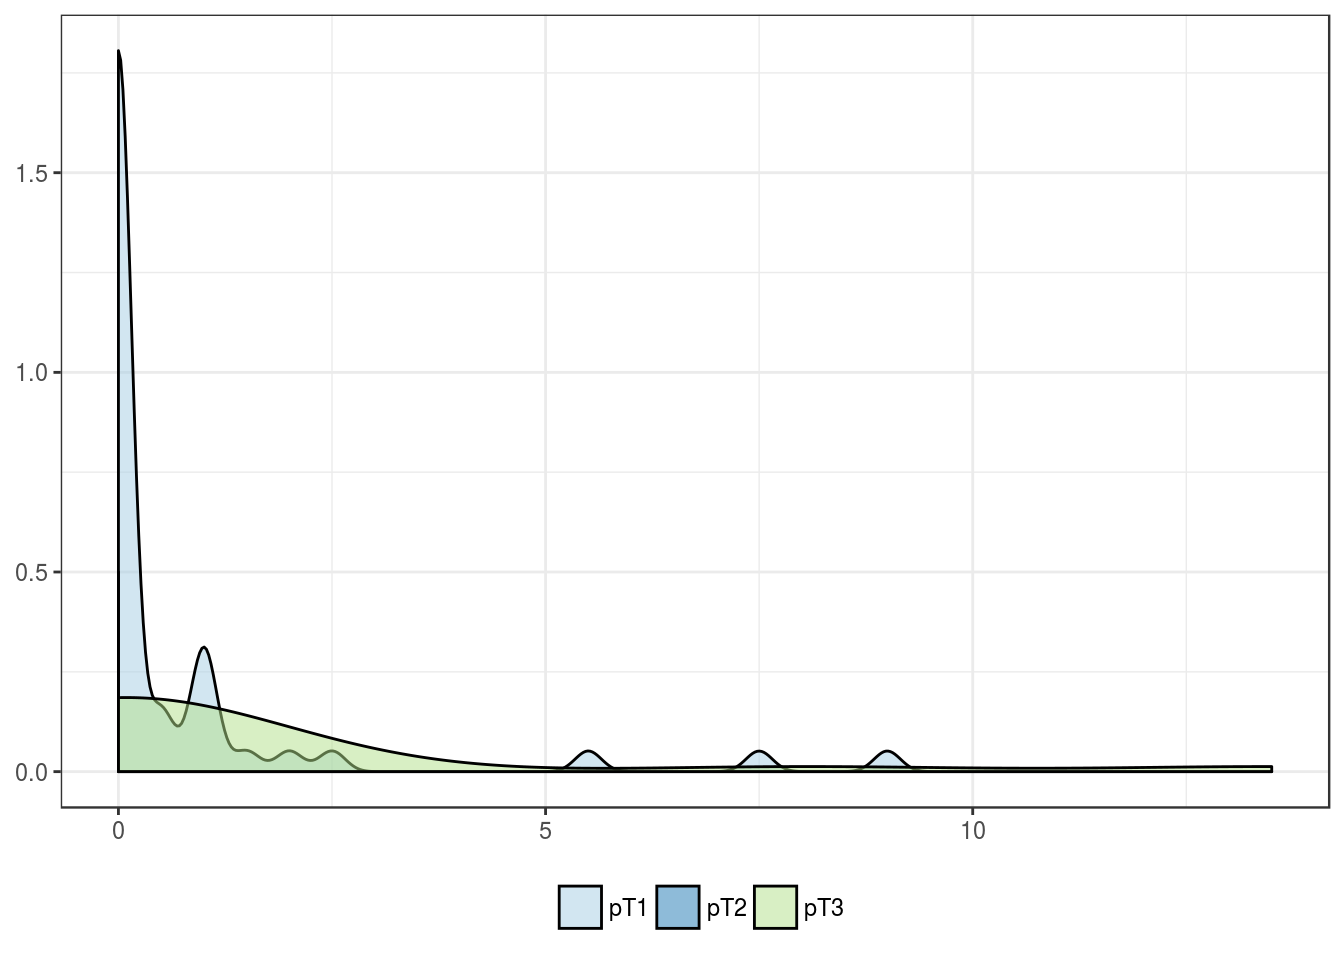
pT stage
| pT1 | pT2 | pT3 | |
|---|---|---|---|
| Mean | 0.7 | 0 | 1.4 |
| Standard deviation | 1.8 | 0 | 3.7 |
| Median | 0.0 | 0 | 0.0 |
| Interquartile range | 0.5 | 0 | 0.0 |
| Minimum | 0.0 | 0 | 0.0 |
| Maximum | 9.0 | 0 | 13.5 |
| Value | |
|---|---|
| Statistic | 0.8977 |
| Parameter | 2 |
| P statistic | 0.64 |
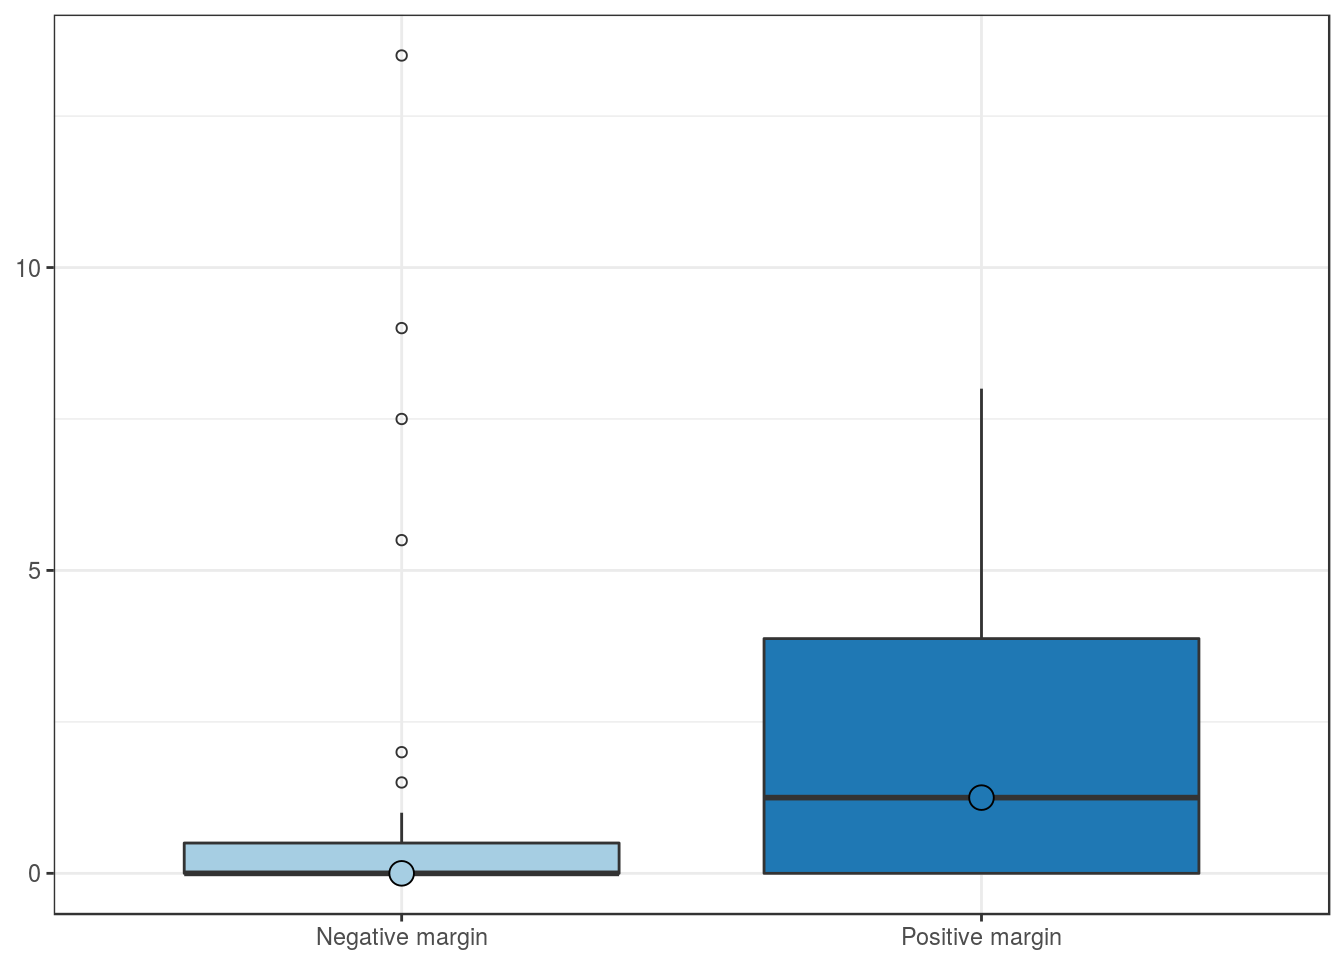
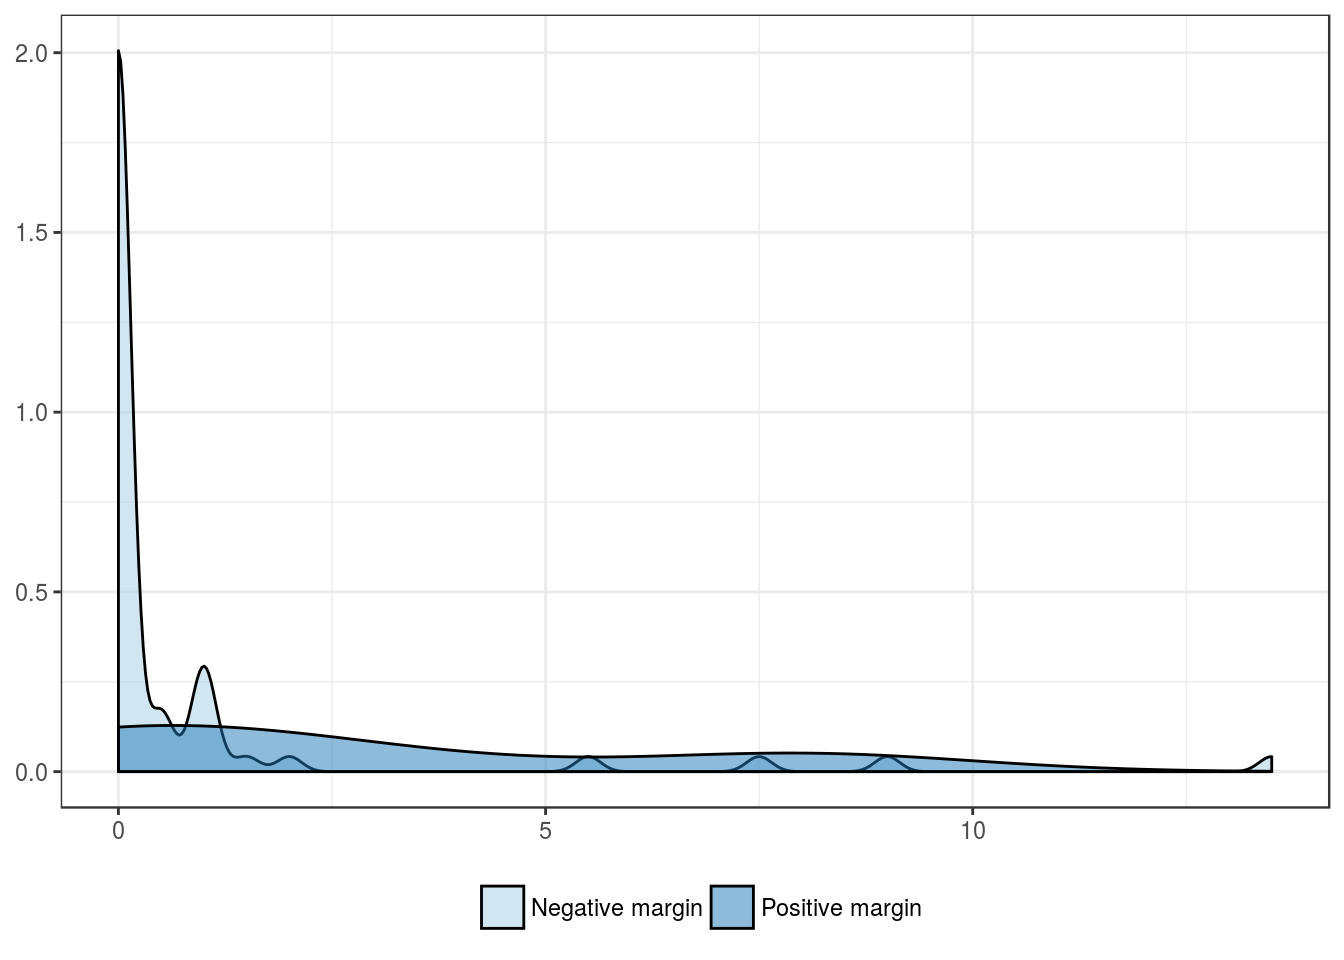
Surgical margin
| Negative margin | Positive margin | |
|---|---|---|
| Mean | 0.7 | 2.6 |
| Standard deviation | 2.3 | 3.8 |
| Median | 0.0 | 1.2 |
| Interquartile range | 0.5 | 3.9 |
| Minimum | 0.0 | 0.0 |
| Maximum | 13.5 | 8.0 |
| Value | |
|---|---|
| U-statistic | 88 |
| P statistic | 1.8e-01 |
Outcome features
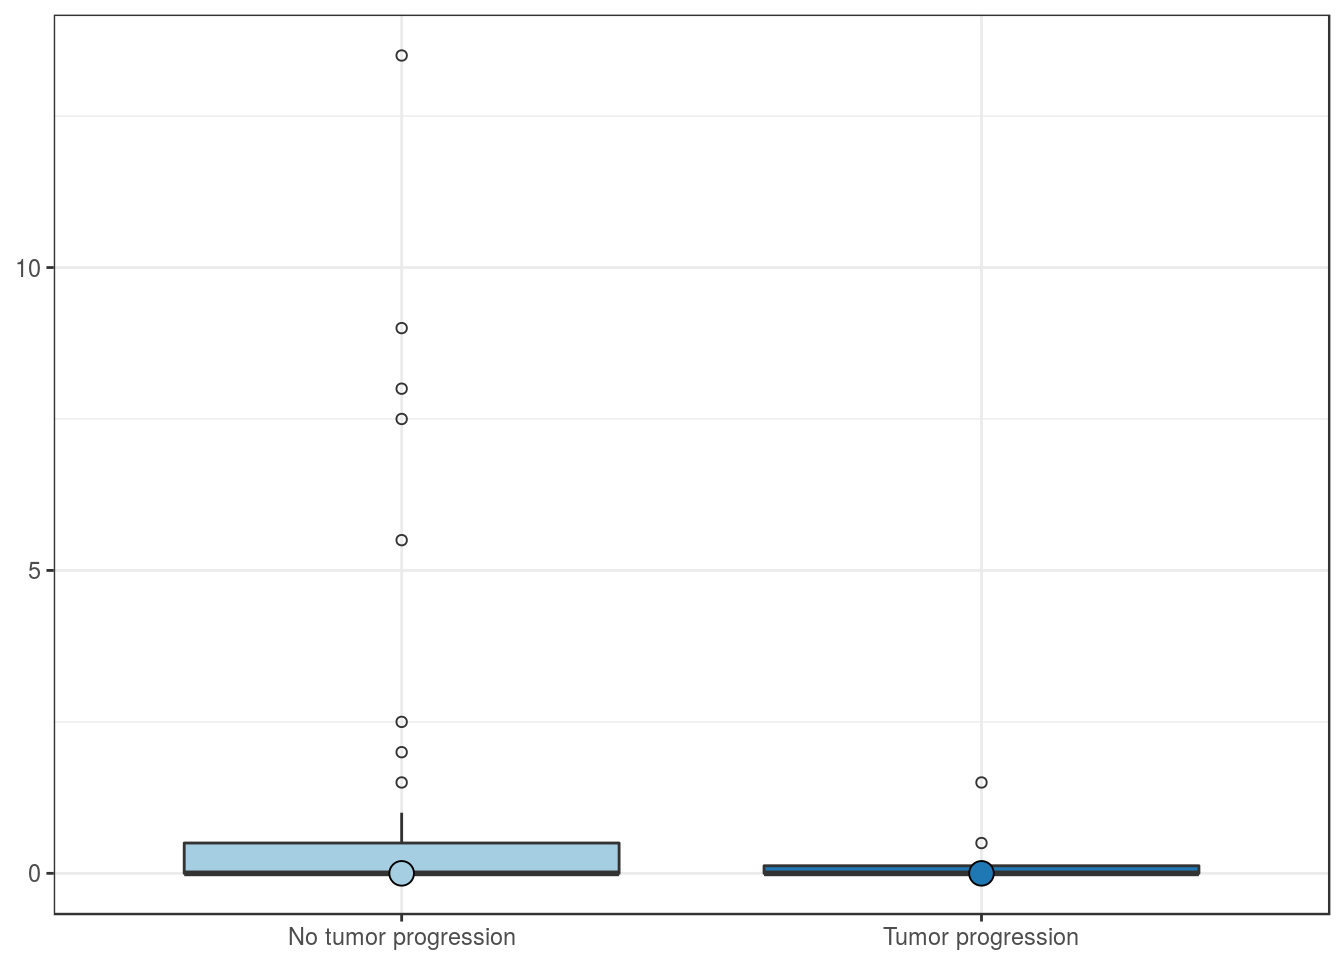
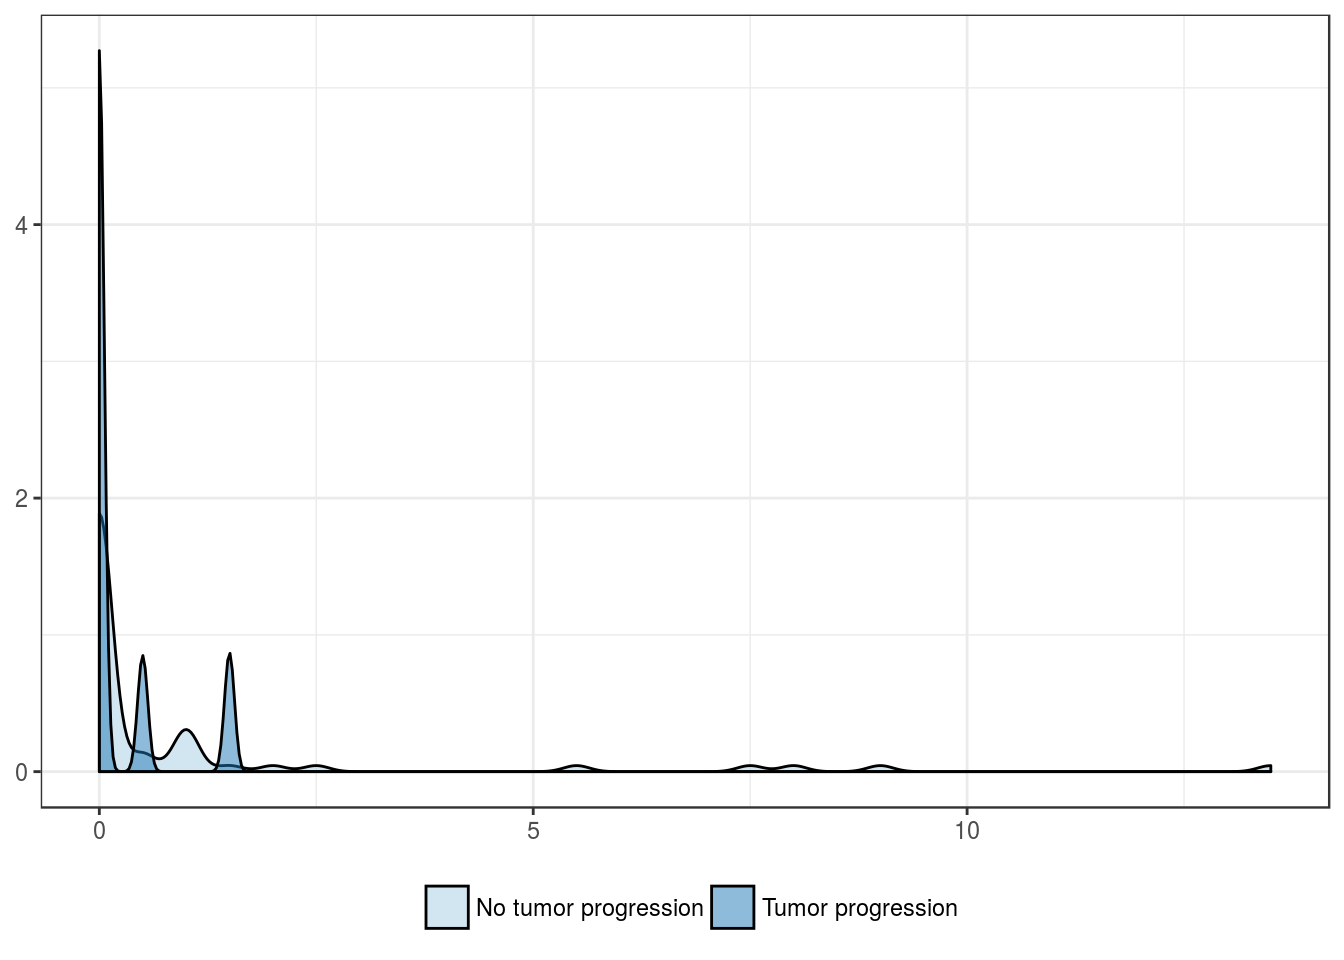
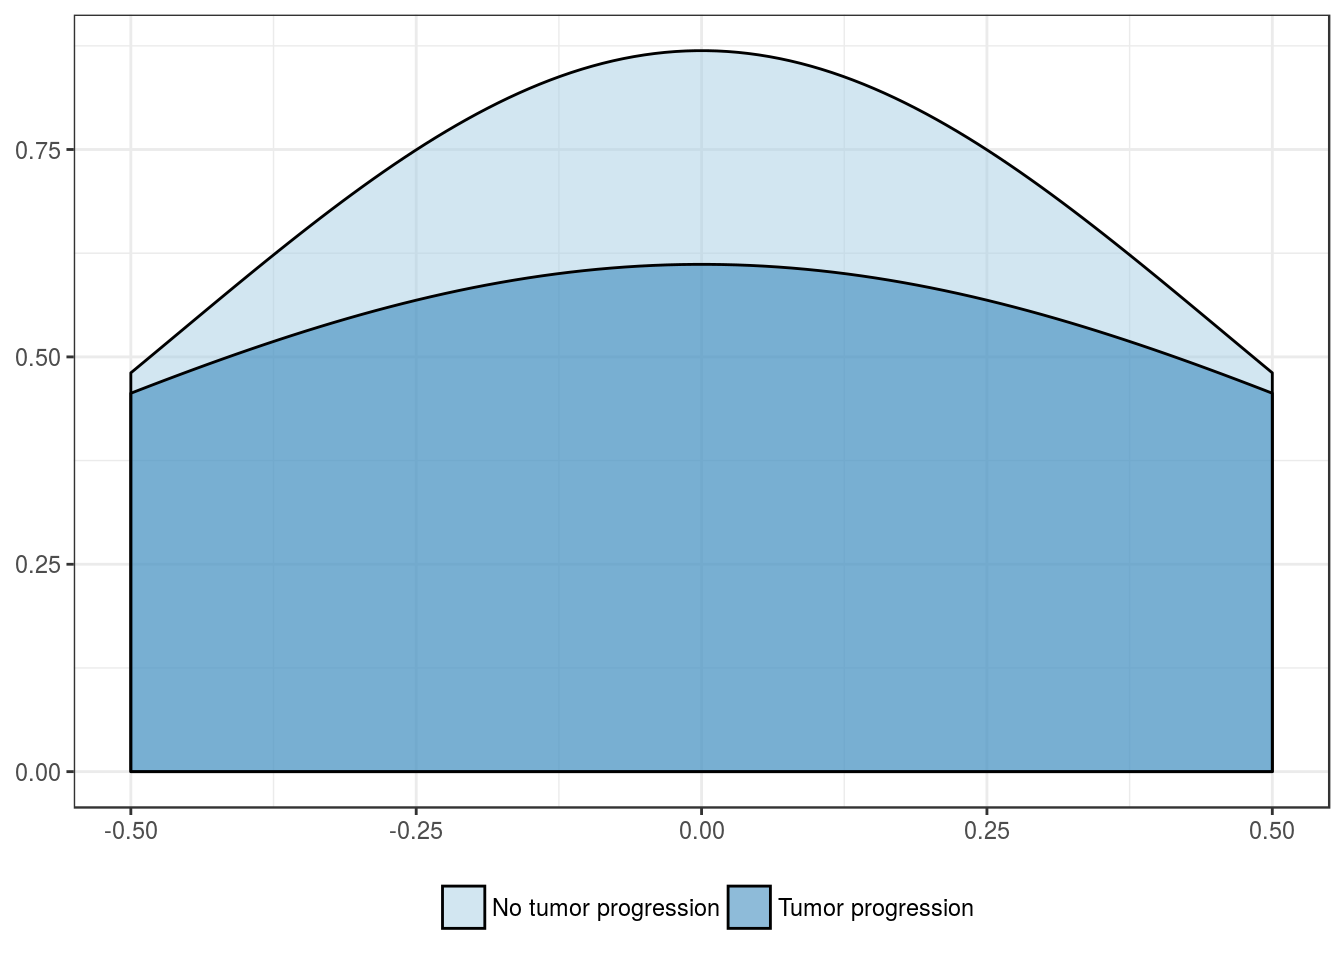
Tumor progression
| No tumor progression | Tumor progression | |
|---|---|---|
| Mean | 1.0 | 0.2 |
| Standard deviation | 2.5 | 0.5 |
| Median | 0.0 | 0.0 |
| Interquartile range | 0.5 | 0.1 |
| Minimum | 0.0 | 0.0 |
| Maximum | 13.5 | 1.5 |
| Value | |
|---|---|
| U-statistic | 261 |
| P statistic | 7e-01 |
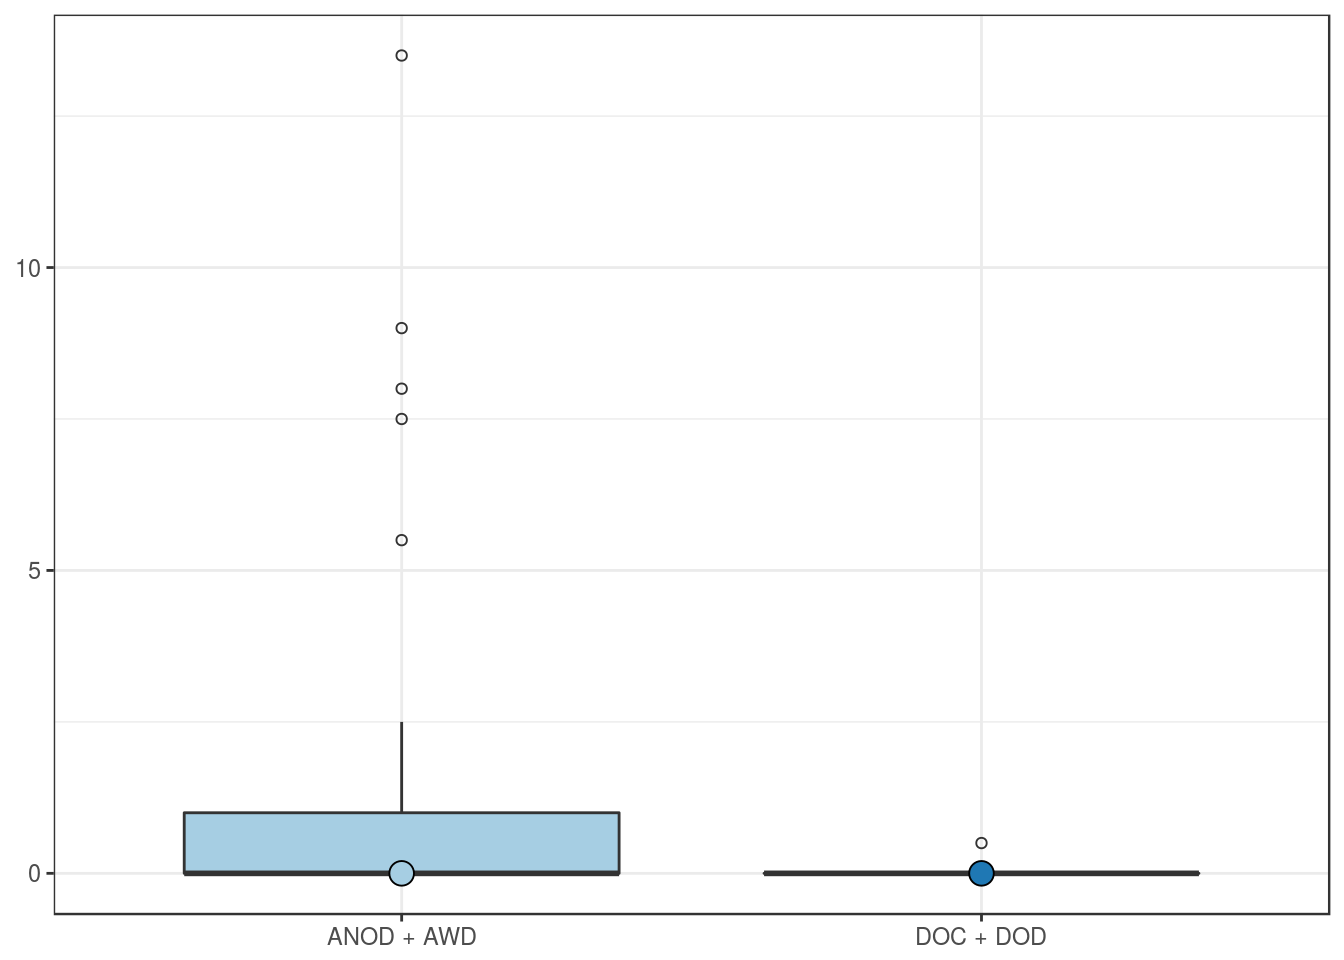
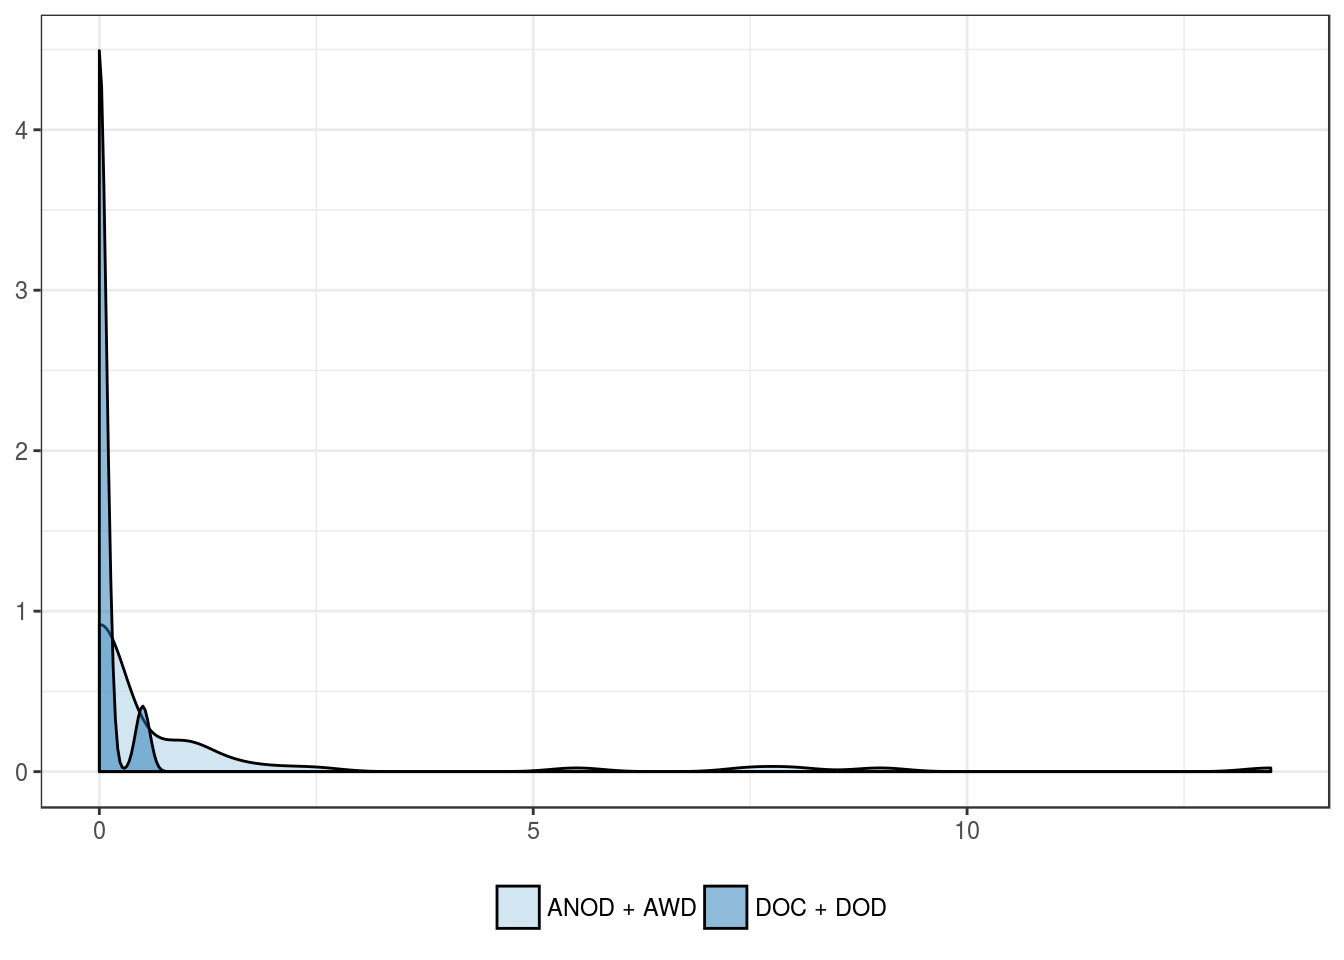
Overall mortality
| ANOD + AWD | DOC + DOD | |
|---|---|---|
| Mean | 1.0 | 0.0 |
| Standard deviation | 2.6 | 0.1 |
| Median | 0.0 | 0.0 |
| Interquartile range | 1.0 | 0.0 |
| Minimum | 0.0 | 0.0 |
| Maximum | 13.5 | 0.5 |
| Value | |
|---|---|
| U-statistic | 441 |
| P statistic | 7e-02 |
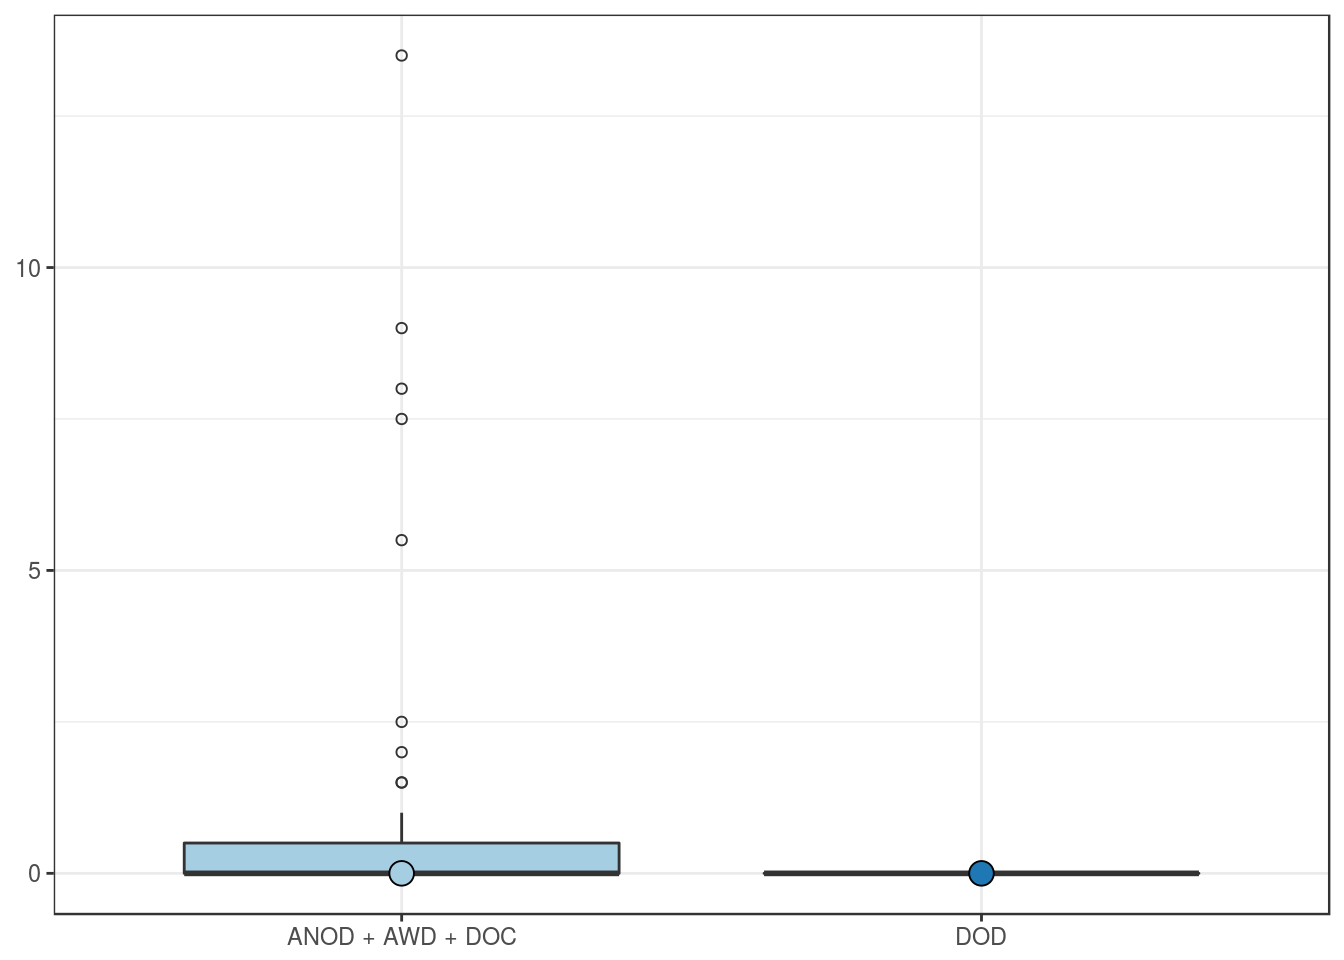
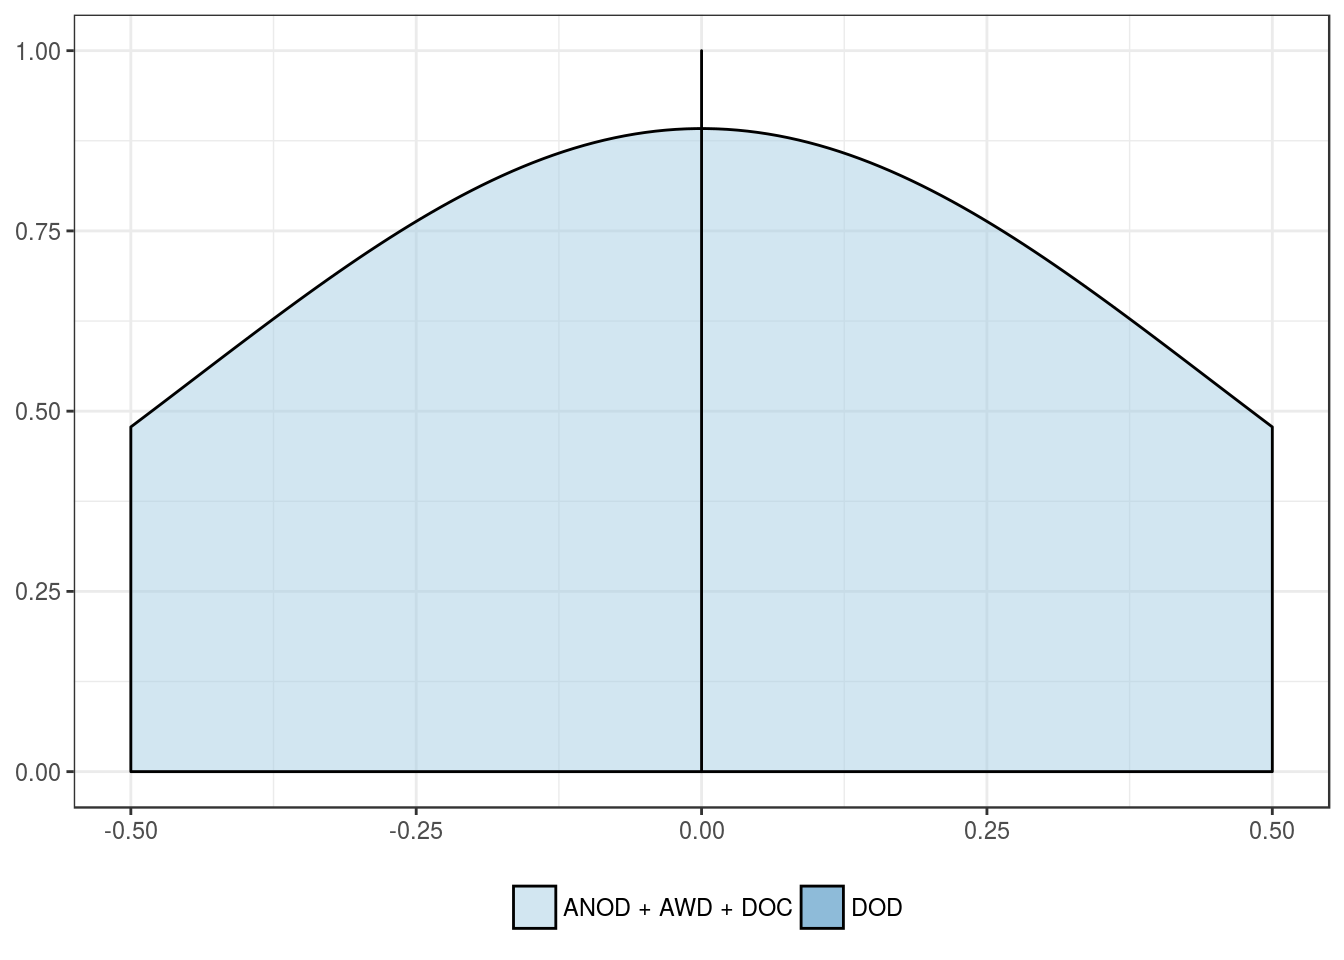
Cancer-related mortality
| ANOD + AWD + DOC | DOD | |
|---|---|---|
| Mean | 0.9 | 0 |
| Standard deviation | 2.4 | 0 |
| Median | 0.0 | 0 |
| Interquartile range | 0.5 | 0 |
| Minimum | 0.0 | 0 |
| Maximum | 13.5 | 0 |
| Value | |
|---|---|
| U-statistic | 88 |
| P statistic | 3.9e-01 |
CD8 positivity in stromal lymphocytes
Clinical features
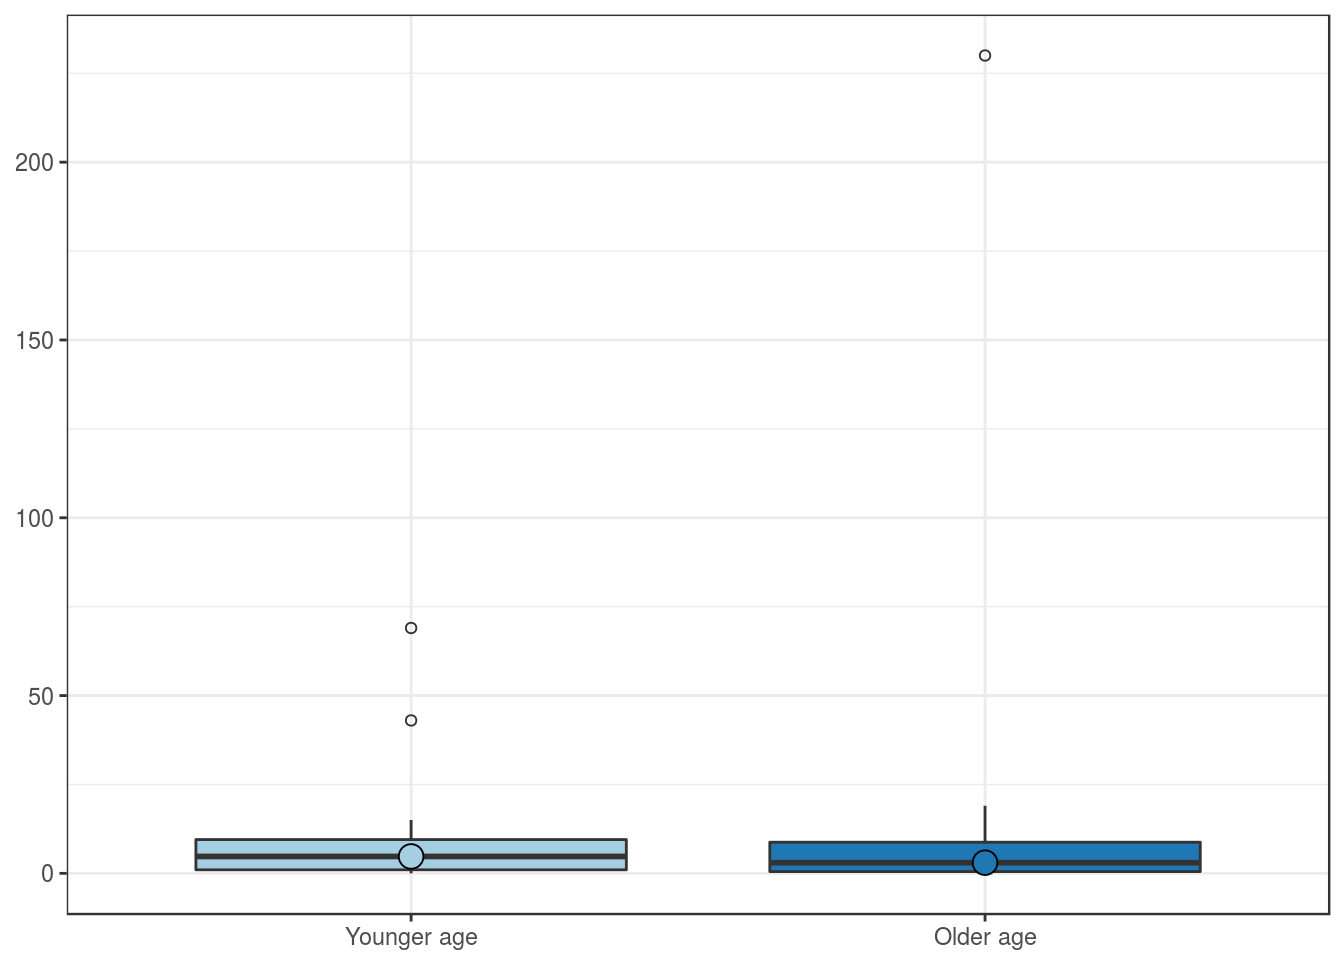
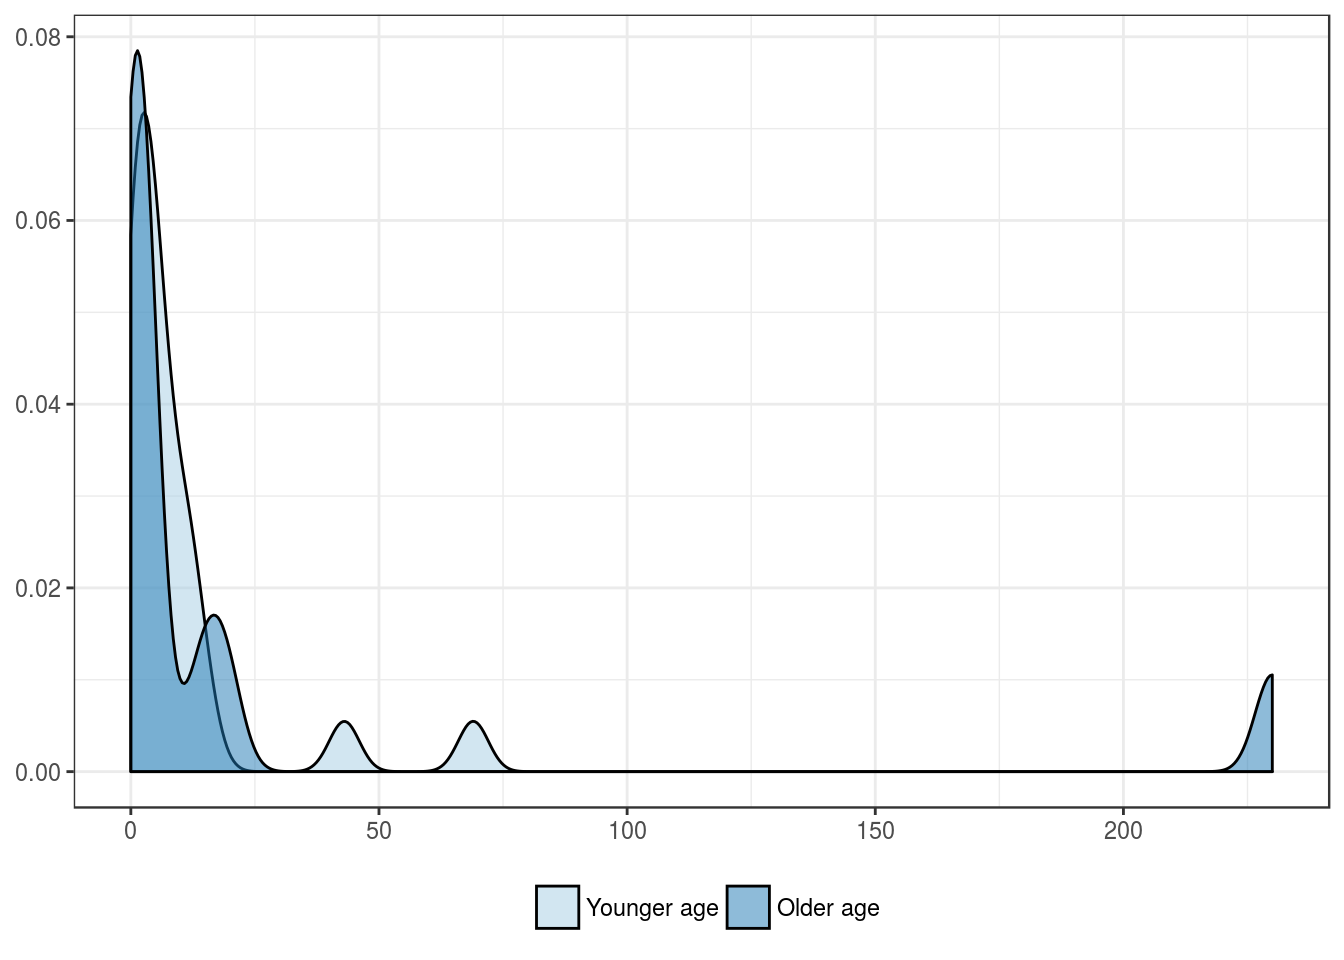
Patients’ age group, in years
| Younger age | Older age | |
|---|---|---|
| Mean | 9.1 | 25.0 |
| Standard deviation | 15.5 | 68.3 |
| Median | 4.8 | 3.0 |
| Interquartile range | 8.5 | 8.2 |
| Minimum | 0.0 | 0.0 |
| Maximum | 69.0 | 230.0 |
| Value | |
|---|---|
| U-statistic | 153 |
| P statistic | 4.6e-01 |
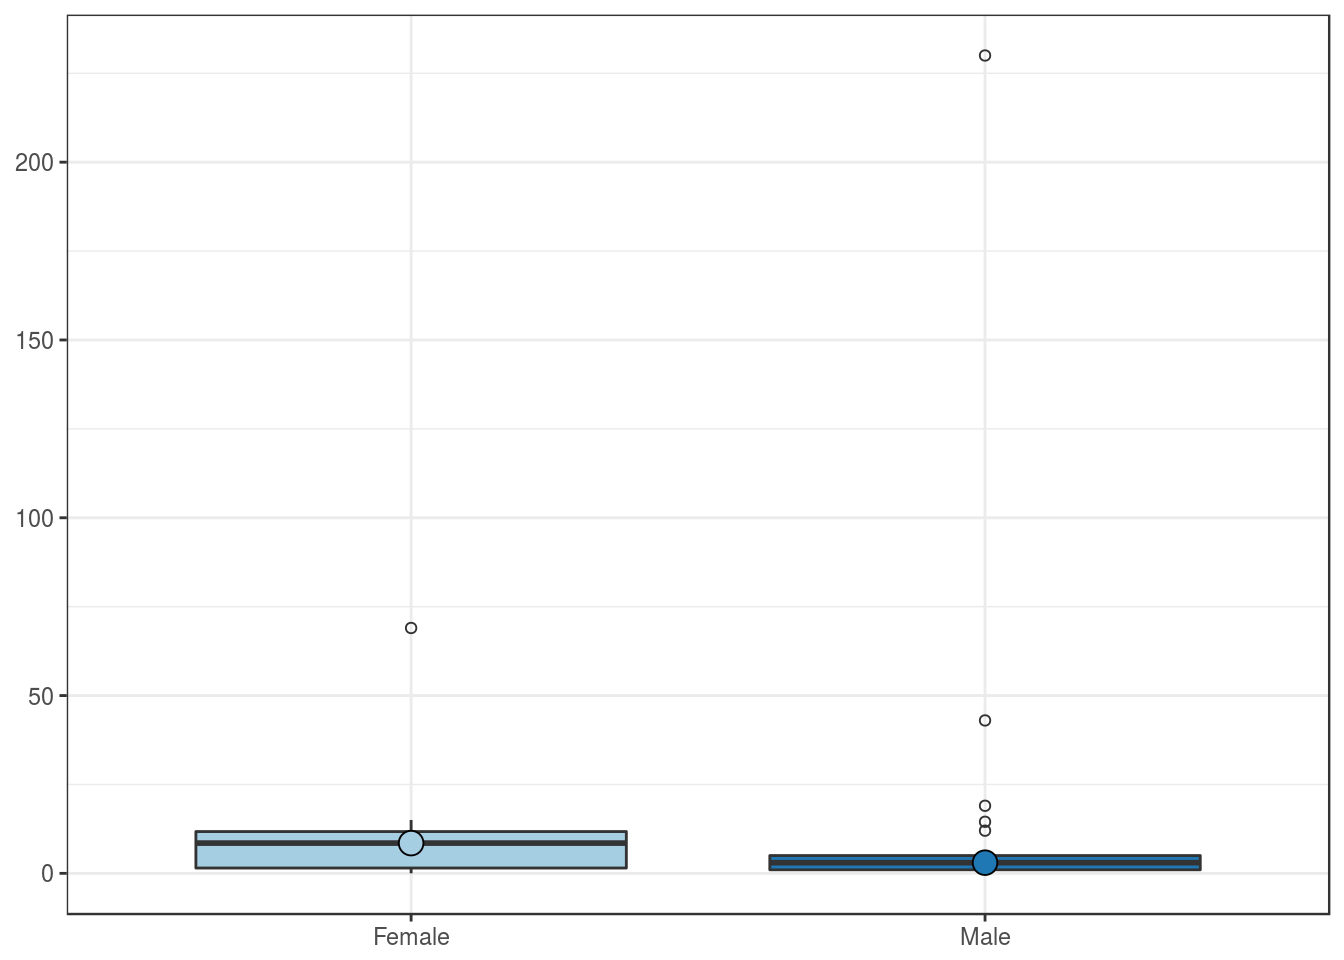
Patients’ sex
| Female | Male | |
|---|---|---|
| Mean | 12.8 | 14.6 |
| Standard deviation | 20.5 | 45.8 |
| Median | 8.5 | 3.0 |
| Interquartile range | 10.2 | 4.0 |
| Minimum | 0.0 | 0.0 |
| Maximum | 69.0 | 230.0 |
| Value | |
|---|---|
| U-statistic | 150 |
| P statistic | 3.6e-01 |
Patients’ race
| Caucasian | African-American | Asian | Other | |
|---|---|---|---|---|
| Mean | 16.9 | 4.5 | 12 | 2.8 |
| Standard deviation | 45.2 | 5.2 | NA | 2.8 |
| Median | 4.0 | 3.0 | 12 | 1.5 |
| Interquartile range | 9.0 | 3.0 | 0 | 2.5 |
| Minimum | 0.0 | 0.0 | 12 | 1.0 |
| Maximum | 230.0 | 12.0 | 12 | 6.0 |
| Value | |
|---|---|
| Statistic | 1.364 |
| Parameter | 3 |
| P statistic | 0.71 |
History of other malignancies
| No other tumor | Prostate cancer | Other tumor | |
|---|---|---|---|
| Mean | 8.9 | 1.5 | 58.2 |
| Standard deviation | 14.5 | 2.1 | 114.5 |
| Median | 4.5 | 1.5 | 1.5 |
| Interquartile range | 10.0 | 1.5 | 59.8 |
| Minimum | 0.0 | 0.0 | 0.0 |
| Maximum | 69.0 | 3.0 | 230.0 |
| Value | |
|---|---|
| Statistic | 1.925 |
| Parameter | 2 |
| P statistic | 0.38 |
Pathologic features
Tumor size group
| Smaller size | Larger size | |
|---|---|---|
| Mean | 7.7 | 25.2 |
| Standard deviation | 14.9 | 62.7 |
| Median | 3.0 | 5.0 |
| Interquartile range | 8.0 | 11.0 |
| Minimum | 0.0 | 0.0 |
| Maximum | 69.0 | 230.0 |
| Value | |
|---|---|
| U-statistic | 120 |
| P statistic | 5.6e-01 |
Multifocality
| Single tumor | Multifocal tumor | |
|---|---|---|
| Mean | 15.6 | 2.5 |
| Standard deviation | 42.2 | 4.4 |
| Median | 4.0 | 0.5 |
| Interquartile range | 10.5 | 3.0 |
| Minimum | 0.0 | 0.0 |
| Maximum | 230.0 | 9.0 |
| Value | |
|---|---|
| U-statistic | 90 |
| P statistic | 1.5e-01 |
Fuhrman grade
| G1 | G2 | G3 | G4 | |
|---|---|---|---|---|
| Mean | 3.0 | 9.3 | 26.4 | 19 |
| Standard deviation | 4.2 | 16.3 | 71.6 | NA |
| Median | 3.0 | 3.0 | 4.0 | 19 |
| Interquartile range | 3.0 | 9.5 | 7.0 | 0 |
| Minimum | 0.0 | 0.0 | 0.0 | 19 |
| Maximum | 6.0 | 69.0 | 230.0 | 19 |
| Value | |
|---|---|
| Statistic | 2.295 |
| Parameter | 3 |
| P statistic | 0.51 |
pT stage
| pT1 | pT2 | pT3 | |
|---|---|---|---|
| Mean | 8.2 | 12.0 | 41.8 |
| Standard deviation | 15.2 | 9.9 | 92.3 |
| Median | 3.0 | 12.0 | 4.5 |
| Interquartile range | 7.2 | 7.0 | 10.8 |
| Minimum | 0.0 | 5.0 | 0.0 |
| Maximum | 69.0 | 19.0 | 230.0 |
| Value | |
|---|---|
| Statistic | 1.578 |
| Parameter | 2 |
| P statistic | 0.45 |
Surgical margin
| Negative margin | Positive margin | |
|---|---|---|
| Mean | 14.8 | 1 |
| Standard deviation | 41.0 | NA |
| Median | 3.0 | 1 |
| Interquartile range | 10.0 | 0 |
| Minimum | 0.0 | 1 |
| Maximum | 230.0 | 1 |
| Value | |
|---|---|
| U-statistic | 24 |
| P statistic | 4.7e-01 |
Outcome features
Tumor progression
| No tumor progression | Tumor progression | |
|---|---|---|
| Mean | 15.2 | 7.7 |
| Standard deviation | 43.0 | 5.9 |
| Median | 3.0 | 8.0 |
| Interquartile range | 7.2 | 8.0 |
| Minimum | 0.0 | 0.0 |
| Maximum | 230.0 | 14.5 |
| Value | |
|---|---|
| U-statistic | 58.5 |
| P statistic | 4.5e-01 |
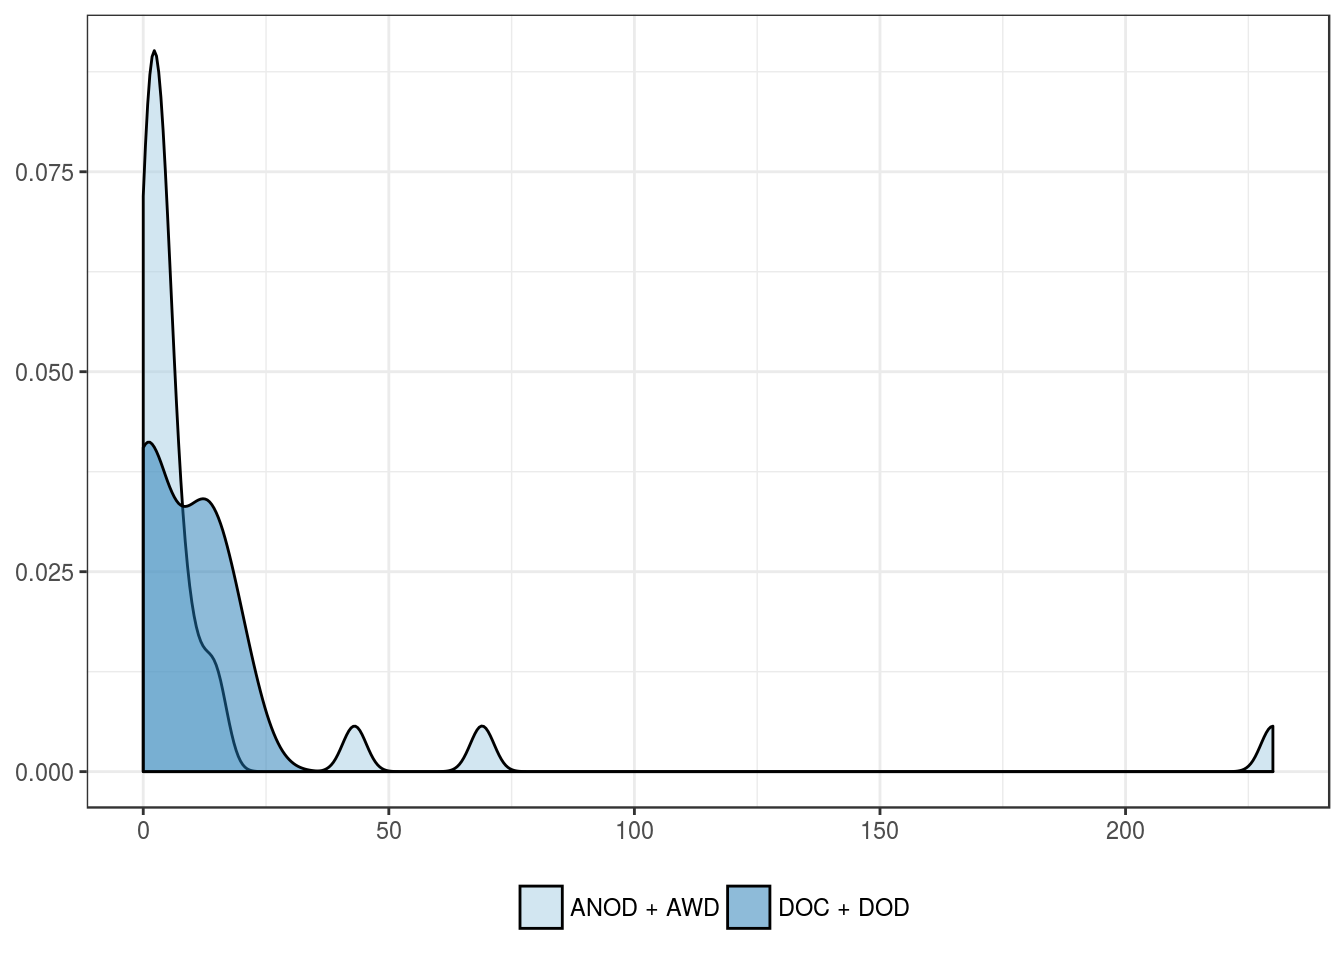
Overall mortality
| ANOD + AWD | DOC + DOD | |
|---|---|---|
| Mean | 15.5 | 7.3 |
| Standard deviation | 43.7 | 8.1 |
| Median | 3.0 | 6.5 |
| Interquartile range | 7.0 | 11.8 |
| Minimum | 0.0 | 0.0 |
| Maximum | 230.0 | 19.0 |
| Value | |
|---|---|
| U-statistic | 88 |
| P statistic | 9.8e-01 |

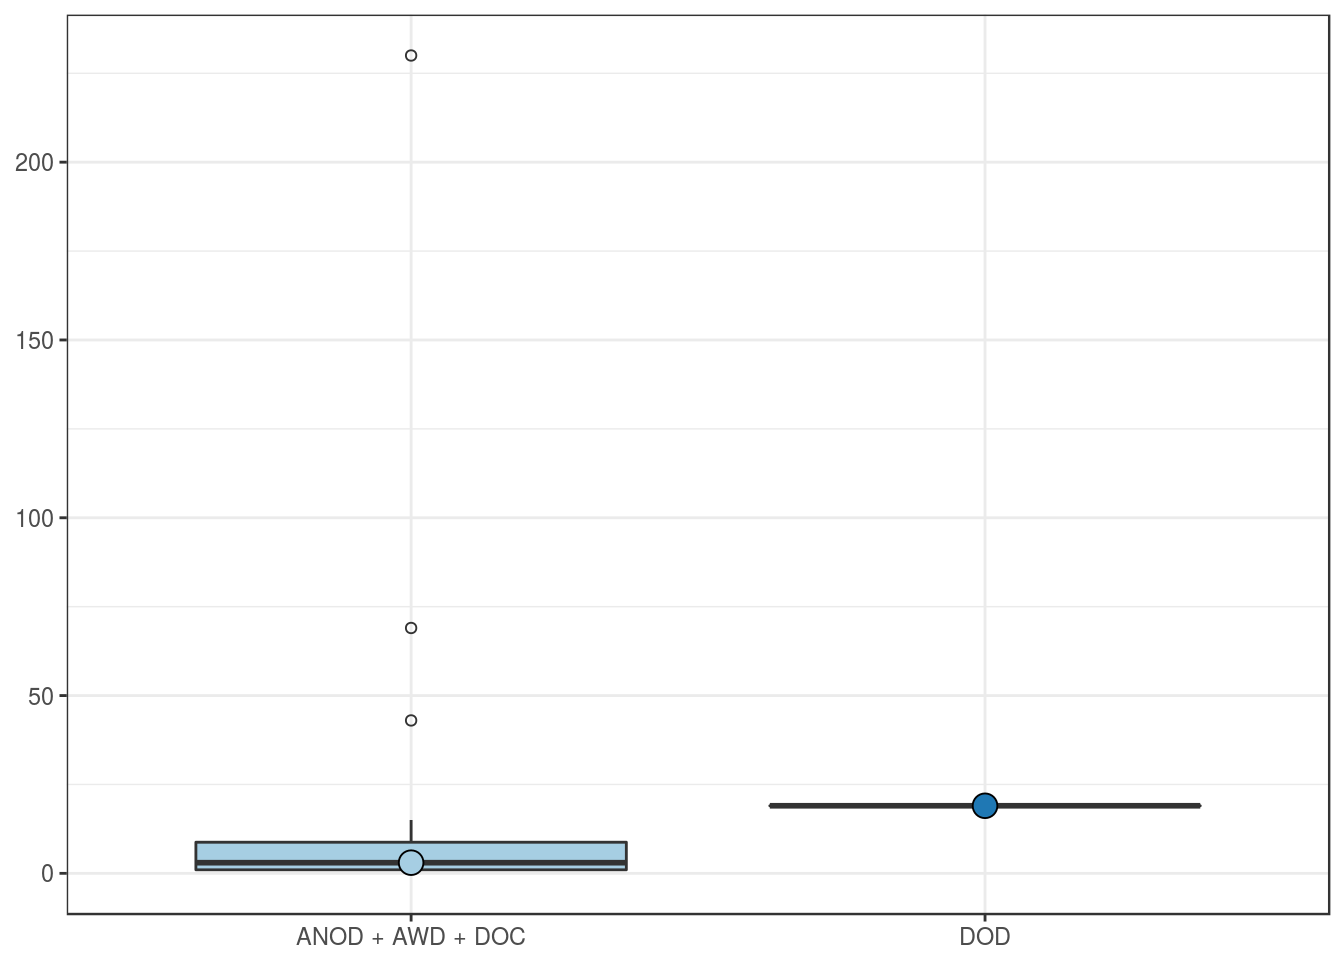
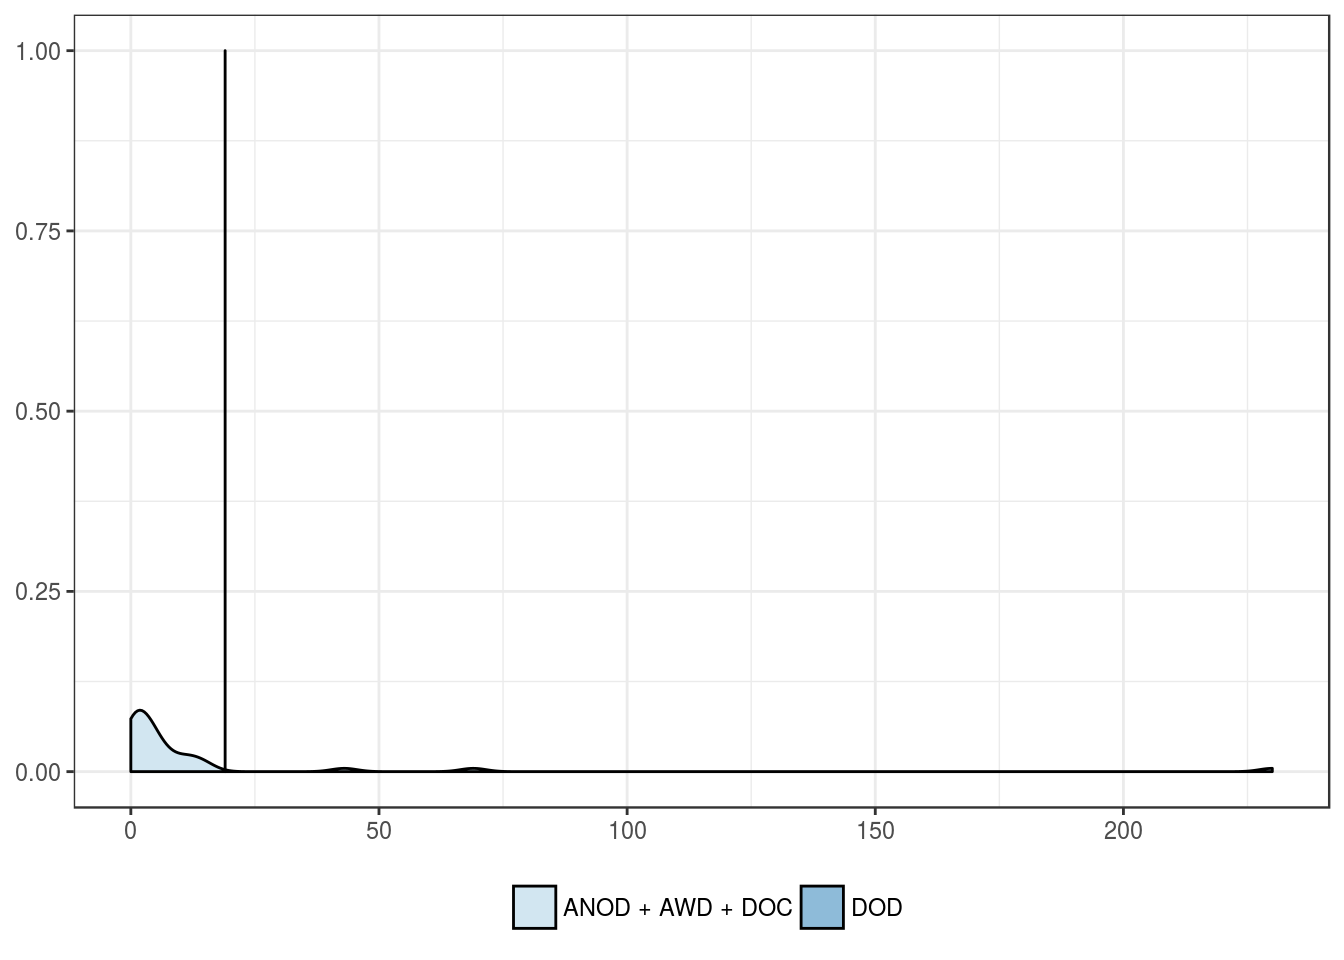
Cancer-related mortality
| ANOD + AWD + DOC | DOD | |
|---|---|---|
| Mean | 14.0 | 19 |
| Standard deviation | 40.5 | NA |
| Median | 3.0 | 19 |
| Interquartile range | 7.8 | 0 |
| Minimum | 0.0 | 19 |
| Maximum | 230.0 | 19 |
| Value | |
|---|---|
| U-statistic | 3 |
| P statistic | 1.8e-01 |
CD8–Ki67 positivity in stromal lymphocytes
Clinical features
Patients’ age group, in years
| Younger age | Older age | |
|---|---|---|
| Mean | 0 | 0 |
| Standard deviation | 0 | 0 |
| Median | 0 | 0 |
| Interquartile range | 0 | 0 |
| Minimum | 0 | 0 |
| Maximum | 0 | 0 |
| Value | |
|---|---|
| U-statistic | 126 |
| P statistic | NaN |

Patients’ sex
| Female | Male | |
|---|---|---|
| Mean | 0 | 0 |
| Standard deviation | 0 | 0 |
| Median | 0 | 0 |
| Interquartile range | 0 | 0 |
| Minimum | 0 | 0 |
| Maximum | 0 | 0 |
| Value | |
|---|---|
| U-statistic | 120 |
| P statistic | NaN |
Patients’ race
| Caucasian | African-American | Asian | Other | |
|---|---|---|---|---|
| Mean | 0 | 0 | 0 | 0 |
| Standard deviation | 0 | 0 | NA | 0 |
| Median | 0 | 0 | 0 | 0 |
| Interquartile range | 0 | 0 | 0 | 0 |
| Minimum | 0 | 0 | 0 | 0 |
| Maximum | 0 | 0 | 0 | 0 |
| Value | |
|---|---|
| Statistic | NaN |
| Parameter | 3 |
| P statistic | NaN |
History of other malignancies
| No other tumor | Prostate cancer | Other tumor | |
|---|---|---|---|
| Mean | 0 | 0 | 0 |
| Standard deviation | 0 | 0 | 0 |
| Median | 0 | 0 | 0 |
| Interquartile range | 0 | 0 | 0 |
| Minimum | 0 | 0 | 0 |
| Maximum | 0 | 0 | 0 |
| Value | |
|---|---|
| Statistic | NaN |
| Parameter | 2 |
| P statistic | NaN |
Pathologic features
Tumor size group
| Smaller size | Larger size | |
|---|---|---|
| Mean | 0 | 0 |
| Standard deviation | 0 | 0 |
| Median | 0 | 0 |
| Interquartile range | 0 | 0 |
| Minimum | 0 | 0 |
| Maximum | 0 | 0 |
| Value | |
|---|---|
| U-statistic | 130 |
| P statistic | NaN |
Multifocality
| Single tumor | Multifocal tumor | |
|---|---|---|
| Mean | 0 | 0 |
| Standard deviation | 0 | 0 |
| Median | 0 | 0 |
| Interquartile range | 0 | 0 |
| Minimum | 0 | 0 |
| Maximum | 0 | 0 |
| Value | |
|---|---|
| U-statistic | 46.5 |
| P statistic | NaN |
Fuhrman grade
| G1 | G2 | G3 | G4 | |
|---|---|---|---|---|
| Mean | 0 | 0 | 0 | 0 |
| Standard deviation | 0 | 0 | 0 | NA |
| Median | 0 | 0 | 0 | 0 |
| Interquartile range | 0 | 0 | 0 | 0 |
| Minimum | 0 | 0 | 0 | 0 |
| Maximum | 0 | 0 | 0 | 0 |
| Value | |
|---|---|
| Statistic | NaN |
| Parameter | 3 |
| P statistic | NaN |
pT stage
| pT1 | pT2 | pT3 | |
|---|---|---|---|
| Mean | 0 | 0 | 0 |
| Standard deviation | 0 | 0 | 0 |
| Median | 0 | 0 | 0 |
| Interquartile range | 0 | 0 | 0 |
| Minimum | 0 | 0 | 0 |
| Maximum | 0 | 0 | 0 |
| Value | |
|---|---|
| Statistic | NaN |
| Parameter | 2 |
| P statistic | NaN |
Surgical margin
| Negative margin | Positive margin | |
|---|---|---|
| Mean | 0 | 0 |
| Standard deviation | 0 | NA |
| Median | 0 | 0 |
| Interquartile range | 0 | 0 |
| Minimum | 0 | 0 |
| Maximum | 0 | 0 |
| Value | |
|---|---|
| U-statistic | 16 |
| P statistic | NaN |
Outcome features
Tumor progression
| No tumor progression | Tumor progression | |
|---|---|---|
| Mean | 0 | 0 |
| Standard deviation | 0 | 0 |
| Median | 0 | 0 |
| Interquartile range | 0 | 0 |
| Minimum | 0 | 0 |
| Maximum | 0 | 0 |
| Value | |
|---|---|
| U-statistic | 72.5 |
| P statistic | NaN |
Overall mortality
| ANOD + AWD | DOC + DOD | |
|---|---|---|
| Mean | 0 | 0 |
| Standard deviation | 0 | 0 |
| Median | 0 | 0 |
| Interquartile range | 0 | 0 |
| Minimum | 0 | 0 |
| Maximum | 0 | 0 |
| Value | |
|---|---|
| U-statistic | 84 |
| P statistic | NaN |
Cancer-related mortality
| ANOD + AWD + DOC | DOD | |
|---|---|---|
| Mean | 0 | 0 |
| Standard deviation | 0 | NA |
| Median | 0 | 0 |
| Interquartile range | 0 | 0 |
| Minimum | 0 | 0 |
| Maximum | 0 | 0 |
| Value | |
|---|---|
| U-statistic | 16.5 |
| P statistic | NaN |
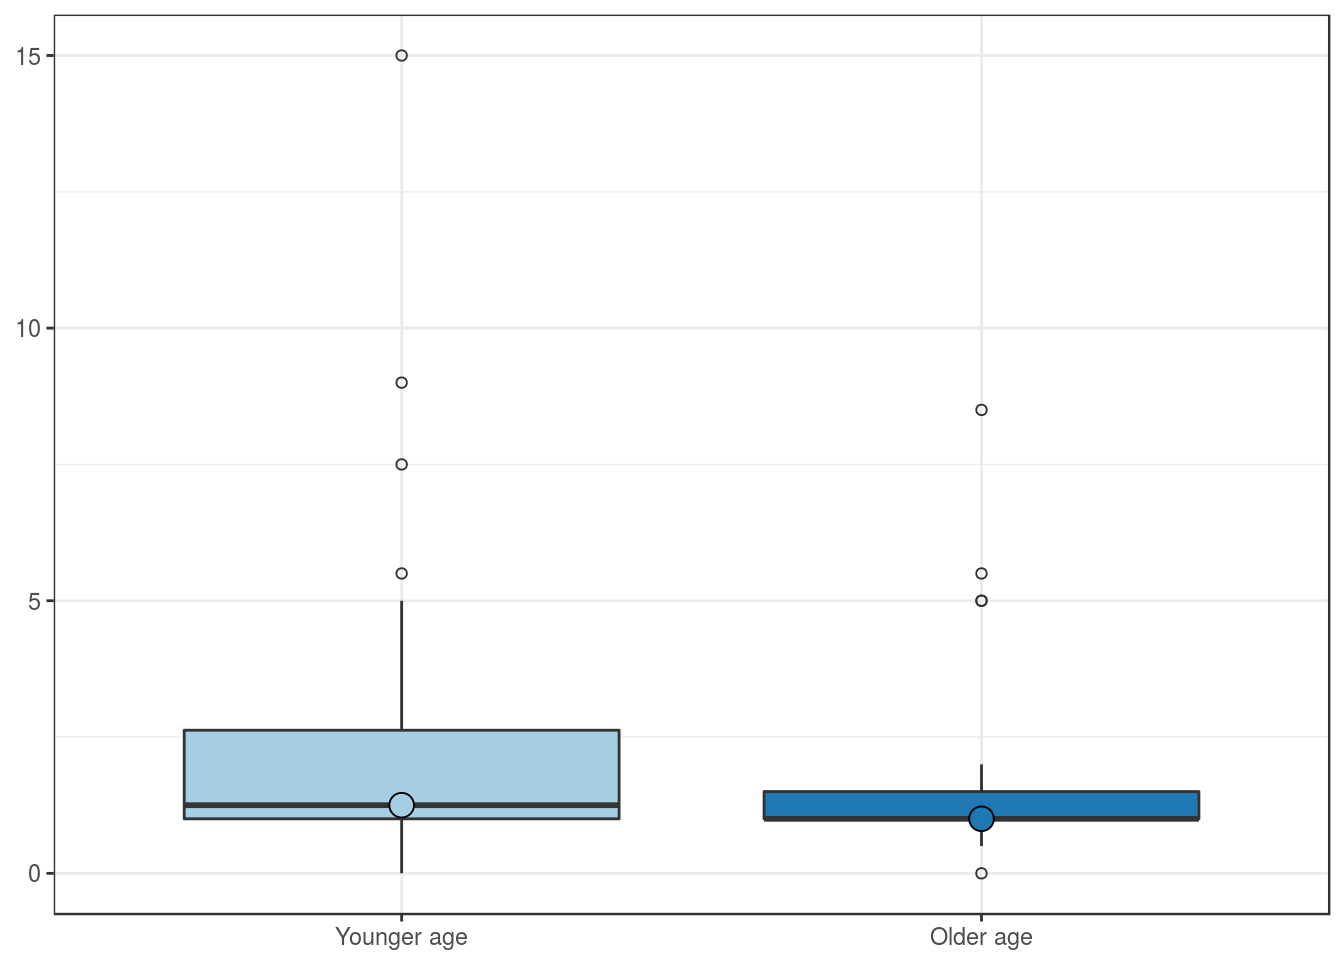
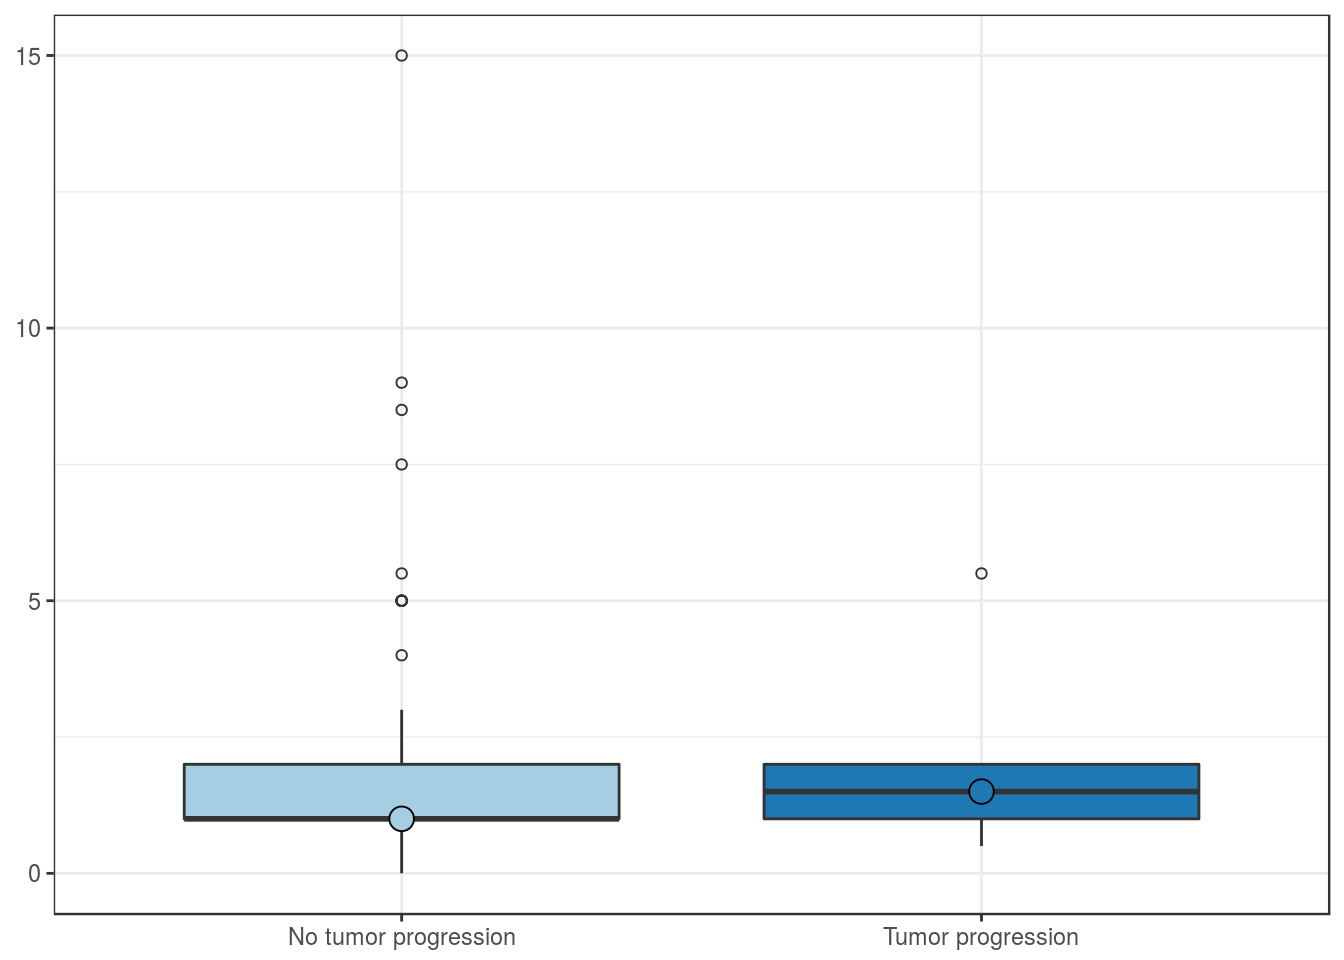
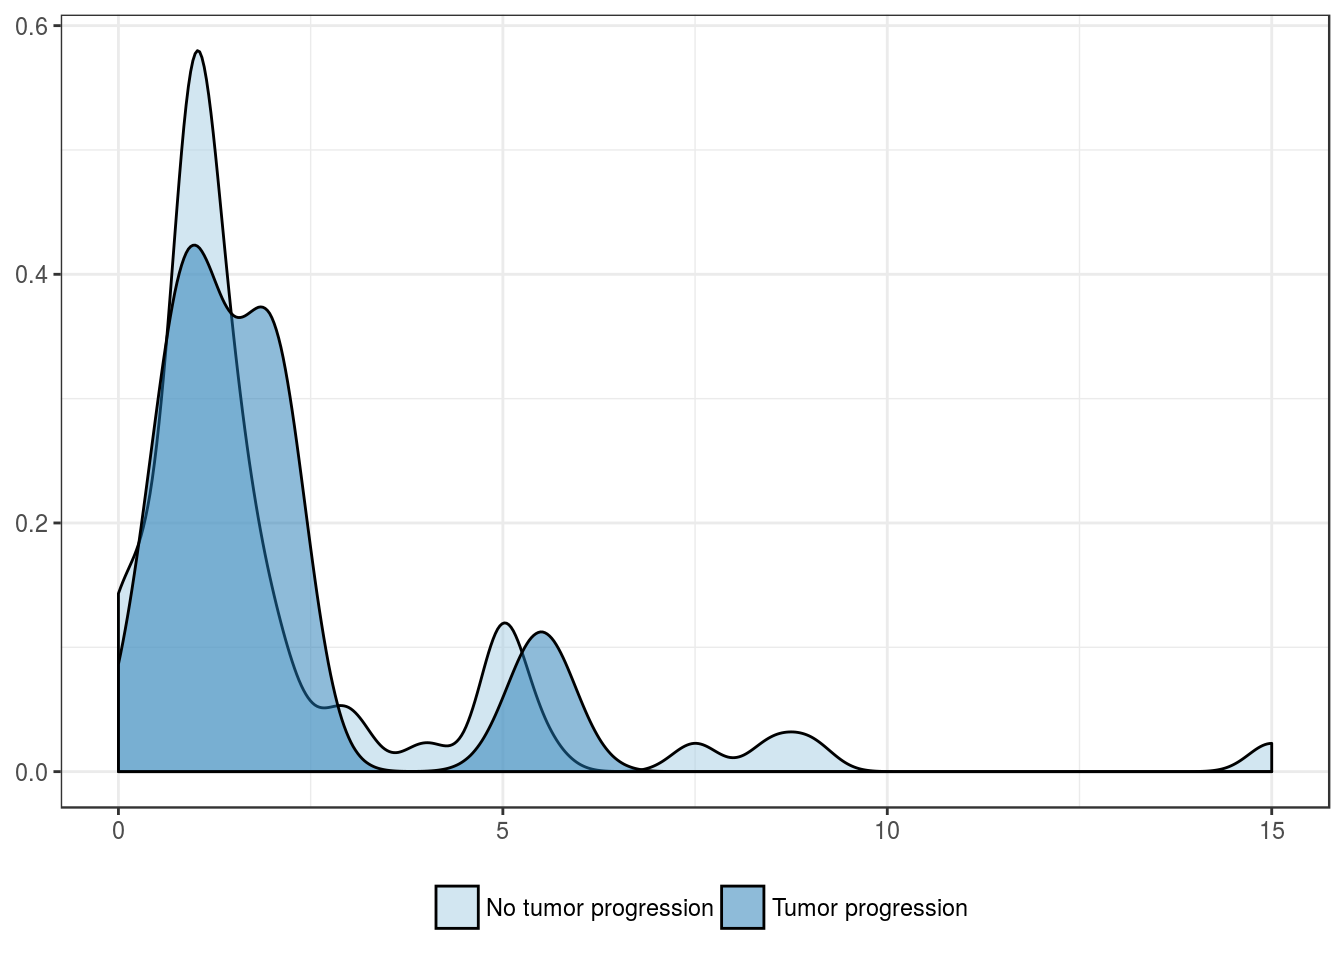
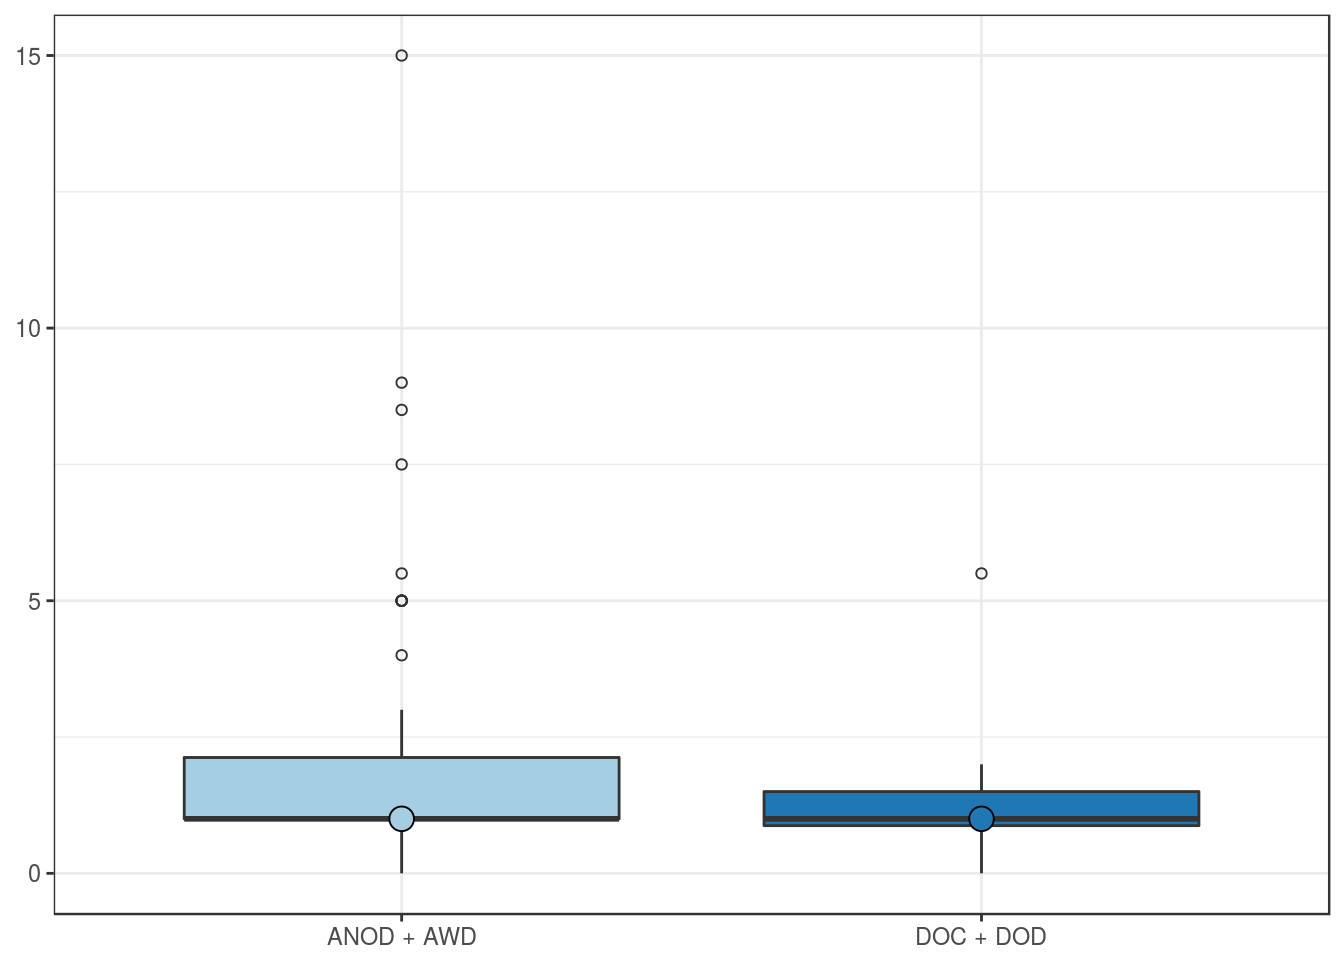
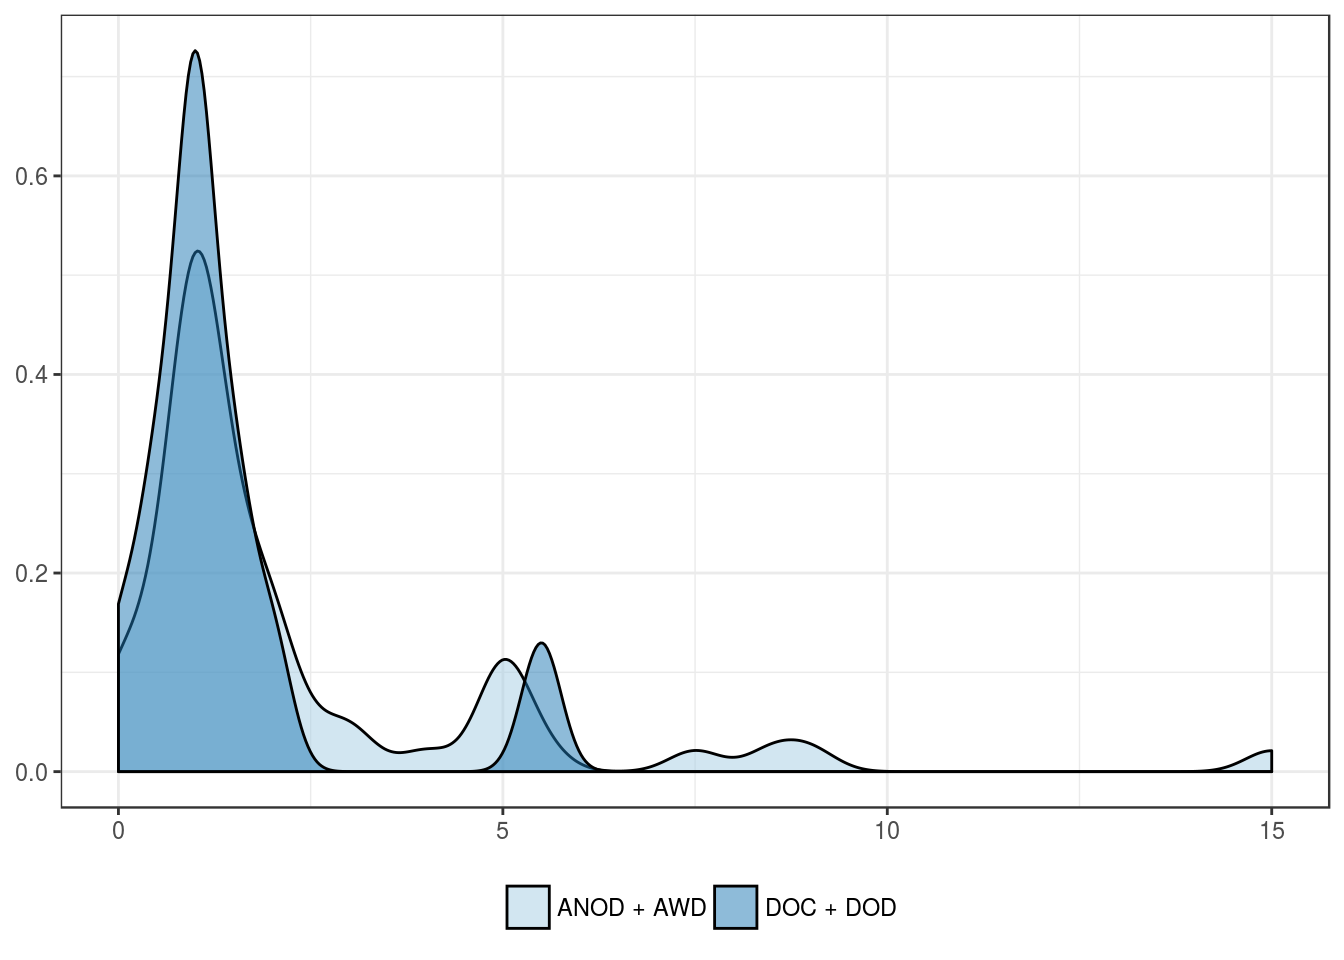
Ki67 positivity in intratumoral lymphocytes
Clinical features
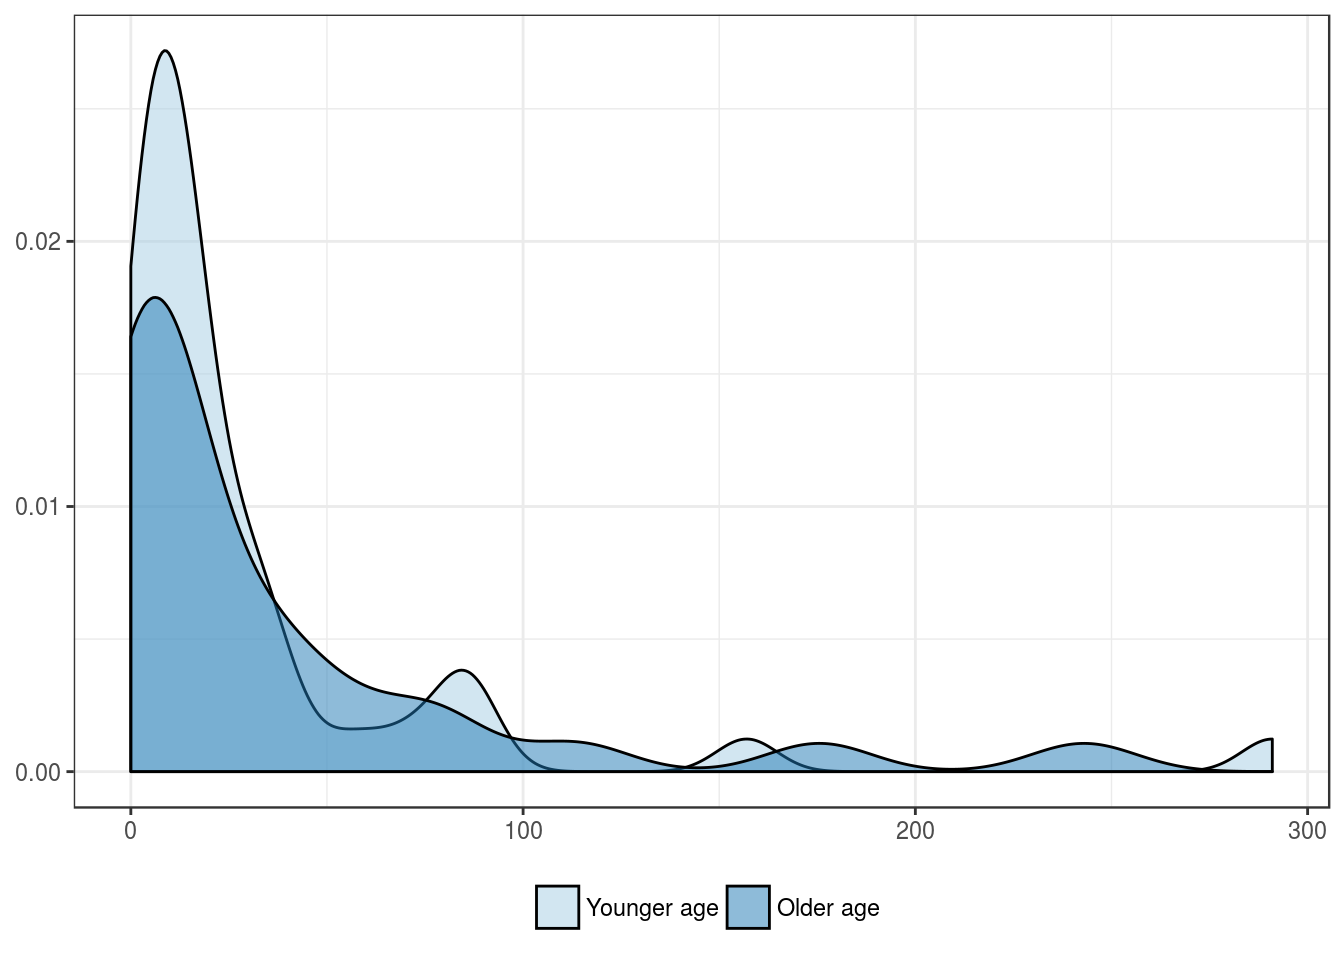
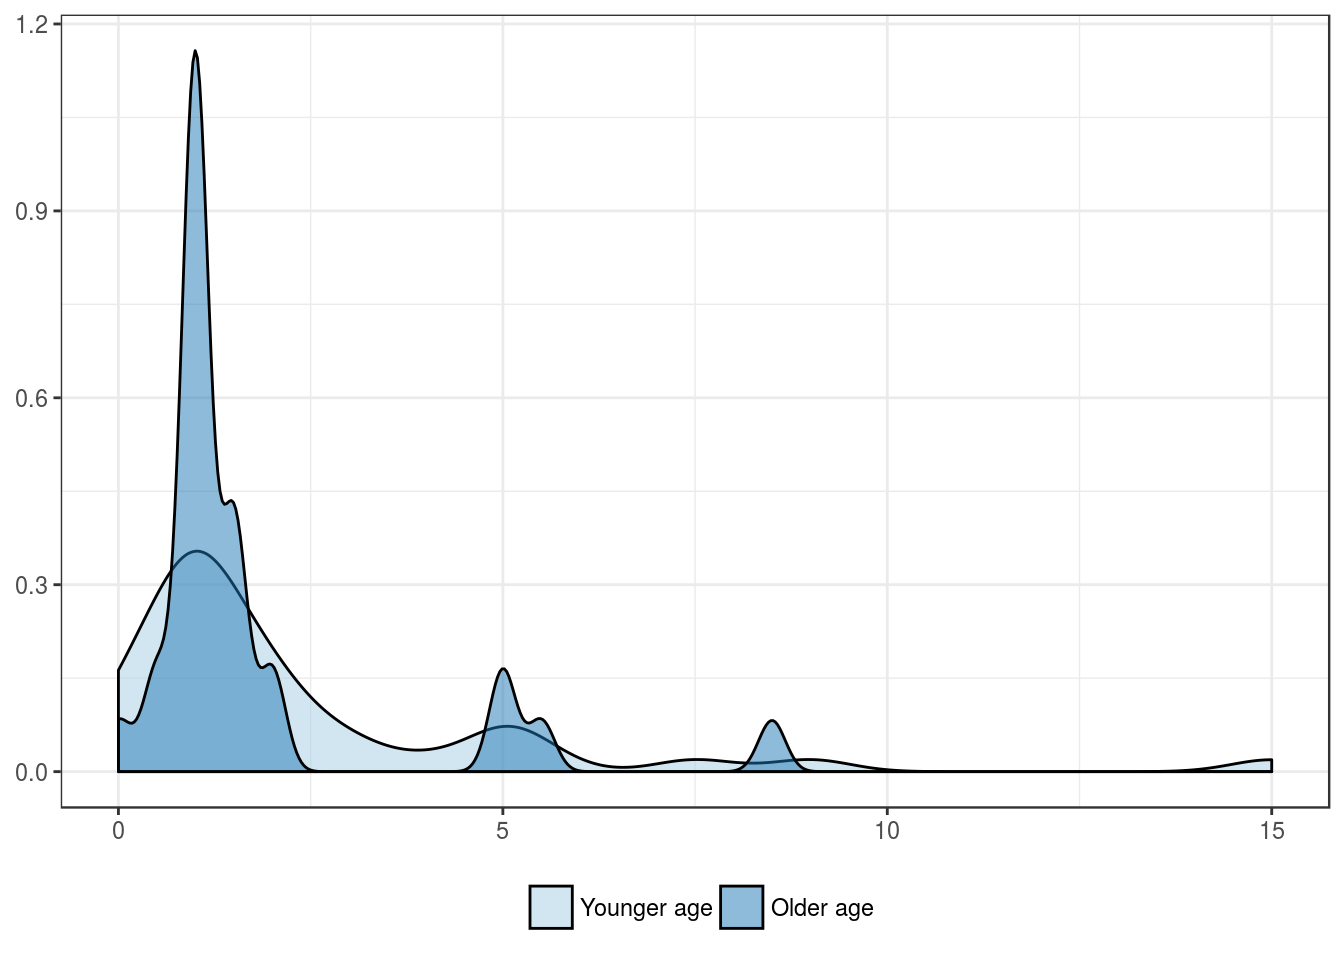
Patients’ age group, in years
| Younger age | Older age | |
|---|---|---|
| Mean | 2.4 | 1.8 |
| Standard deviation | 2.9 | 1.9 |
| Median | 1.2 | 1.0 |
| Interquartile range | 1.6 | 0.5 |
| Minimum | 0.0 | 0.0 |
| Maximum | 15.0 | 8.5 |
| Value | |
|---|---|
| U-statistic | 604 |
| P statistic | 5.8e-01 |
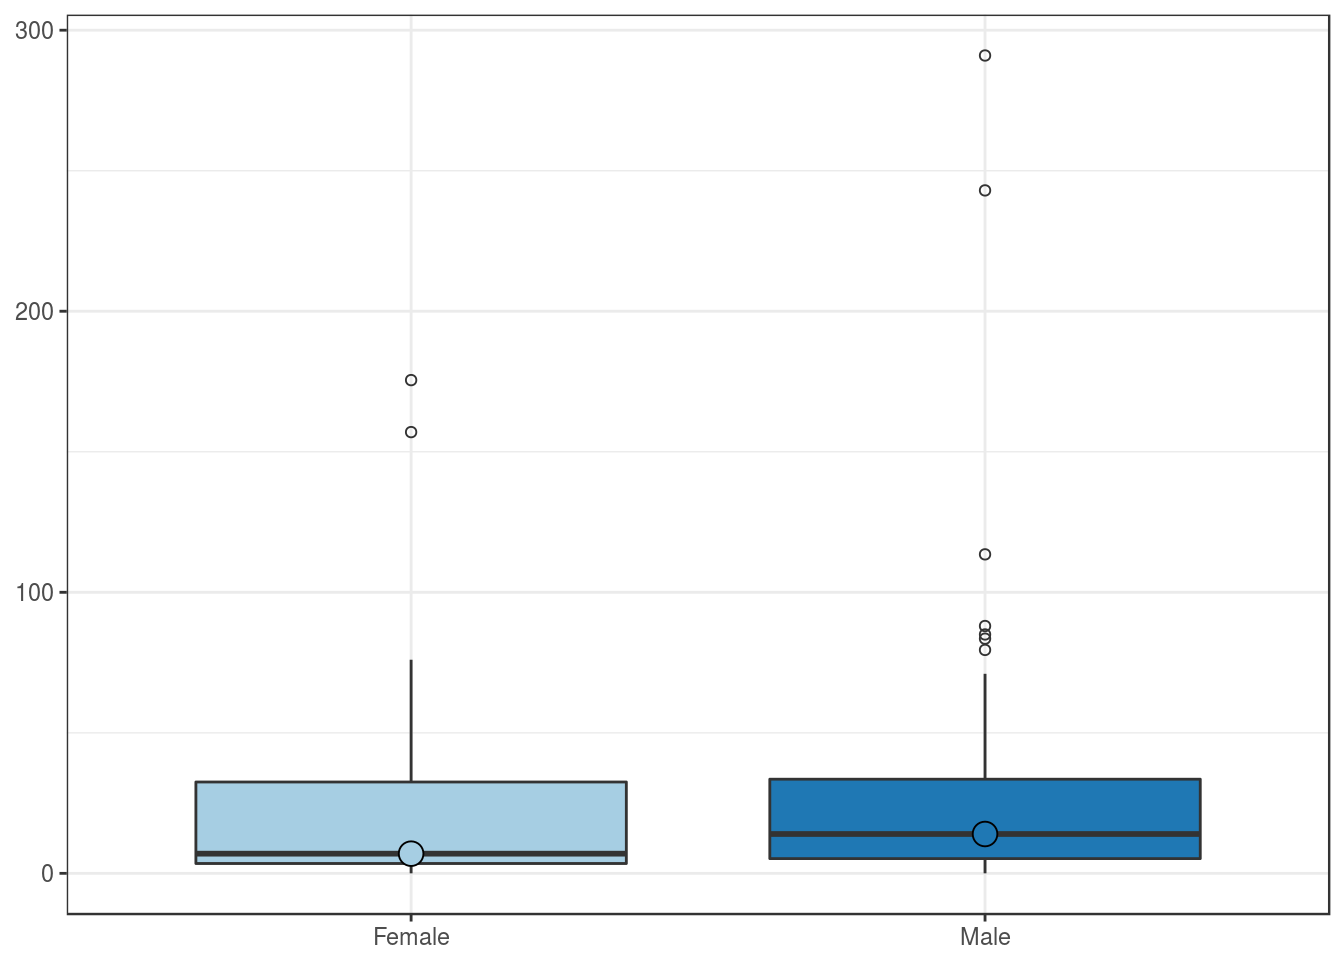
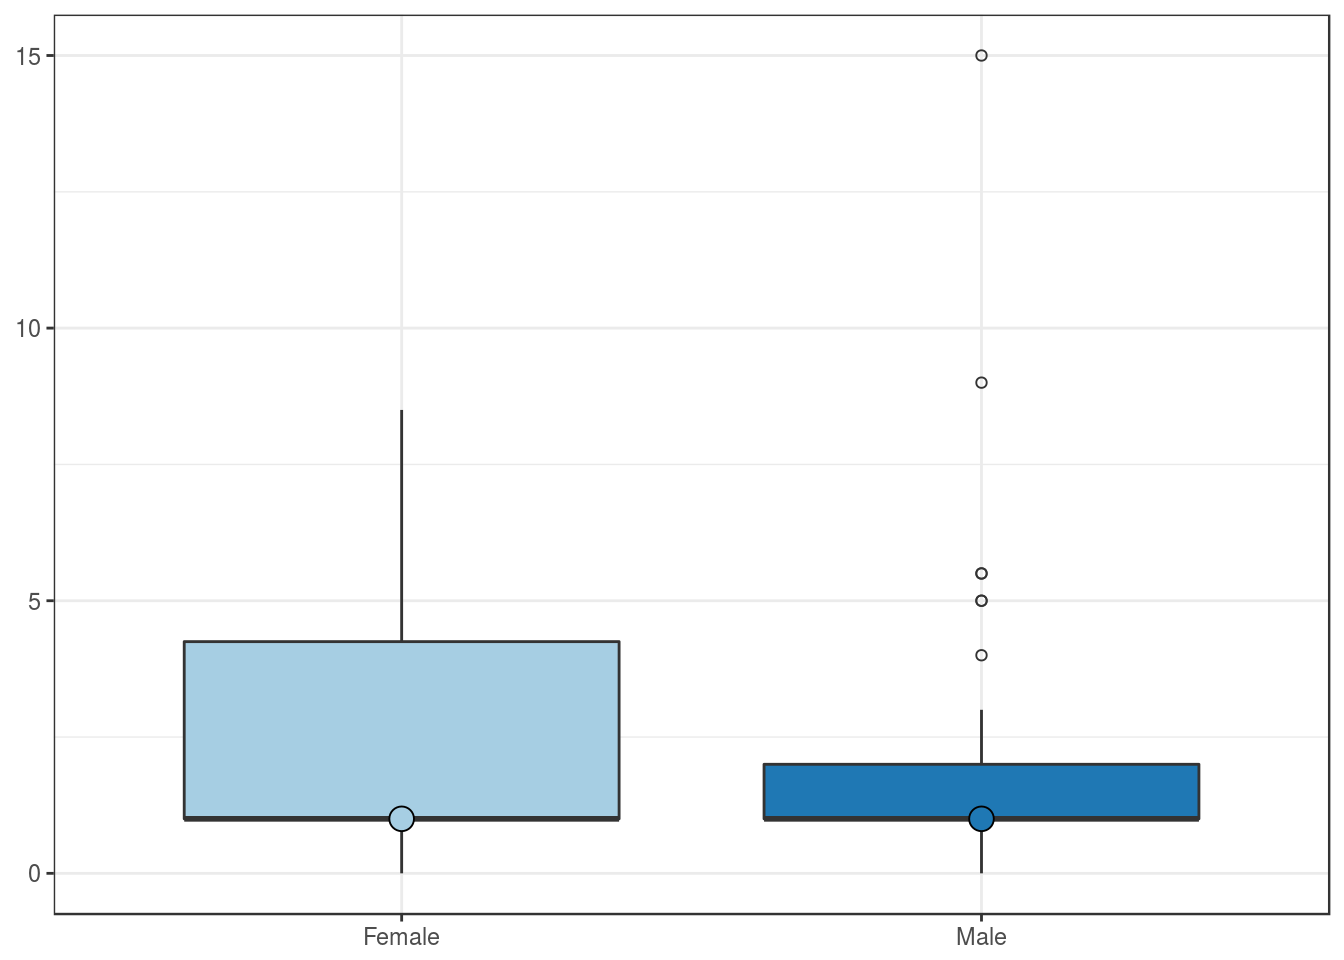
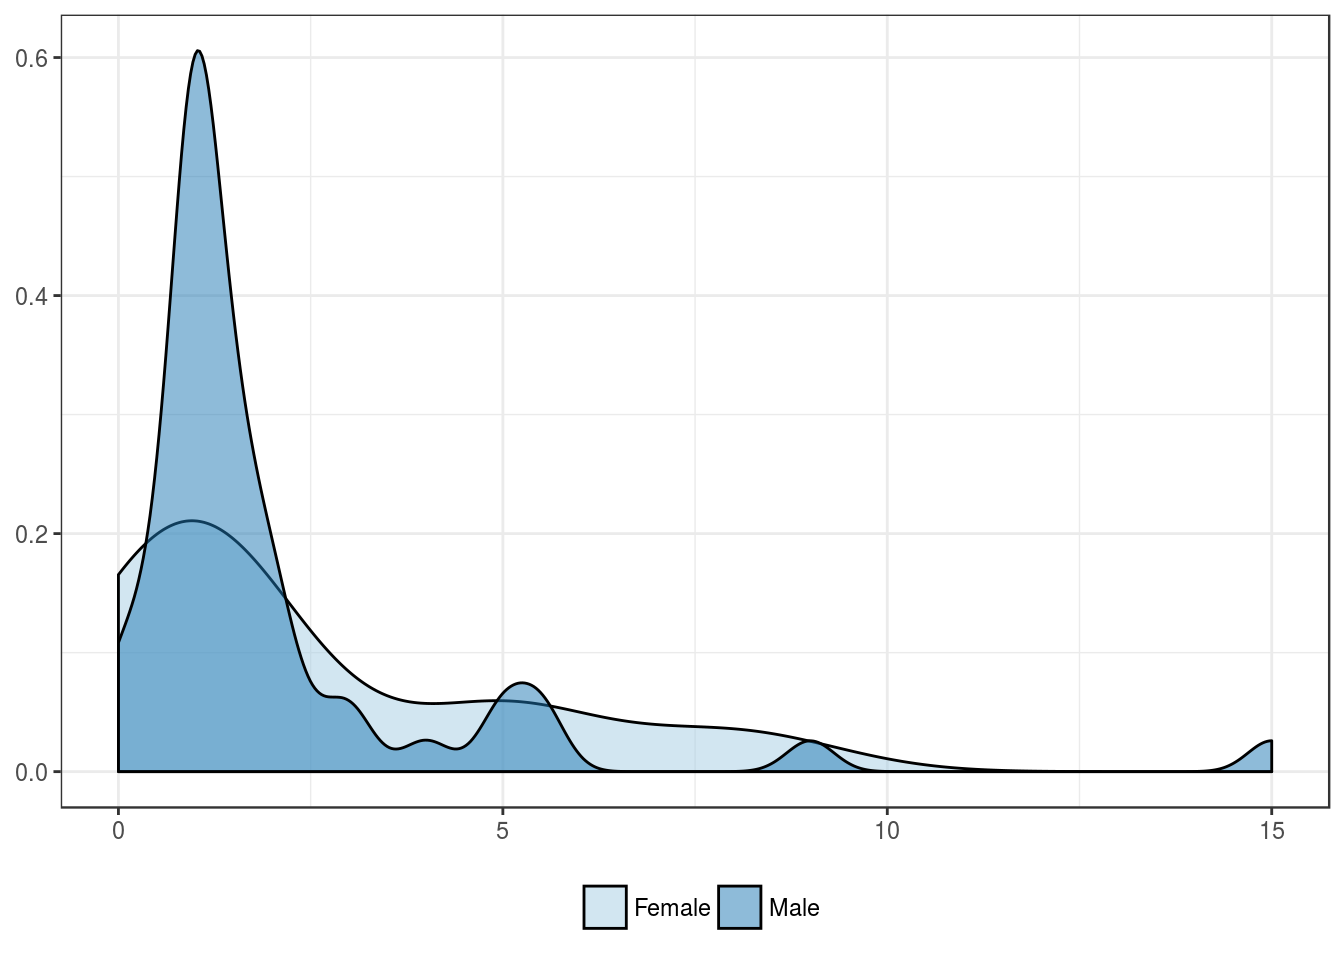
Patients’ sex
| Female | Male | |
|---|---|---|
| Mean | 2.4 | 2.0 |
| Standard deviation | 2.6 | 2.5 |
| Median | 1.0 | 1.0 |
| Interquartile range | 3.2 | 1.0 |
| Minimum | 0.0 | 0.0 |
| Maximum | 8.5 | 15.0 |
| Value | |
|---|---|
| U-statistic | 452 |
| P statistic | 9.8e-01 |
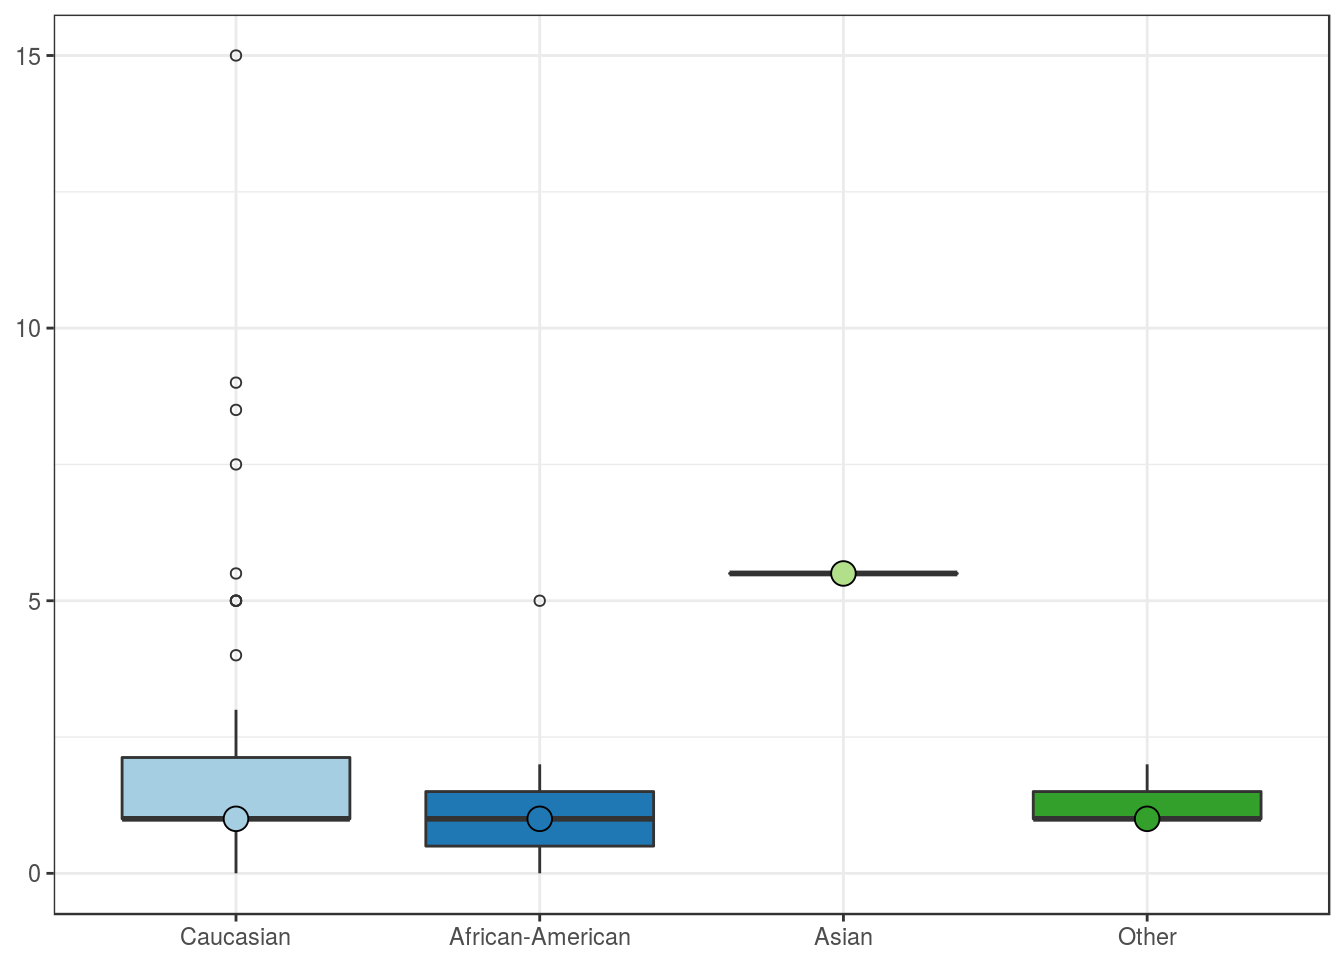
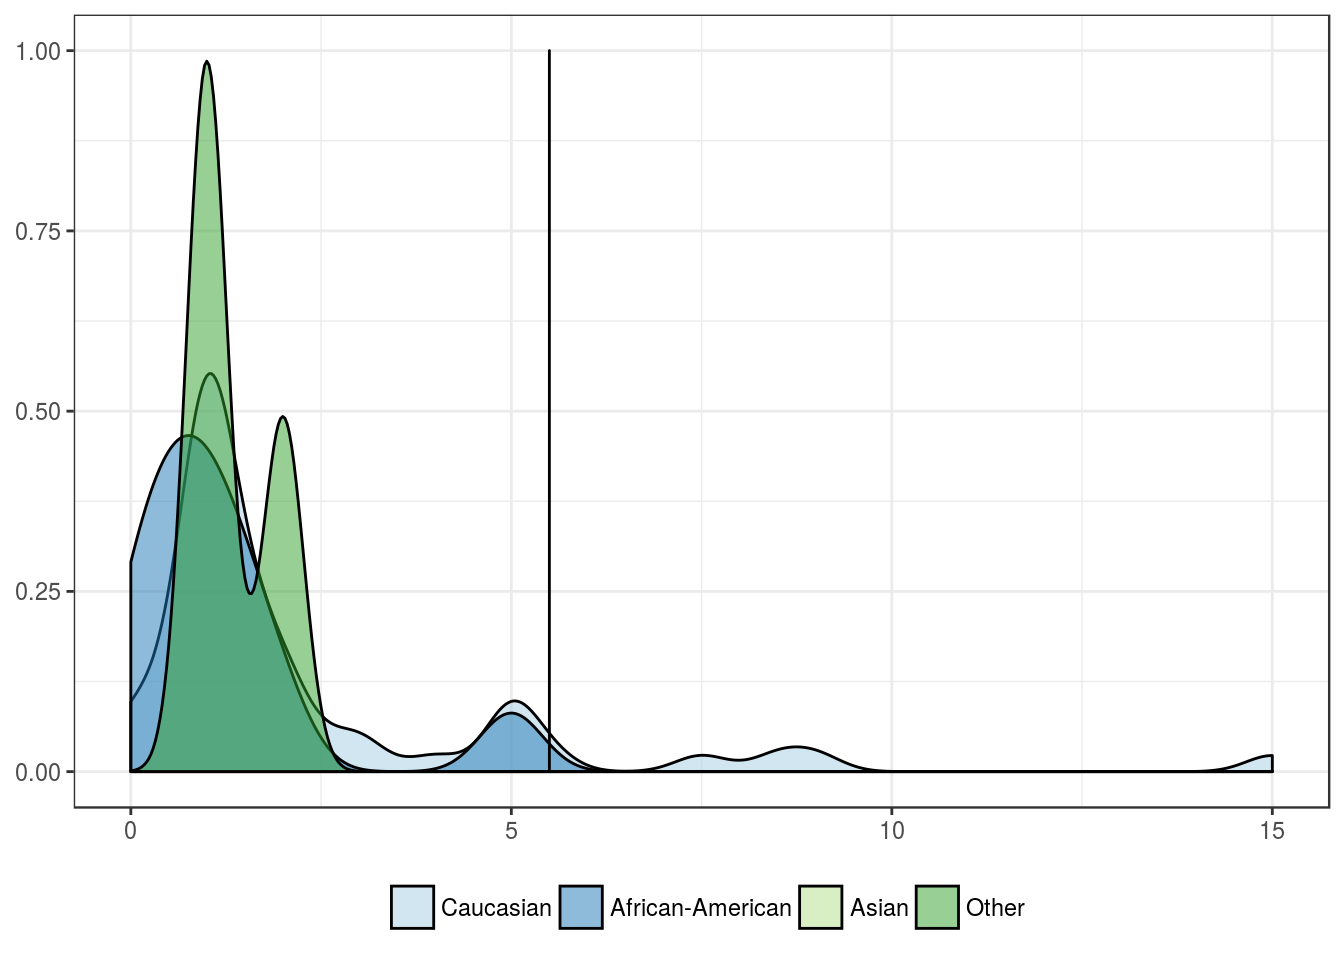
Patients’ race
| Caucasian | African-American | Asian | Other | |
|---|---|---|---|---|
| Mean | 2.3 | 1.2 | 5.5 | 1.3 |
| Standard deviation | 2.7 | 1.3 | NA | 0.6 |
| Median | 1.0 | 1.0 | 5.5 | 1.0 |
| Interquartile range | 1.1 | 1.0 | 0.0 | 0.5 |
| Minimum | 0.0 | 0.0 | 5.5 | 1.0 |
| Maximum | 15.0 | 5.0 | 5.5 | 2.0 |
| Value | |
|---|---|
| Statistic | 5.738 |
| Parameter | 3 |
| P statistic | 0.13 |
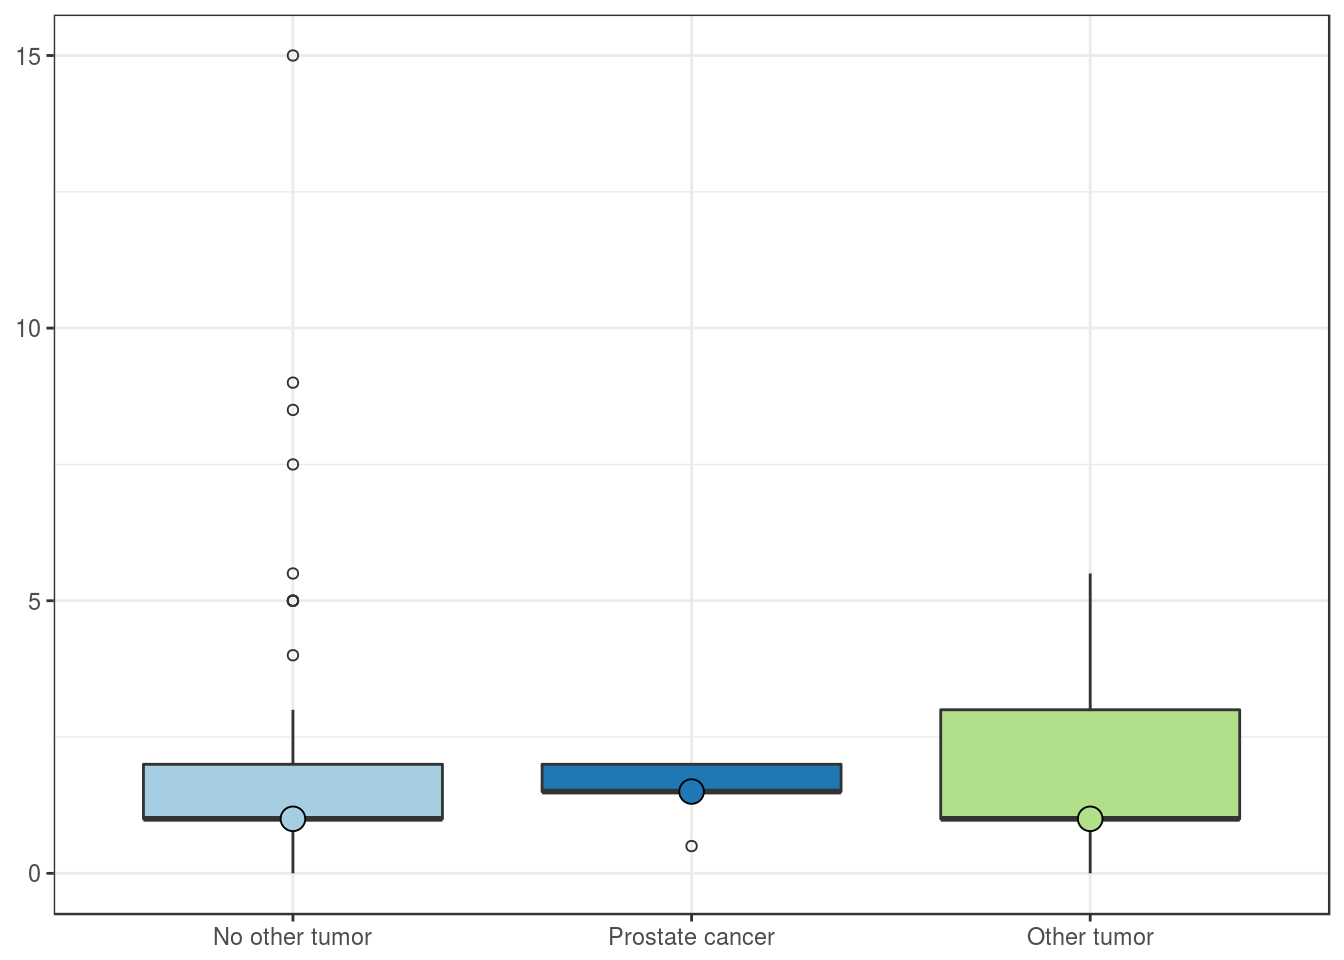
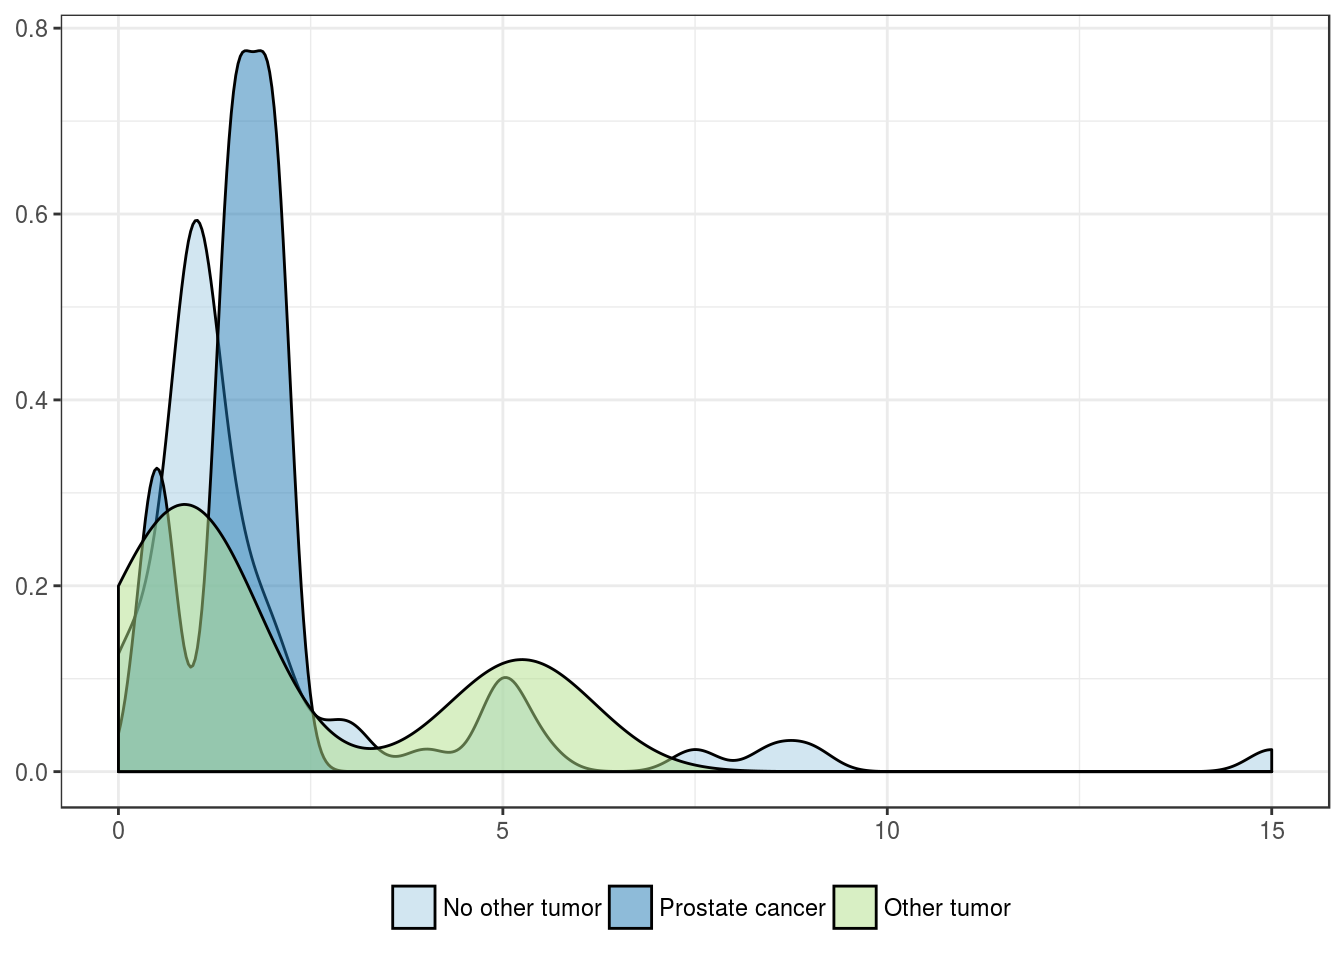
History of other malignancies
| No other tumor | Prostate cancer | Other tumor | |
|---|---|---|---|
| Mean | 2.2 | 1.5 | 2.1 |
| Standard deviation | 2.7 | 0.6 | 2.2 |
| Median | 1.0 | 1.5 | 1.0 |
| Interquartile range | 1.0 | 0.5 | 2.0 |
| Minimum | 0.0 | 0.5 | 0.0 |
| Maximum | 15.0 | 2.0 | 5.5 |
| Value | |
|---|---|
| Statistic | 0.3307 |
| Parameter | 2 |
| P statistic | 0.85 |
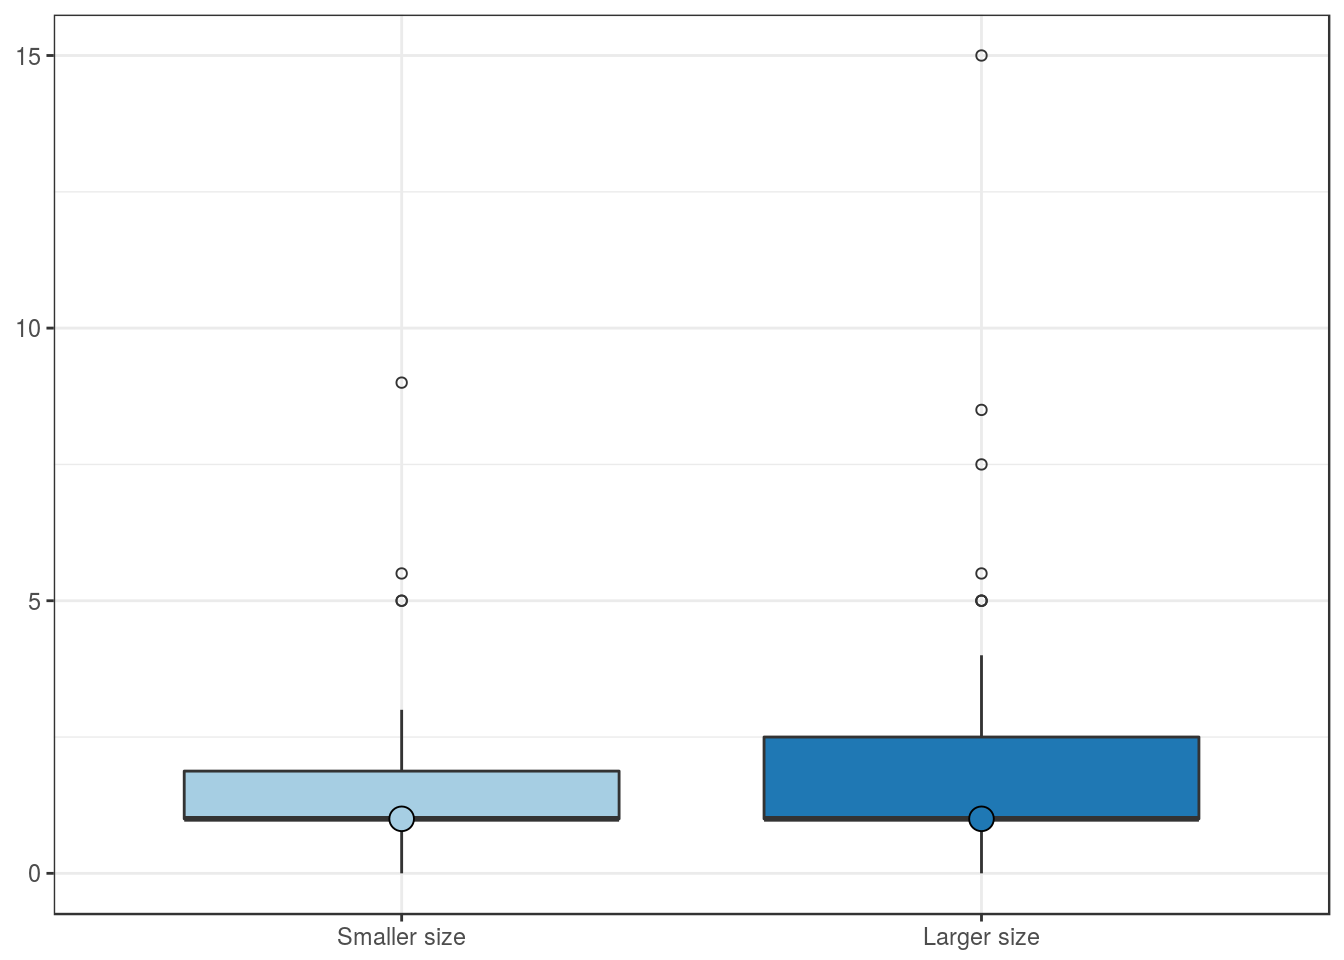
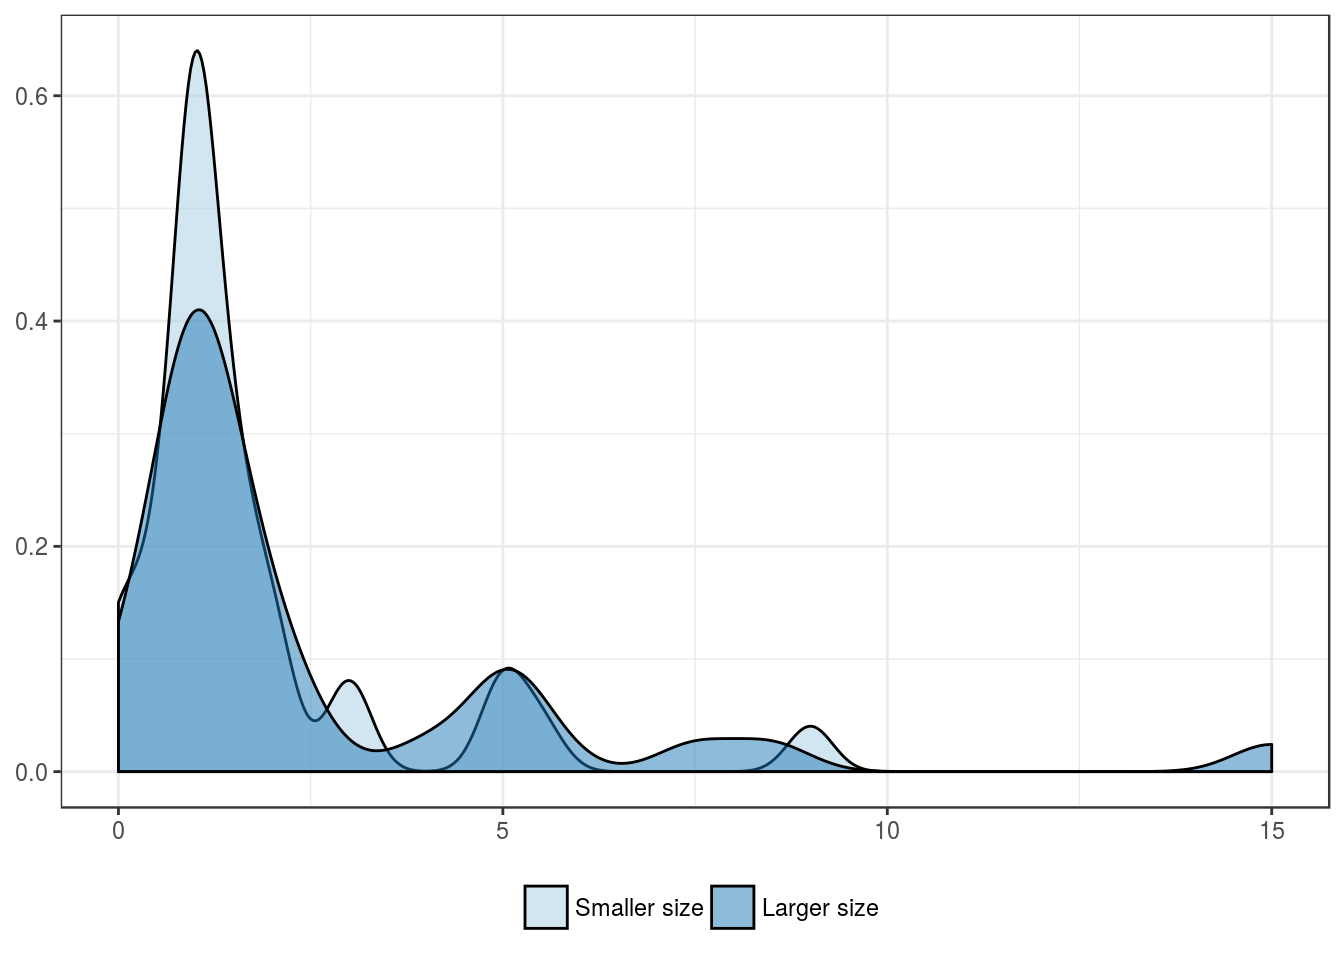
Pathologic features
Tumor size group
| Smaller size | Larger size | |
|---|---|---|
| Mean | 1.8 | 2.5 |
| Standard deviation | 1.9 | 3.1 |
| Median | 1.0 | 1.0 |
| Interquartile range | 0.9 | 1.5 |
| Minimum | 0.0 | 0.0 |
| Maximum | 9.0 | 15.0 |
| Value | |
|---|---|
| U-statistic | 496 |
| P statistic | 4.1e-01 |
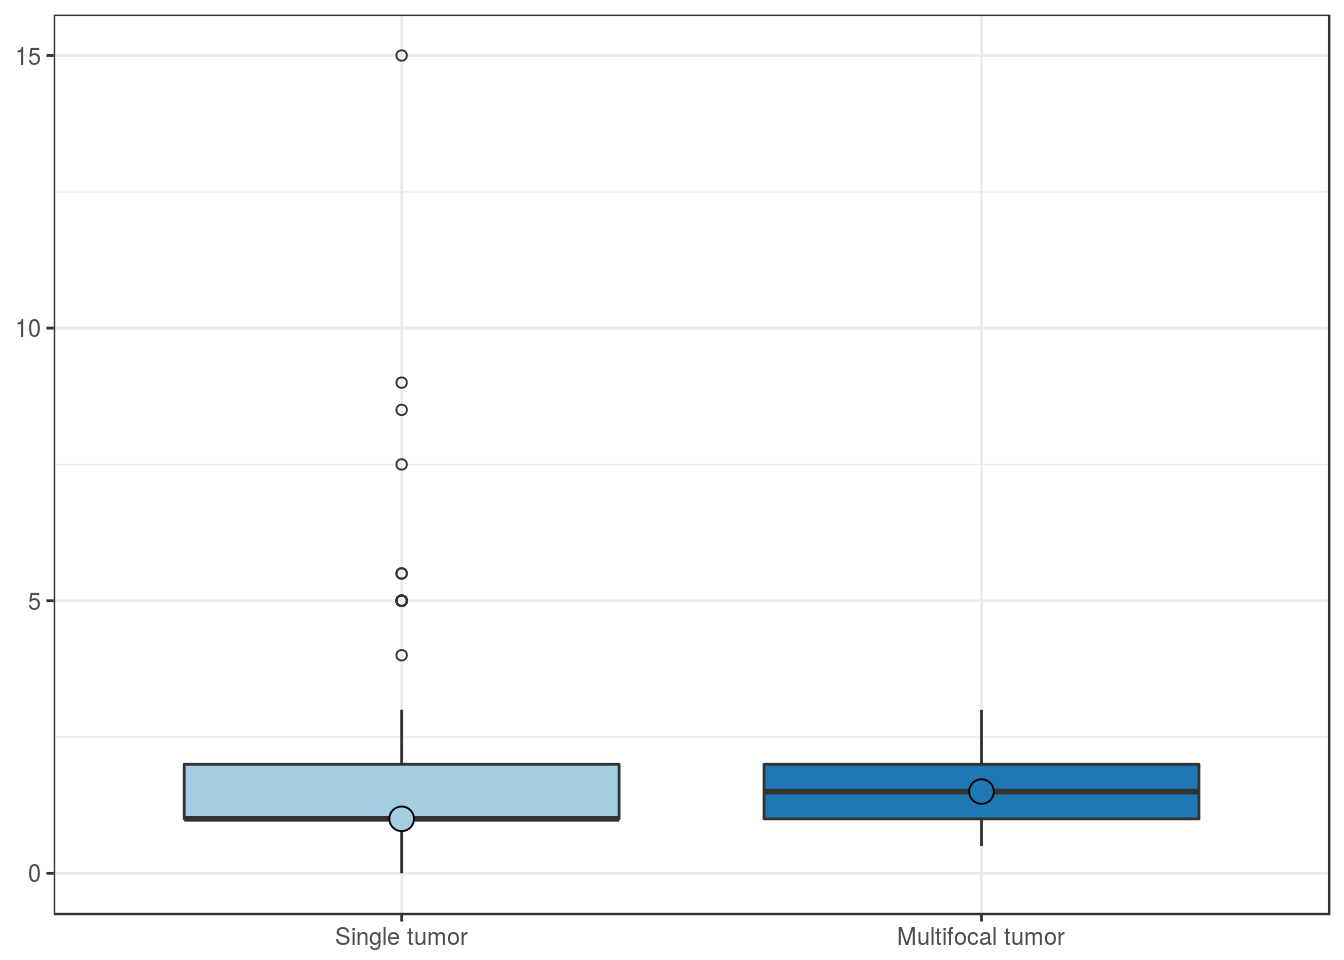
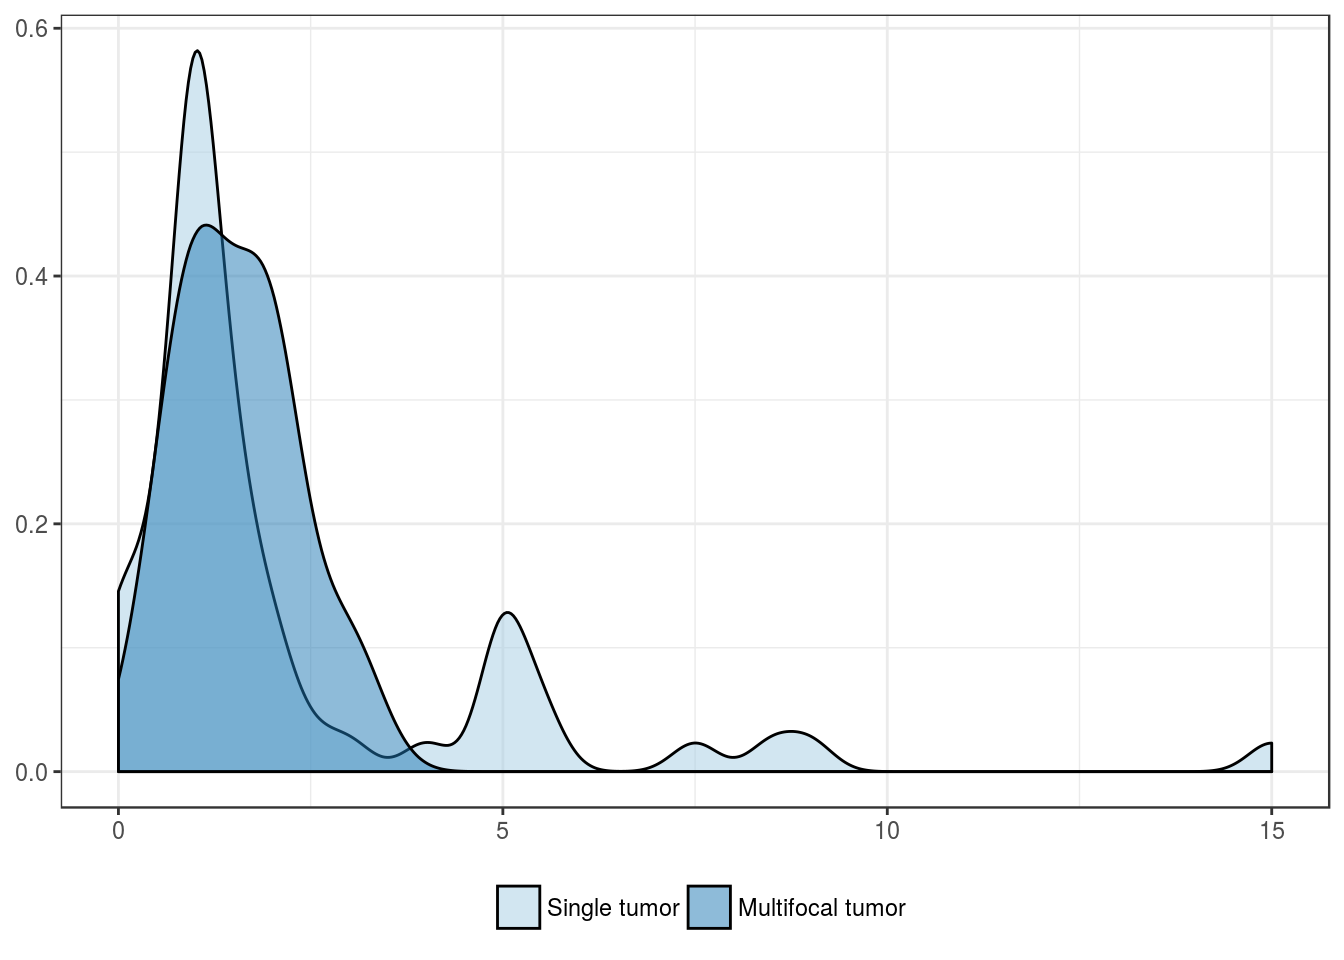
Multifocality
| Single tumor | Multifocal tumor | |
|---|---|---|
| Mean | 2.2 | 1.6 |
| Standard deviation | 2.7 | 0.8 |
| Median | 1.0 | 1.5 |
| Interquartile range | 1.0 | 1.0 |
| Minimum | 0.0 | 0.5 |
| Maximum | 15.0 | 3.0 |
| Value | |
|---|---|
| U-statistic | 244 |
| P statistic | 7.5e-01 |
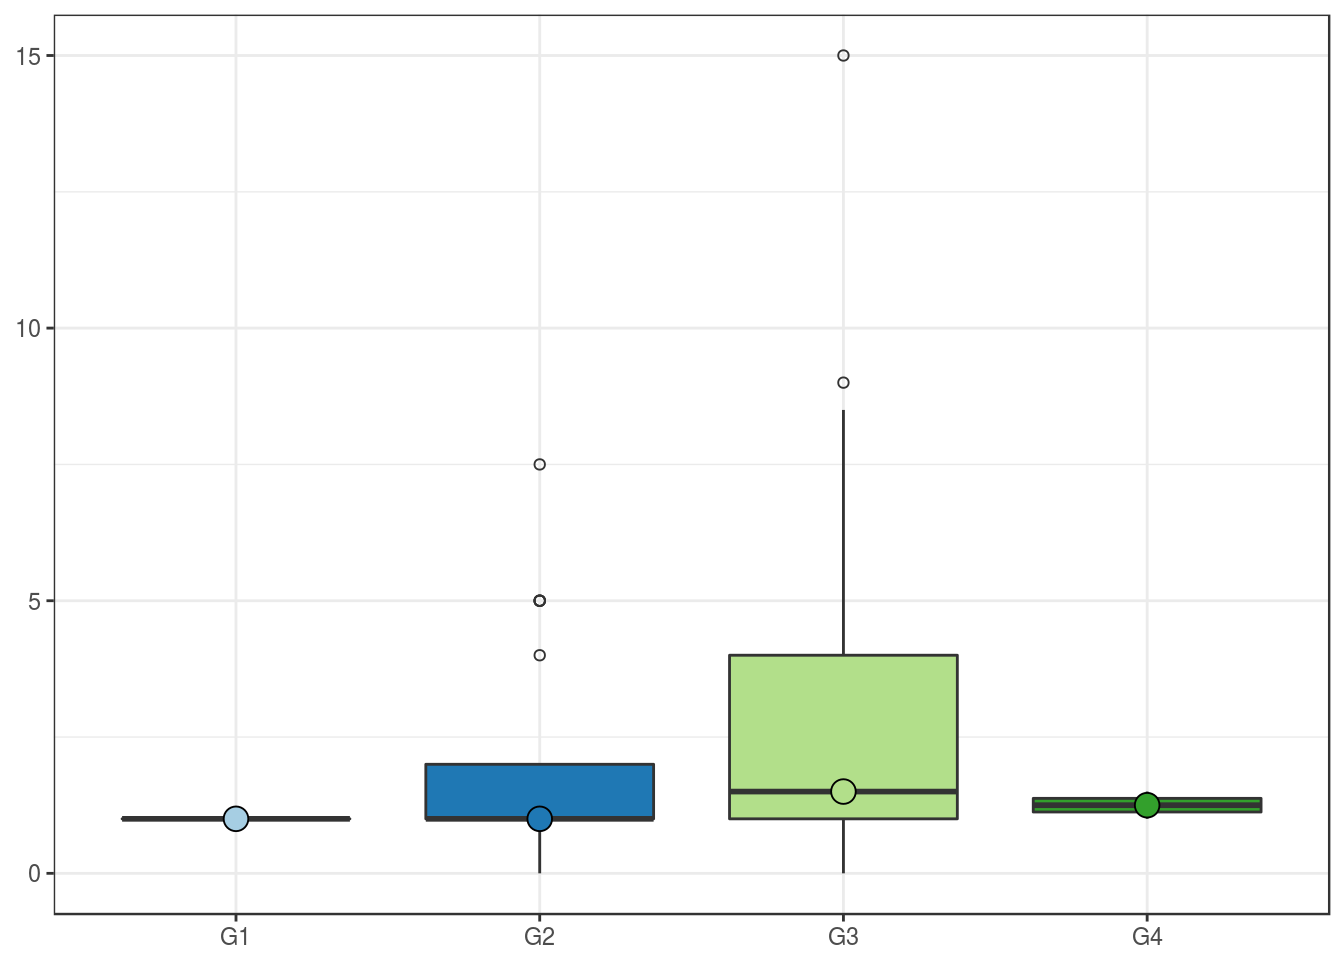
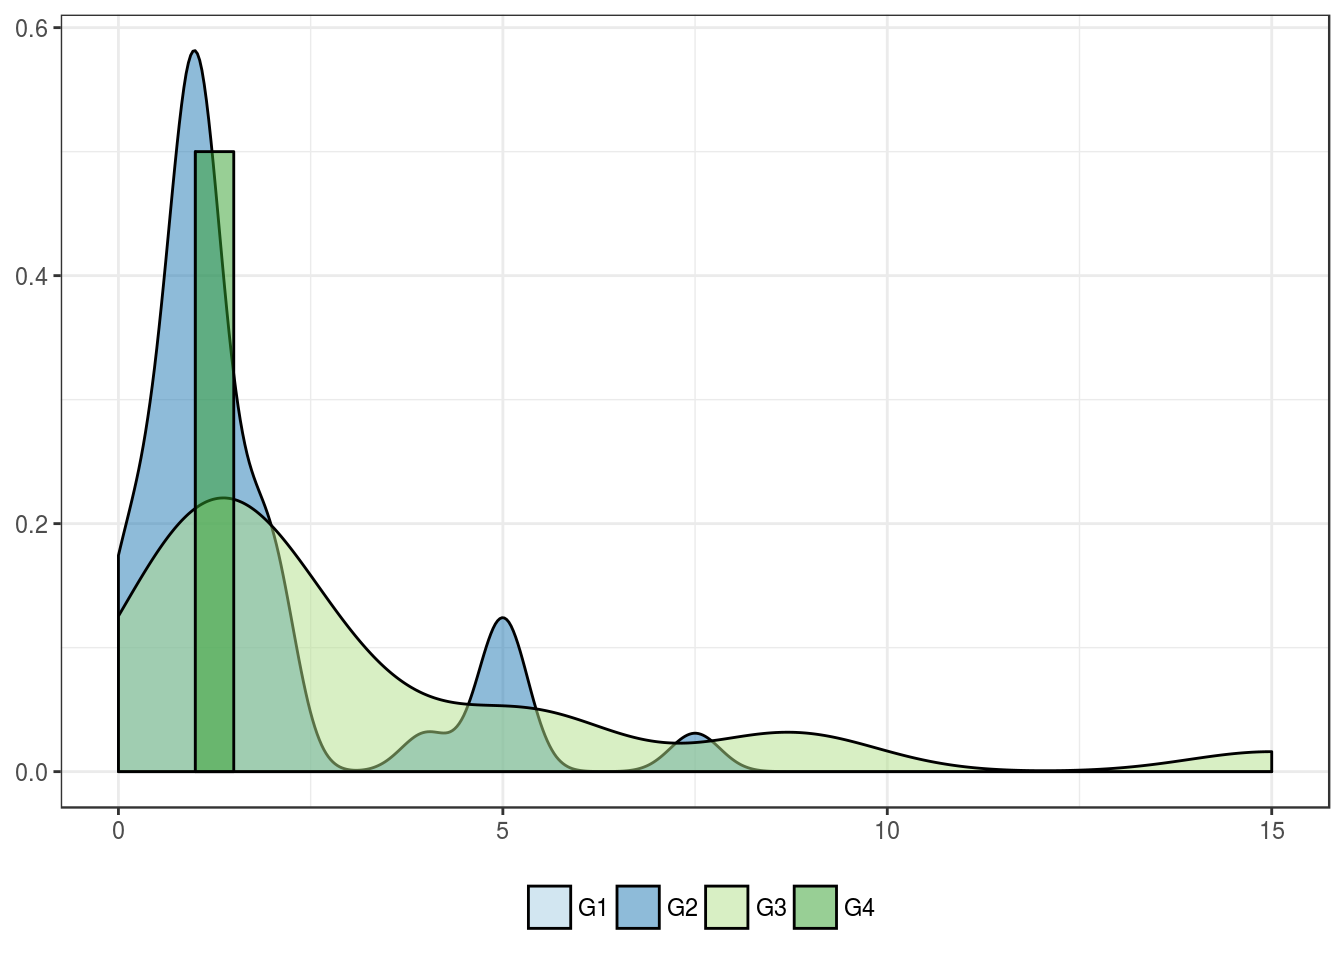
Fuhrman grade
| G1 | G2 | G3 | G4 | |
|---|---|---|---|---|
| Mean | 1 | 1.6 | 3.2 | 1.2 |
| Standard deviation | 0 | 1.7 | 3.5 | 0.4 |
| Median | 1 | 1.0 | 1.5 | 1.2 |
| Interquartile range | 0 | 1.0 | 3.0 | 0.2 |
| Minimum | 1 | 0.0 | 0.0 | 1.0 |
| Maximum | 1 | 7.5 | 15.0 | 1.5 |
| Value | |
|---|---|
| Statistic | 6.194 |
| Parameter | 3 |
| P statistic | 0.1 |
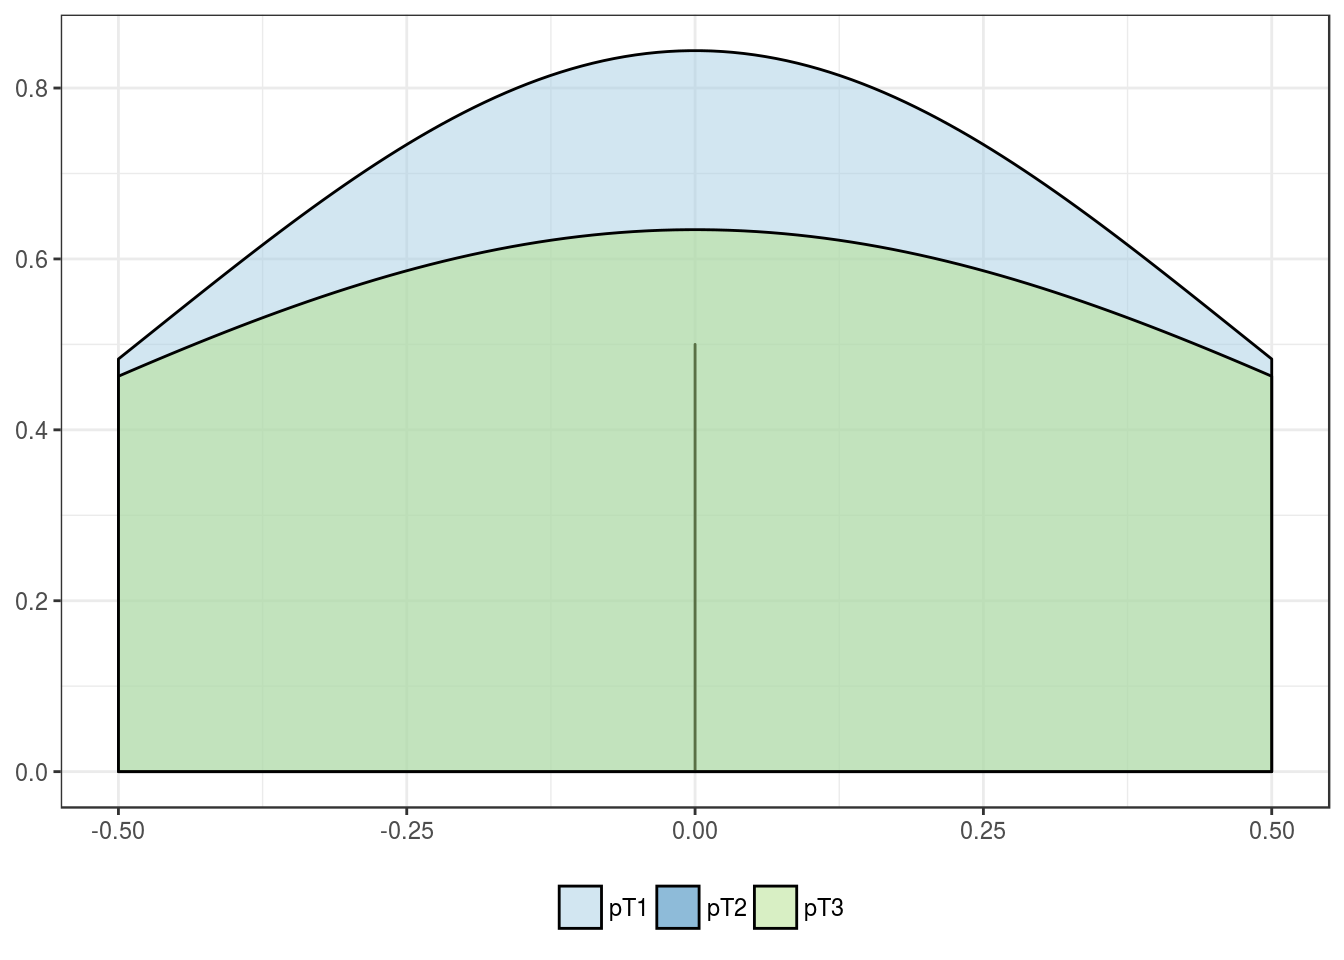
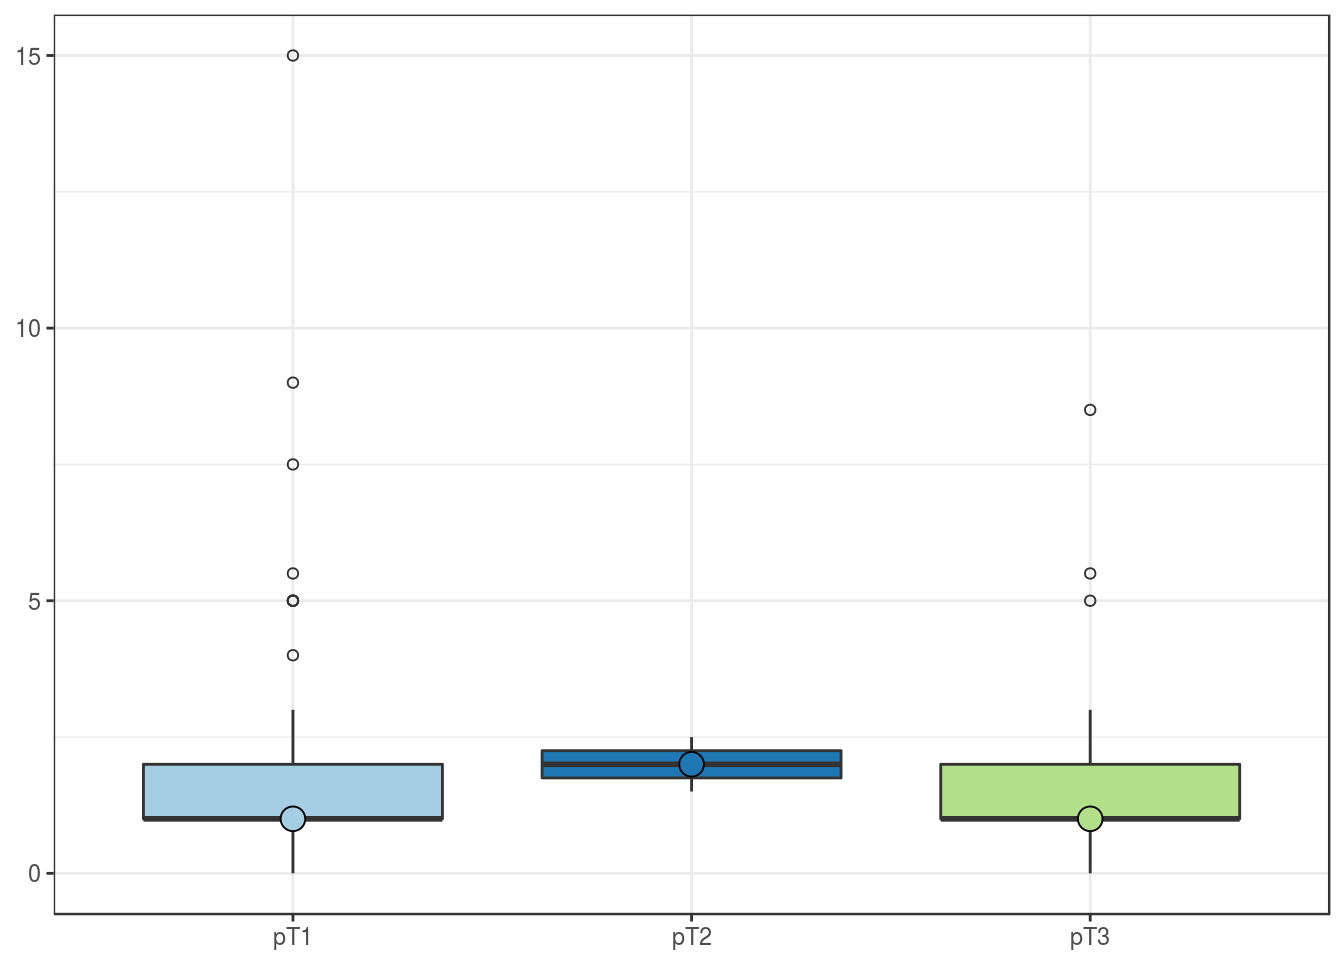
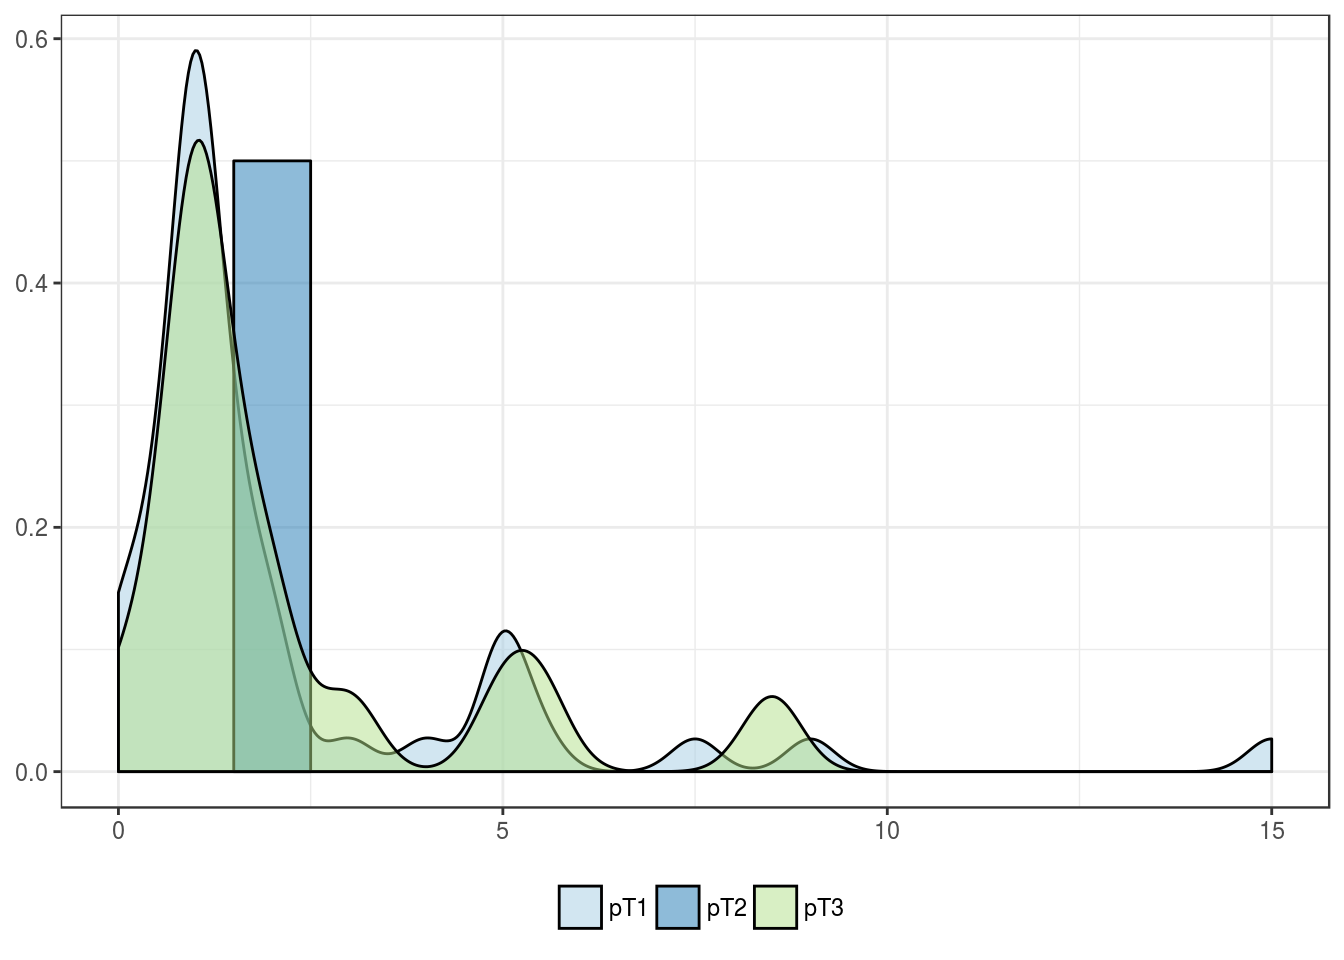
pT stage
| pT1 | pT2 | pT3 | |
|---|---|---|---|
| Mean | 2.1 | 2.0 | 2.1 |
| Standard deviation | 2.7 | 0.7 | 2.2 |
| Median | 1.0 | 2.0 | 1.0 |
| Interquartile range | 1.0 | 0.5 | 1.0 |
| Minimum | 0.0 | 1.5 | 0.0 |
| Maximum | 15.0 | 2.5 | 8.5 |
| Value | |
|---|---|
| Statistic | 1.347 |
| Parameter | 2 |
| P statistic | 0.51 |
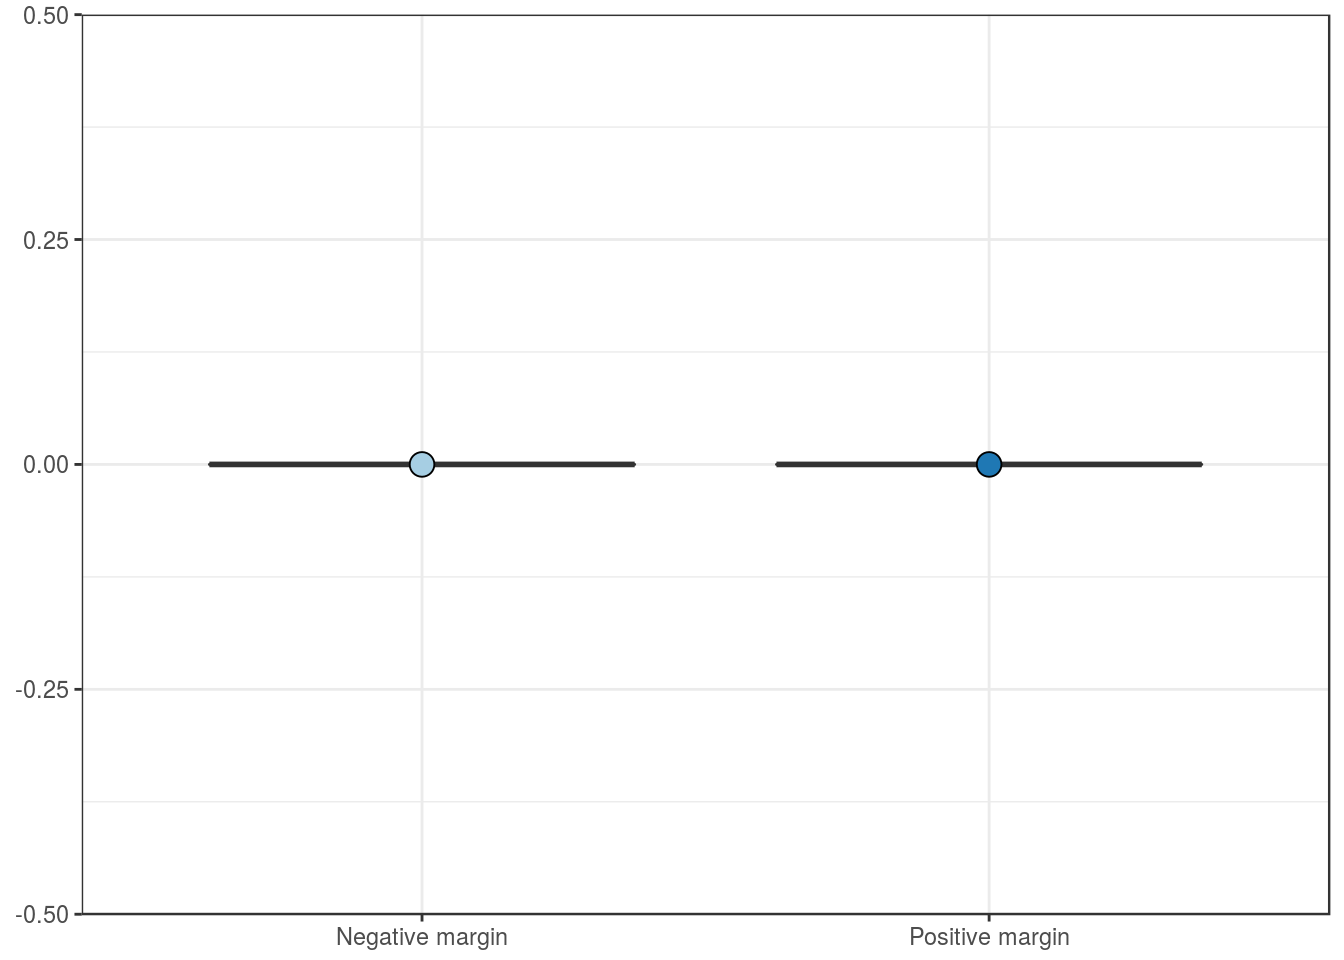
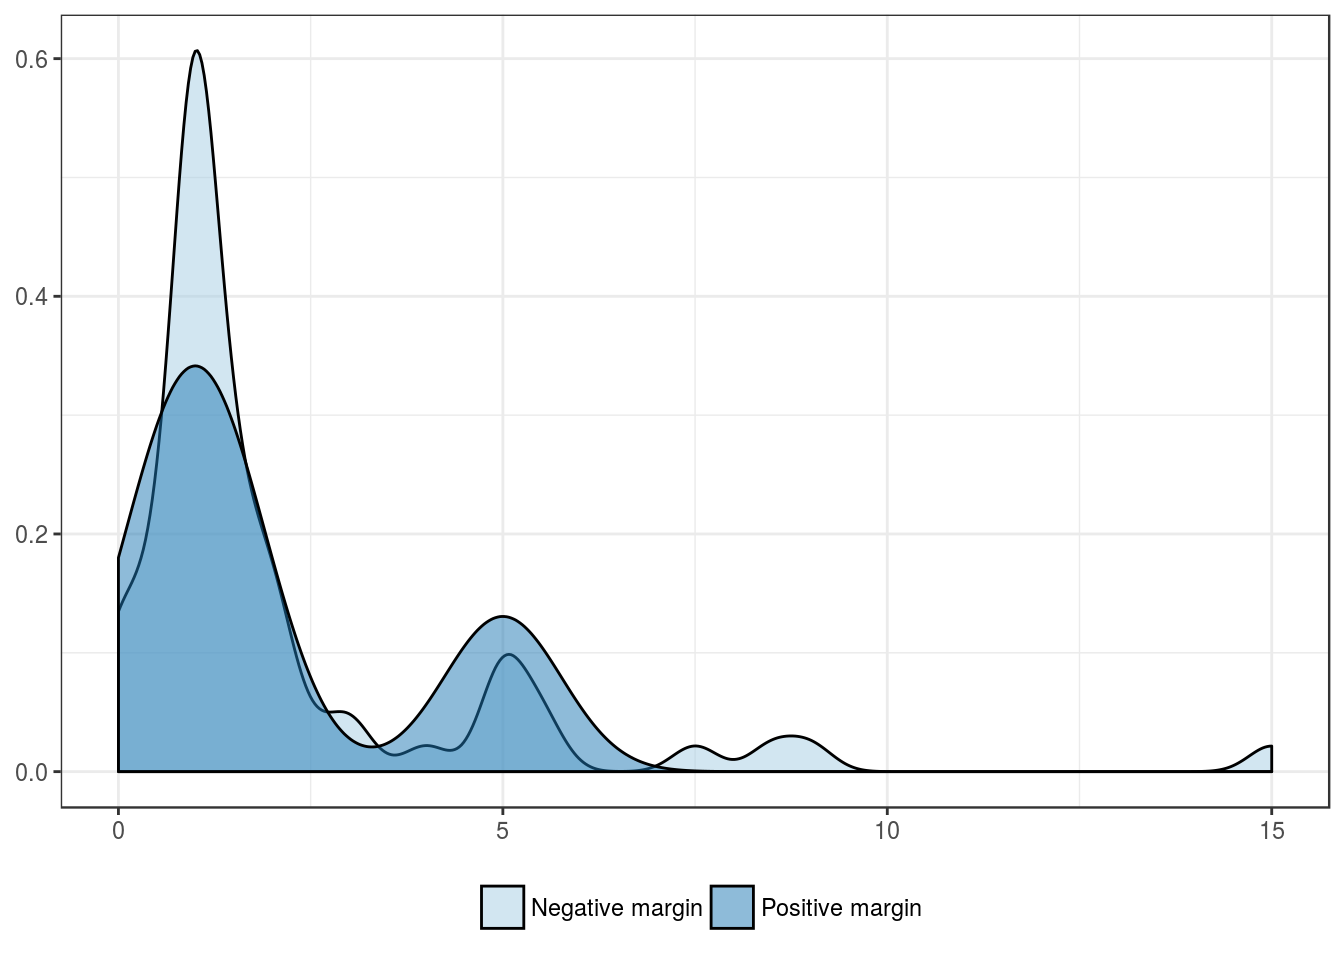
Surgical margin
| Negative margin | Positive margin | |
|---|---|---|
| Mean | 2.1 | 2.0 |
| Standard deviation | 2.6 | 2.0 |
| Median | 1.0 | 1.2 |
| Interquartile range | 1.0 | 1.5 |
| Minimum | 0.0 | 0.5 |
| Maximum | 15.0 | 5.0 |
| Value | |
|---|---|
| U-statistic | 128 |
| P statistic | 9.7e-01 |

Outcome features
Tumor progression
| No tumor progression | Tumor progression | |
|---|---|---|
| Mean | 2.2 | 1.9 |
| Standard deviation | 2.7 | 1.6 |
| Median | 1.0 | 1.5 |
| Interquartile range | 1.0 | 1.0 |
| Minimum | 0.0 | 0.5 |
| Maximum | 15.0 | 5.5 |
| Value | |
|---|---|
| U-statistic | 218 |
| P statistic | 7.3e-01 |
Overall mortality
| ANOD + AWD | DOC + DOD | |
|---|---|---|
| Mean | 2.3 | 1.4 |
| Standard deviation | 2.7 | 1.4 |
| Median | 1.0 | 1.0 |
| Interquartile range | 1.1 | 0.6 |
| Minimum | 0.0 | 0.0 |
| Maximum | 15.0 | 5.5 |
| Value | |
|---|---|
| U-statistic | 410 |
| P statistic | 2.2e-01 |
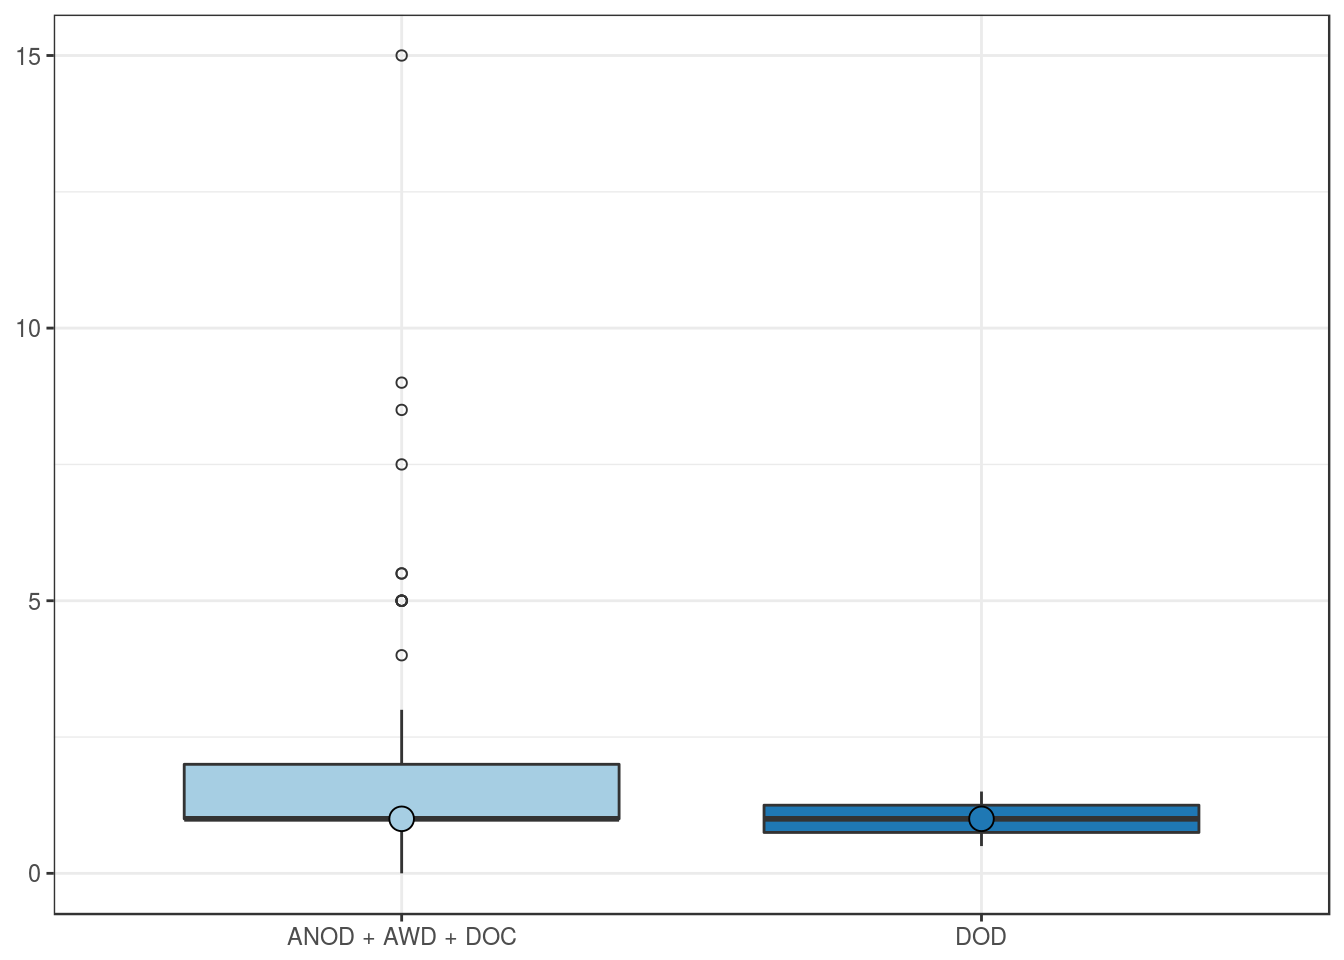
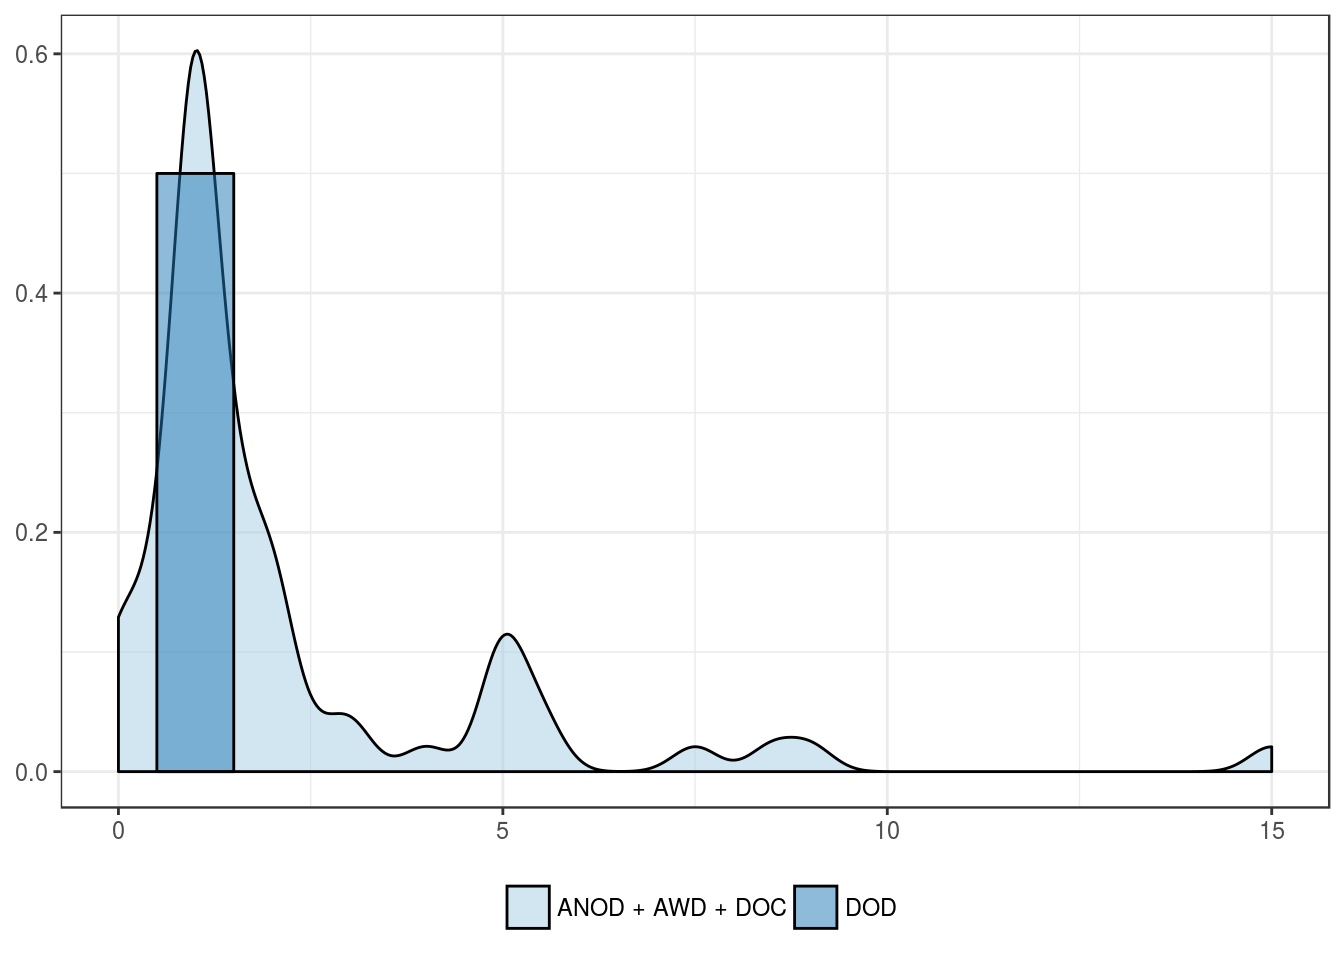
Cancer-related mortality
| ANOD + AWD + DOC | DOD | |
|---|---|---|
| Mean | 2.2 | 1.0 |
| Standard deviation | 2.6 | 0.7 |
| Median | 1.0 | 1.0 |
| Interquartile range | 1.0 | 0.5 |
| Minimum | 0.0 | 0.5 |
| Maximum | 15.0 | 1.5 |
| Value | |
|---|---|
| U-statistic | 84.5 |
| P statistic | 5e-01 |