FOXP3 expression in metastatic tumors
FOXP3 positivity in intratumoral lymphocytes
Clinical features
Patients’ age group, in years
| Younger age | Older age | |
|---|---|---|
| Mean | 3.2 | 2.5 |
| Standard deviation | 6.2 | 2.8 |
| Median | 1.0 | 2.0 |
| Interquartile range | 3.0 | 2.0 |
| Minimum | 0.0 | 0.0 |
| Maximum | 24.0 | 11.0 |
| Value | |
|---|---|
| U-statistic | 160 |
| P statistic | 4.4e-01 |
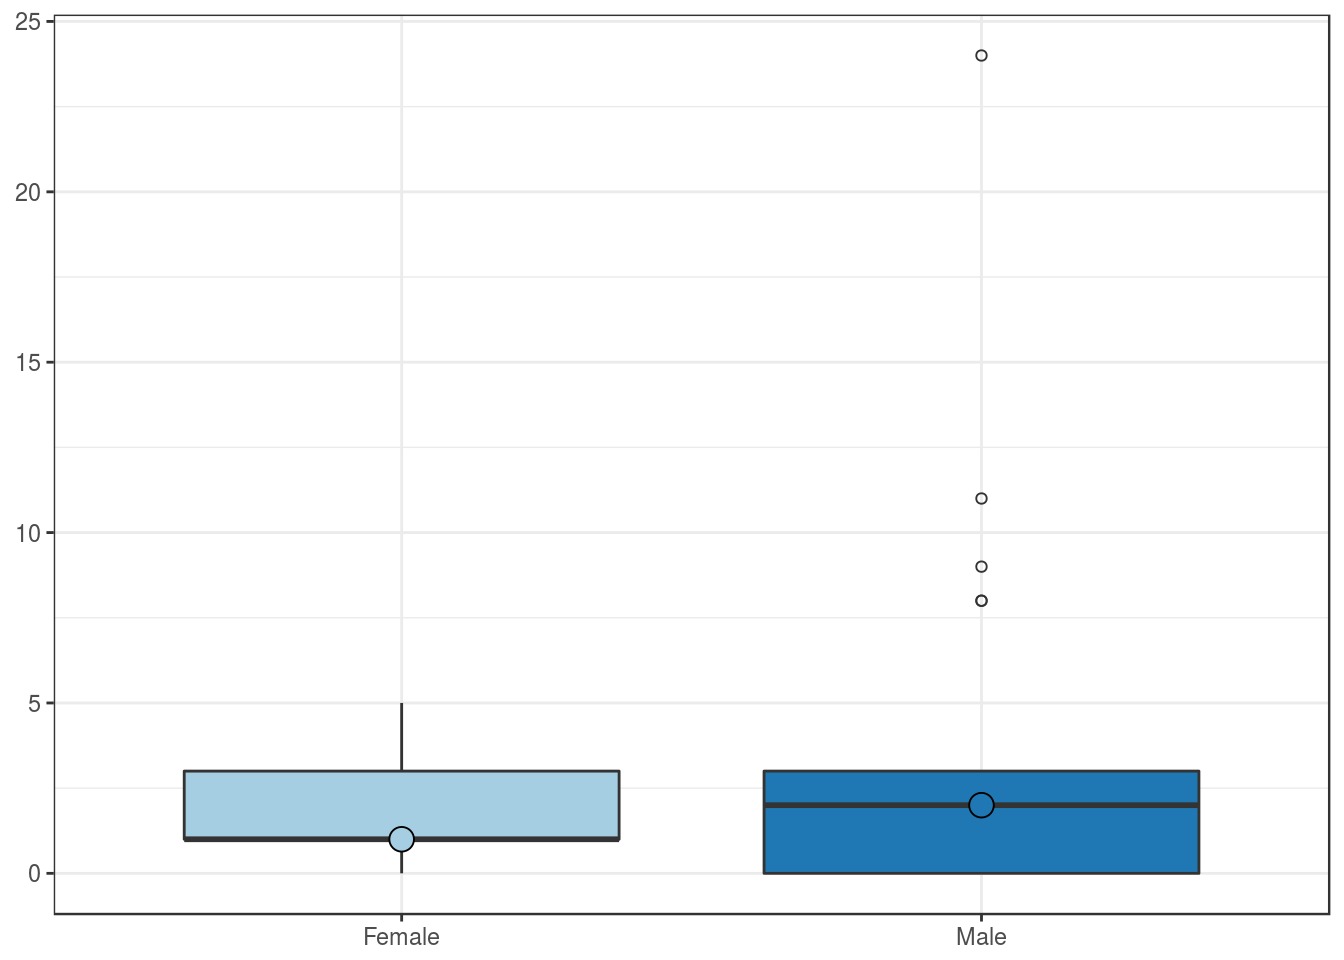
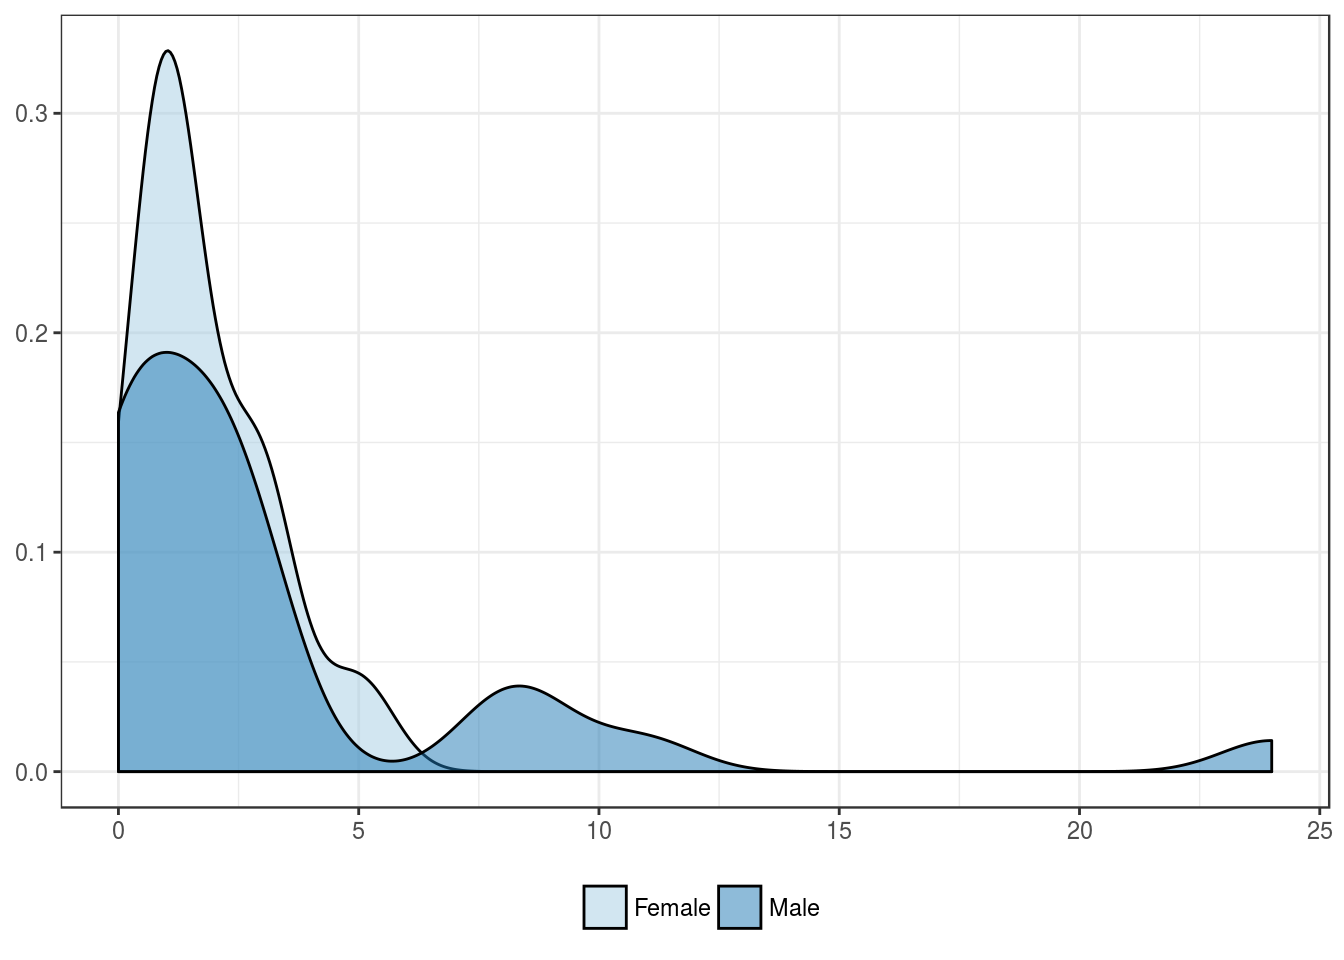
Patients’ sex
| Female | Male | |
|---|---|---|
| Mean | 1.8 | 3.3 |
| Standard deviation | 1.4 | 5.1 |
| Median | 1.0 | 2.0 |
| Interquartile range | 2.0 | 3.0 |
| Minimum | 0.0 | 0.0 |
| Maximum | 5.0 | 24.0 |
| Value | |
|---|---|
| U-statistic | 171 |
| P statistic | 9.1e-01 |
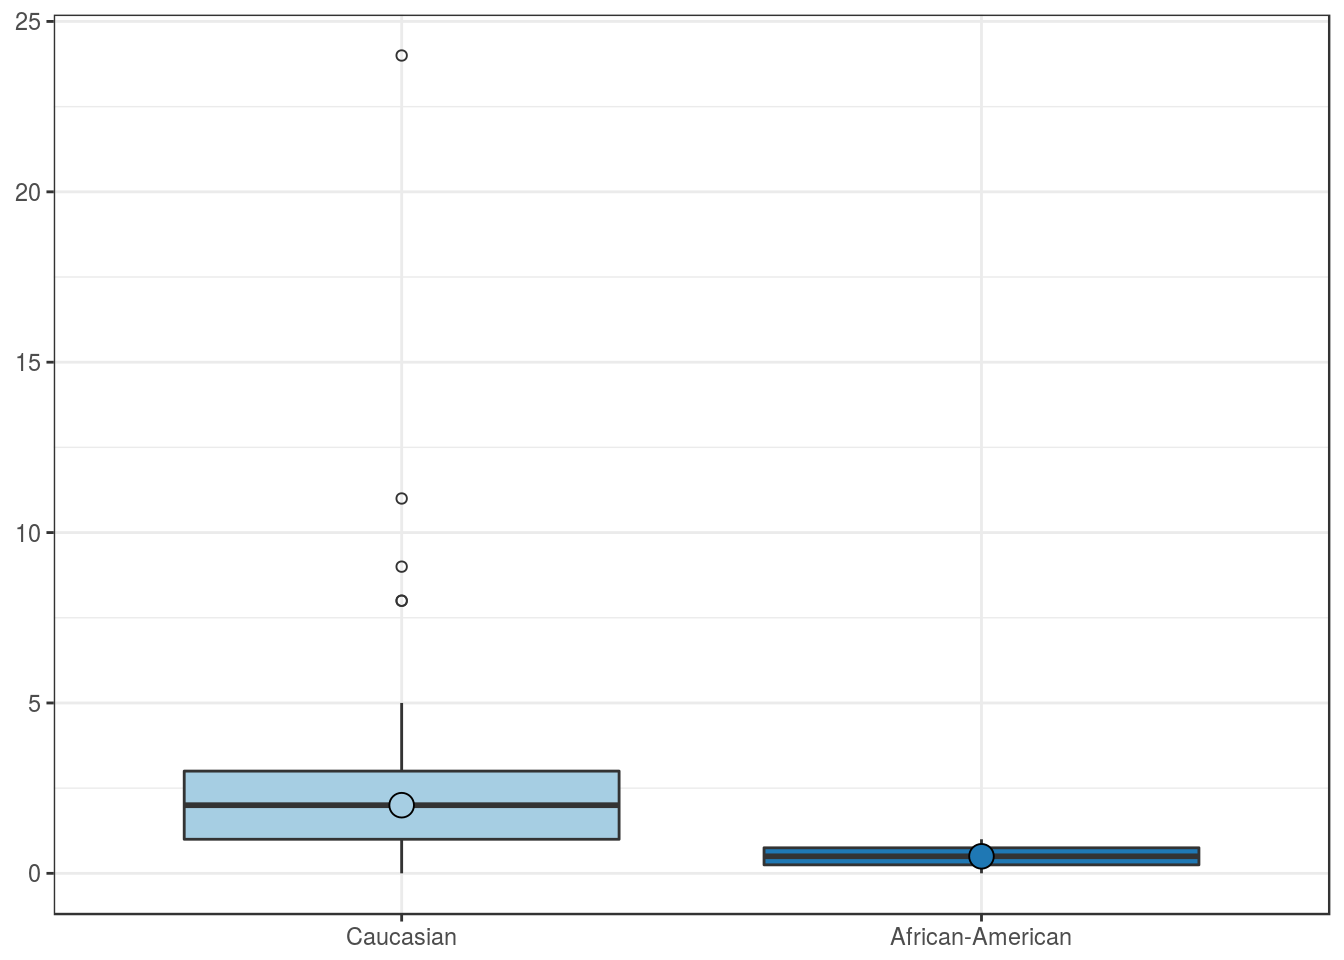
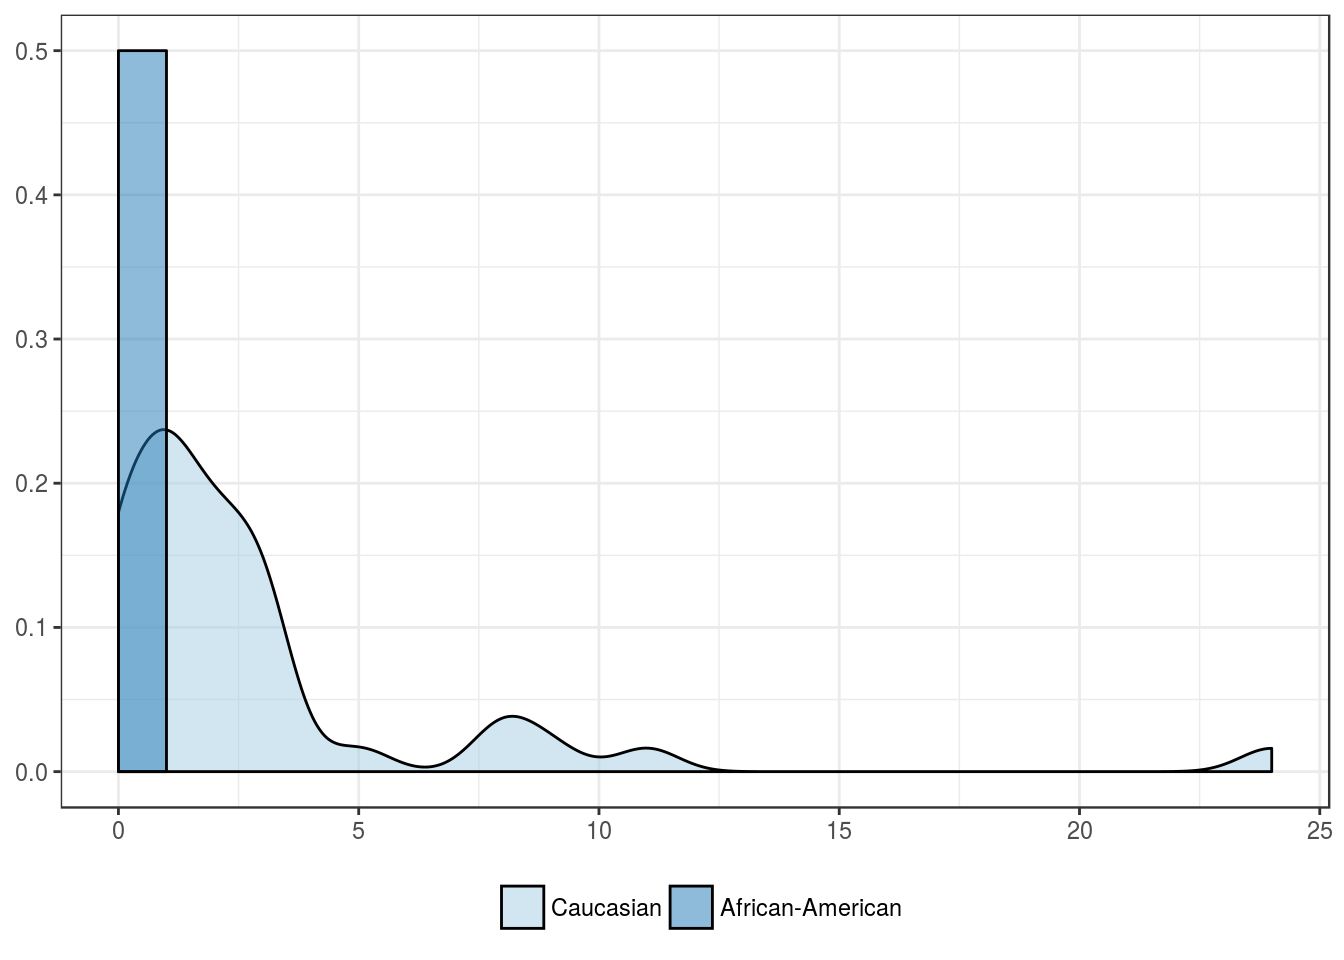
Patients’ race
| Caucasian | African-American | Asian | Other | |
|---|---|---|---|---|
| Mean | 2.9 | 0.5 | NA | NA |
| Standard deviation | 4.4 | 0.7 | NA | NA |
| Median | 2.0 | 0.5 | NA | NA |
| Interquartile range | 2.0 | 0.5 | NA | NA |
| Minimum | 0.0 | 0.0 | NA | NA |
| Maximum | 24.0 | 1.0 | NA | NA |
| Value | |
|---|---|
| Statistic | 1.774 |
| Parameter | 1 |
| P statistic | 0.18 |
Outcome features
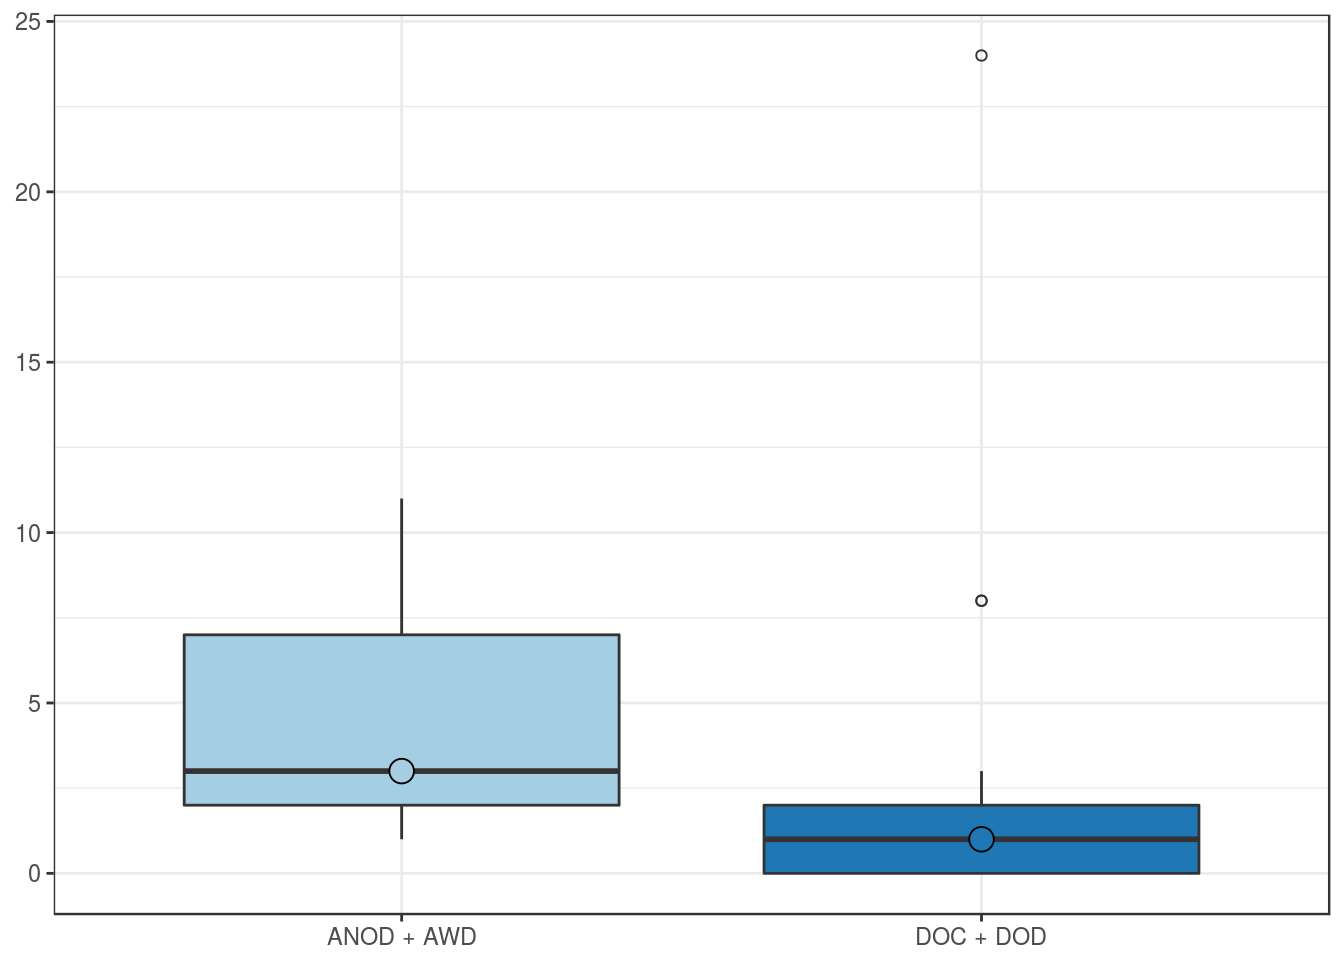
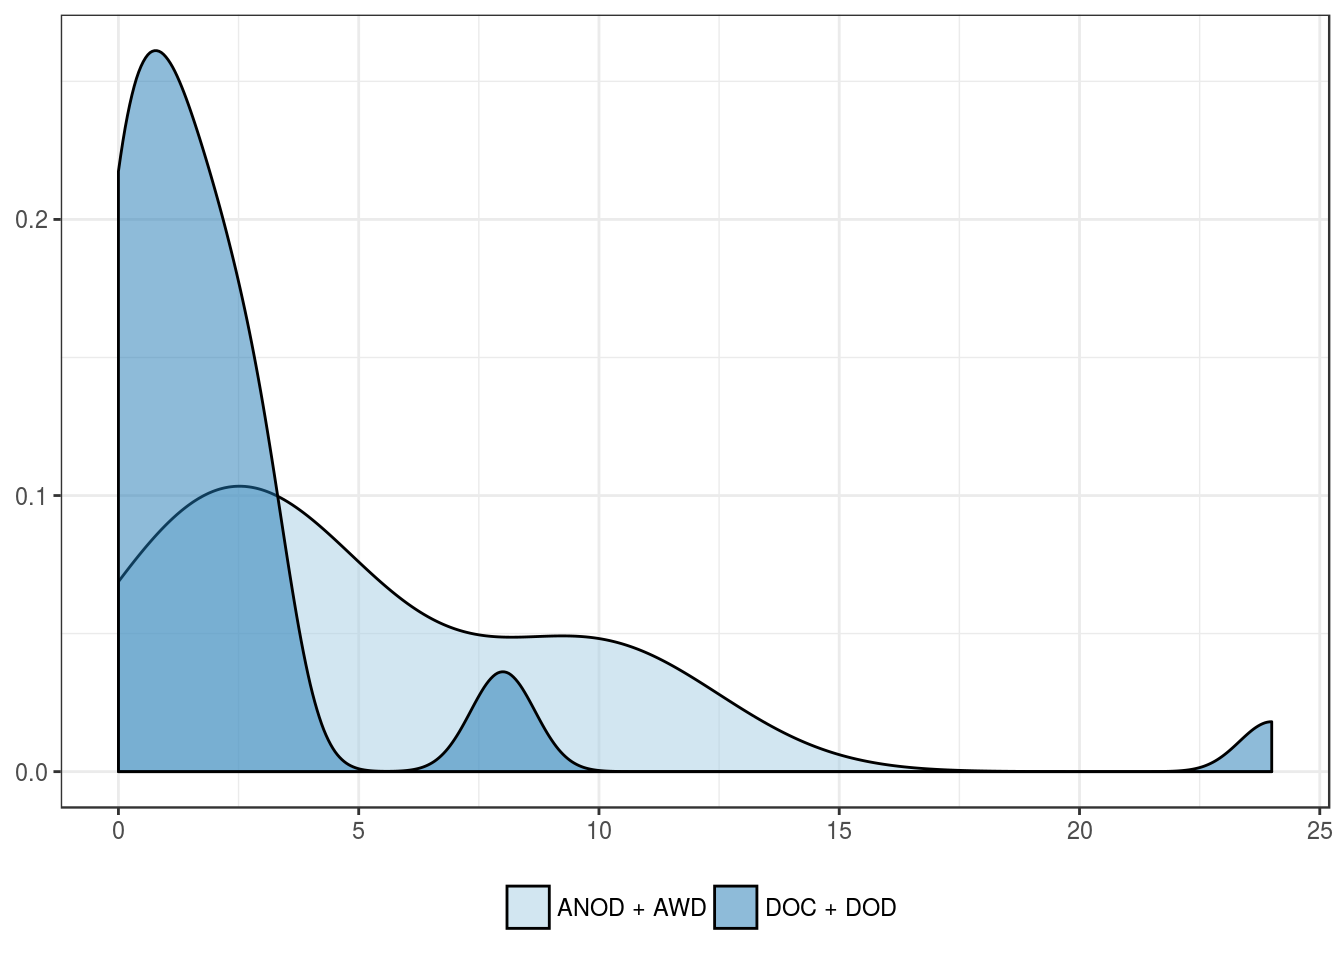
Overall mortality
| ANOD + AWD | DOC + DOD | |
|---|---|---|
| Mean | 4.7 | 2.4 |
| Standard deviation | 3.9 | 4.3 |
| Median | 3.0 | 1.0 |
| Interquartile range | 5.0 | 2.0 |
| Minimum | 1.0 | 0.0 |
| Maximum | 11.0 | 24.0 |
| Value | |
|---|---|
| U-statistic | 176 |
| P statistic | 2.9e-02 |
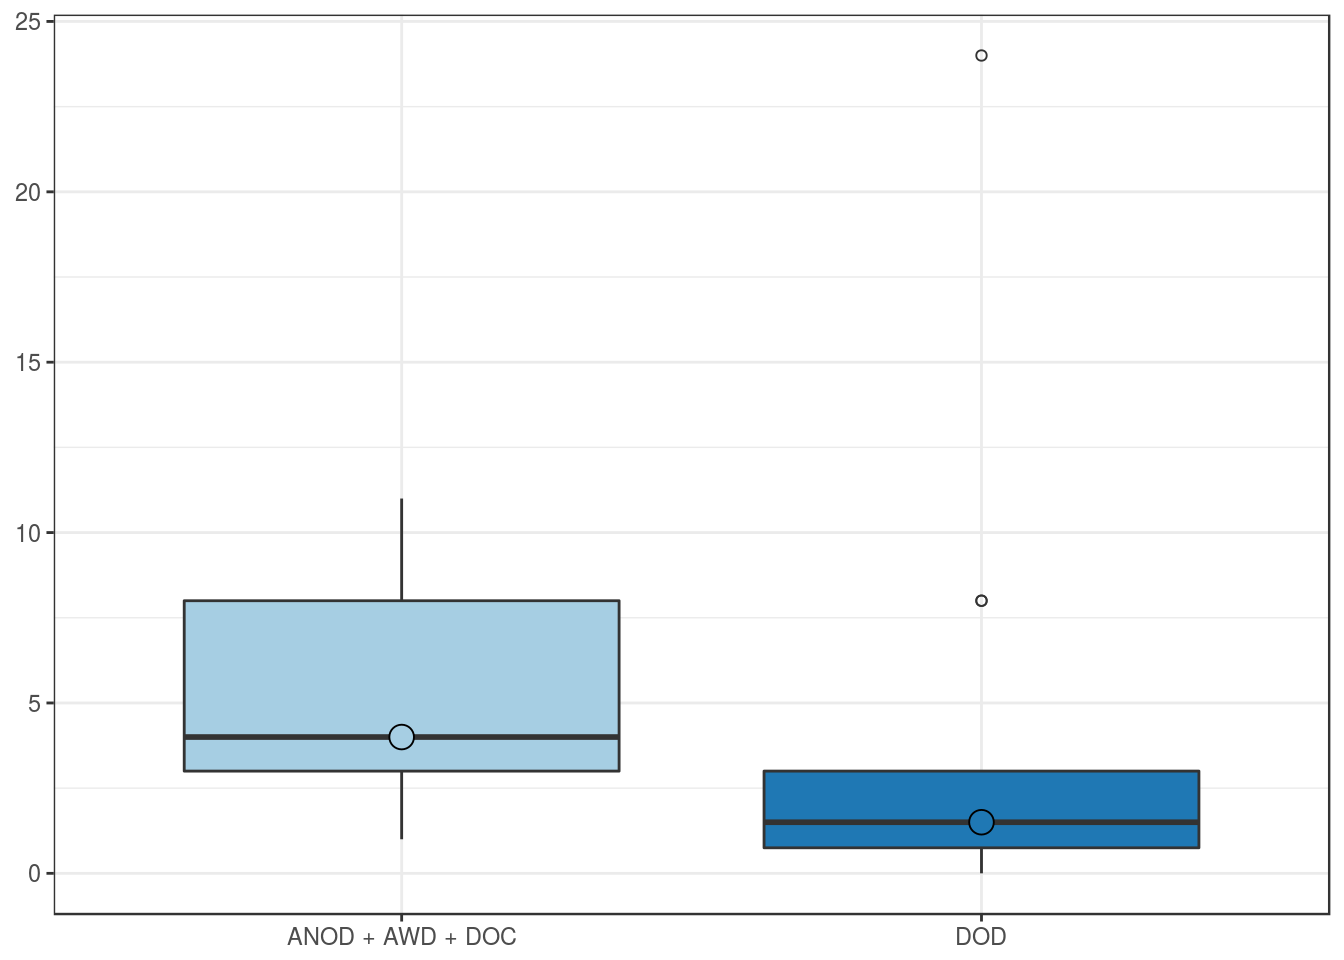
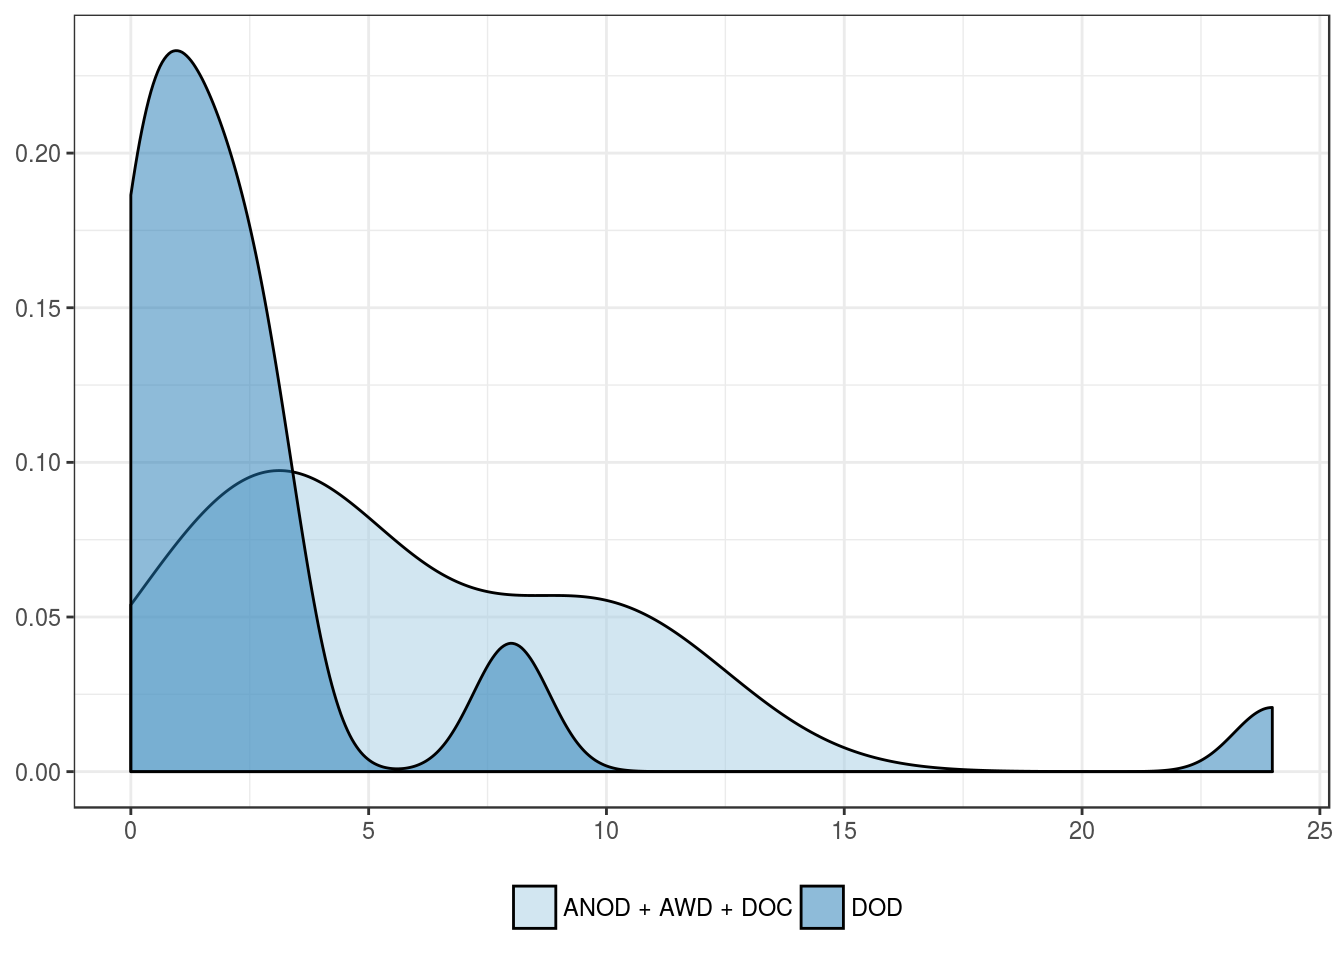
Cancer-related mortality
| ANOD + AWD + DOC | DOD | |
|---|---|---|
| Mean | 5.3 | 2.8 |
| Standard deviation | 3.9 | 5.0 |
| Median | 4.0 | 1.5 |
| Interquartile range | 5.0 | 2.2 |
| Minimum | 1.0 | 0.0 |
| Maximum | 11.0 | 24.0 |
| Value | |
|---|---|
| U-statistic | 114 |
| P statistic | 2.9e-02 |
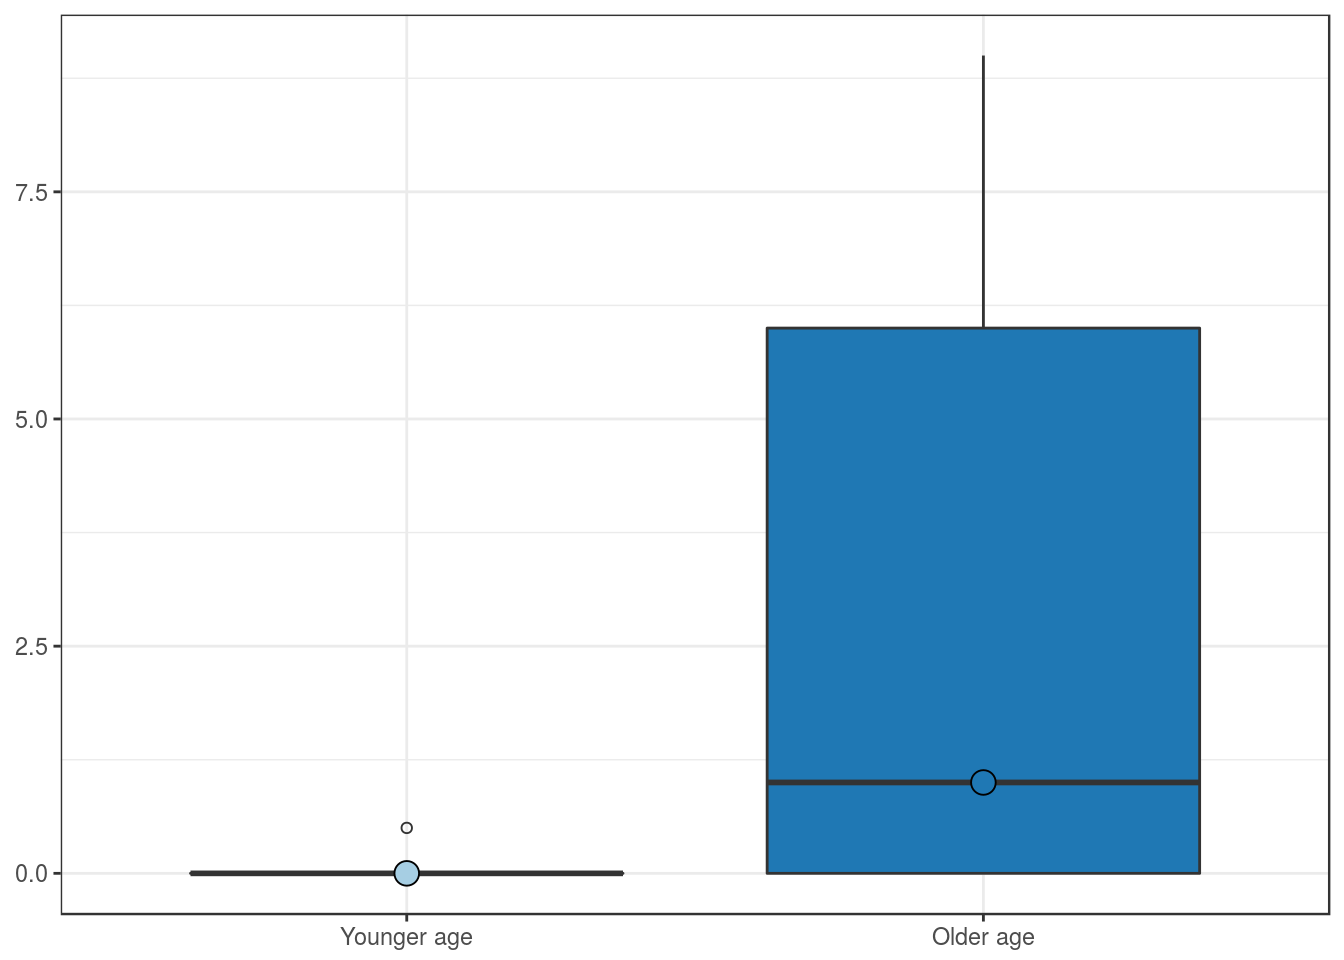
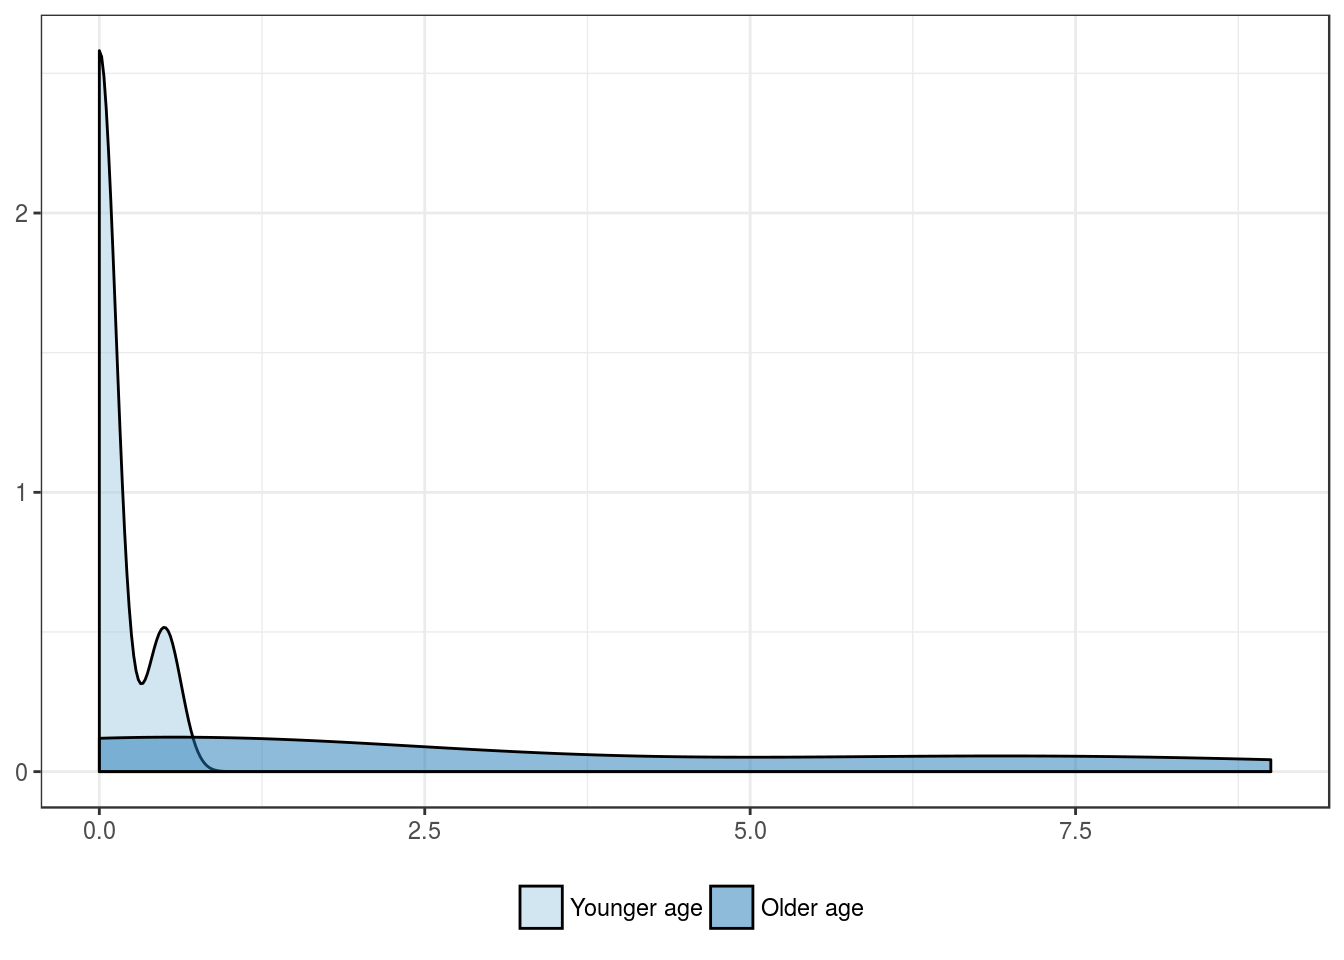
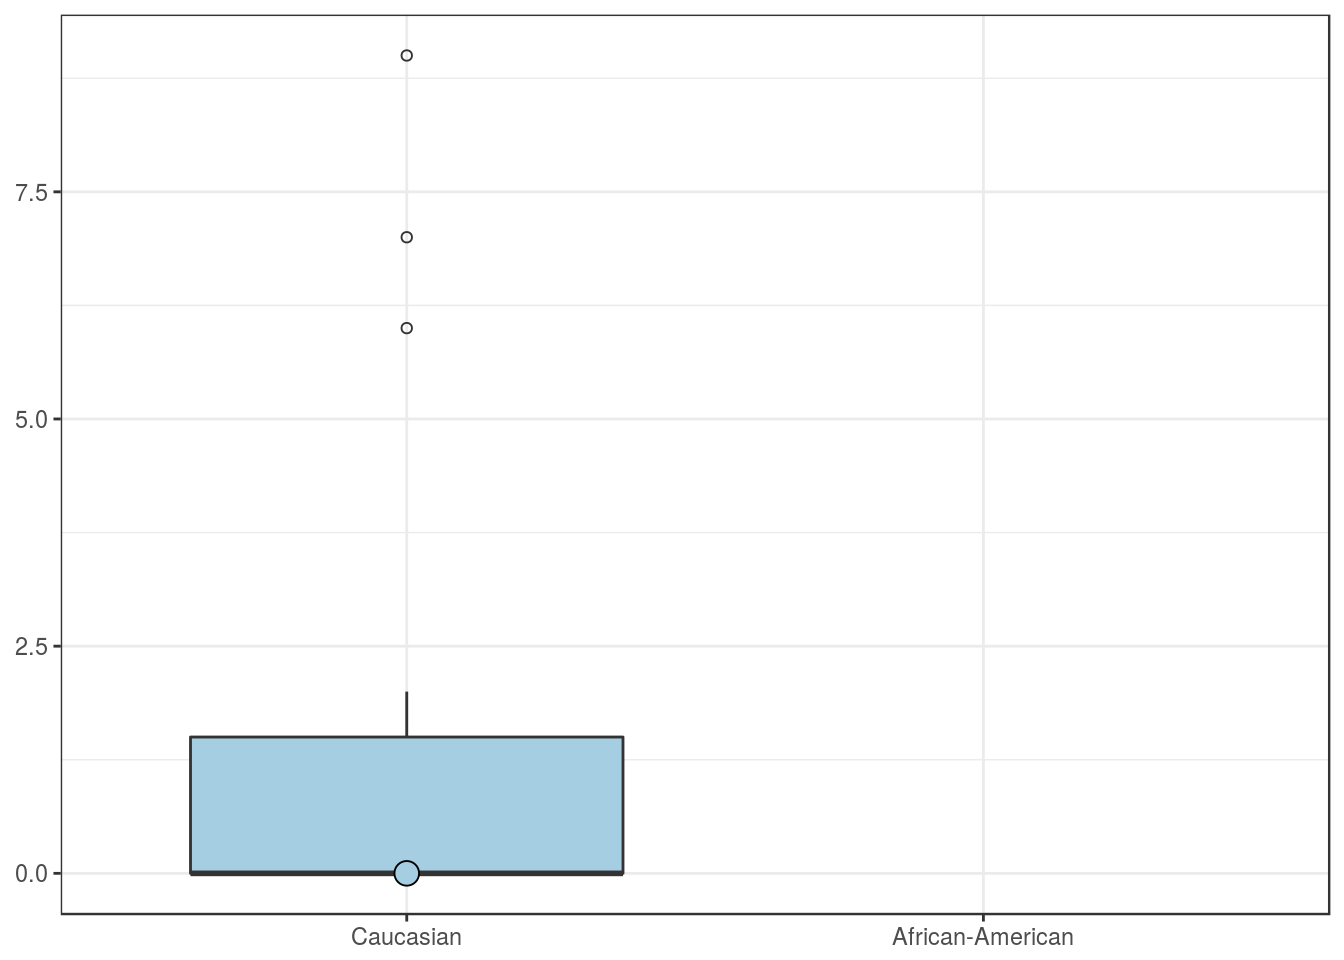
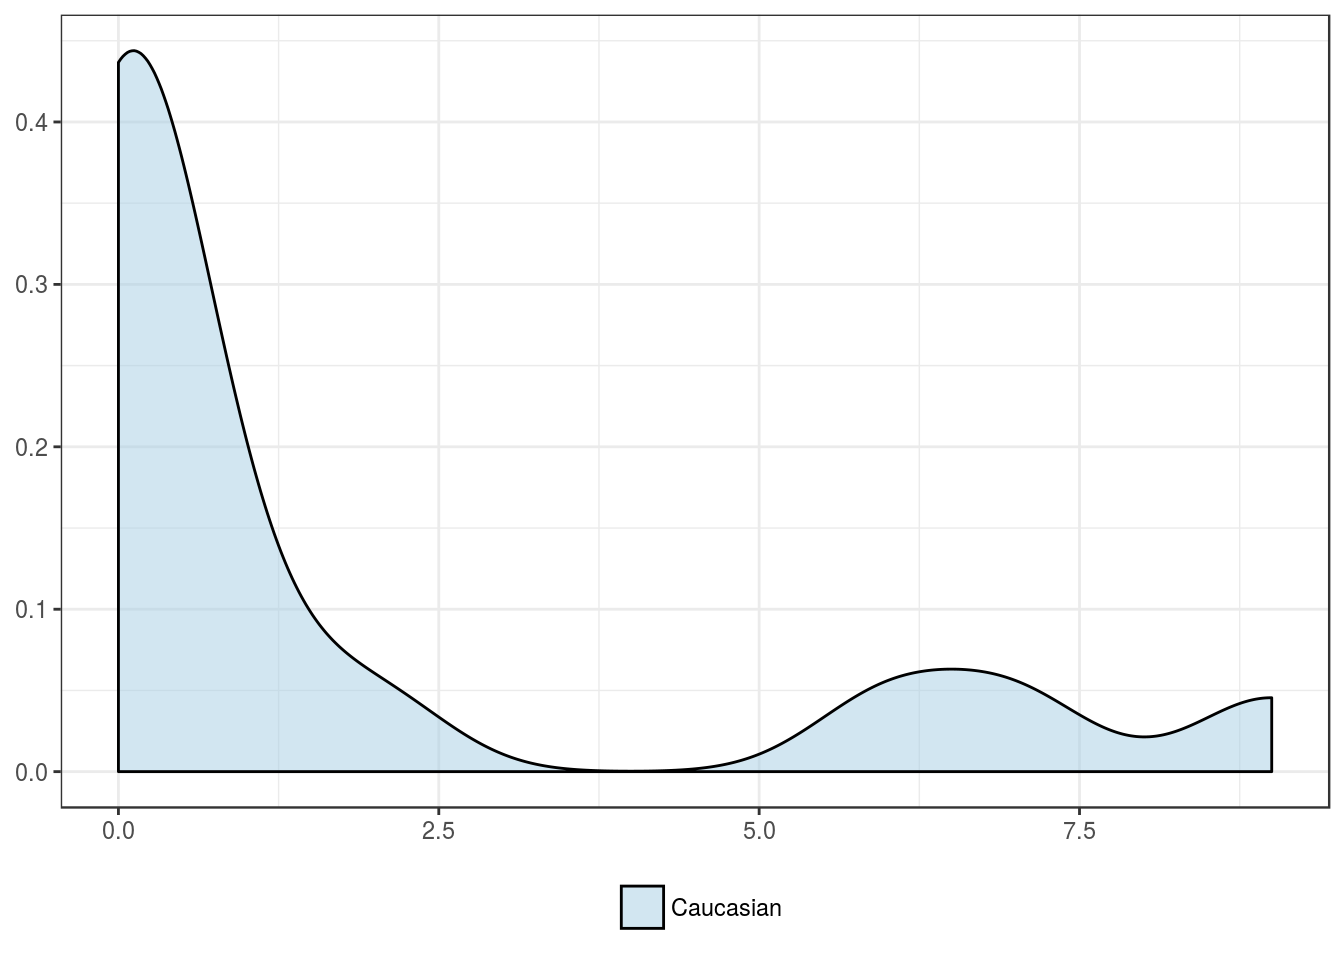
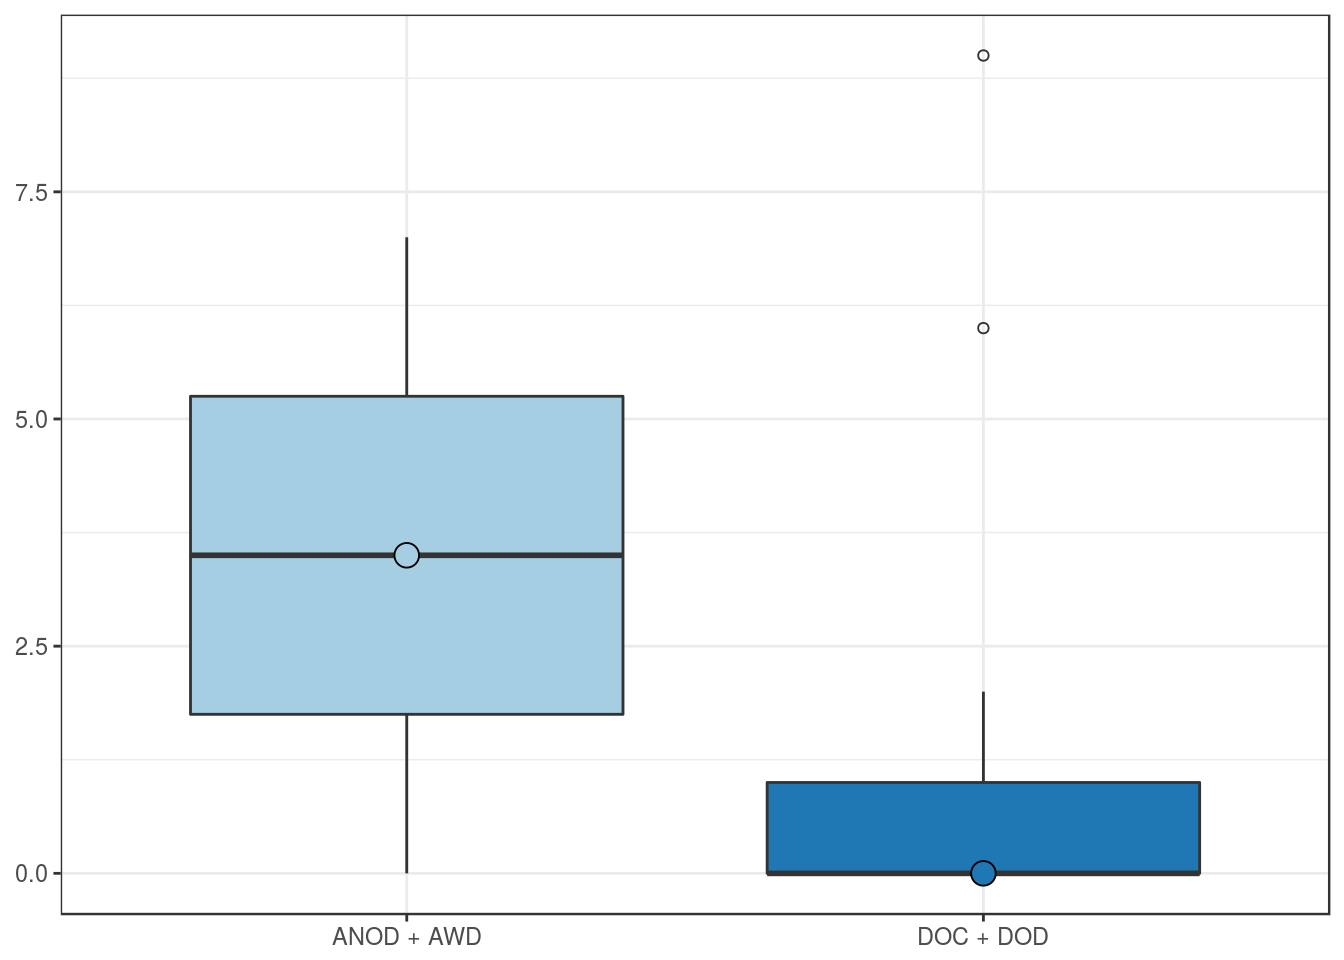
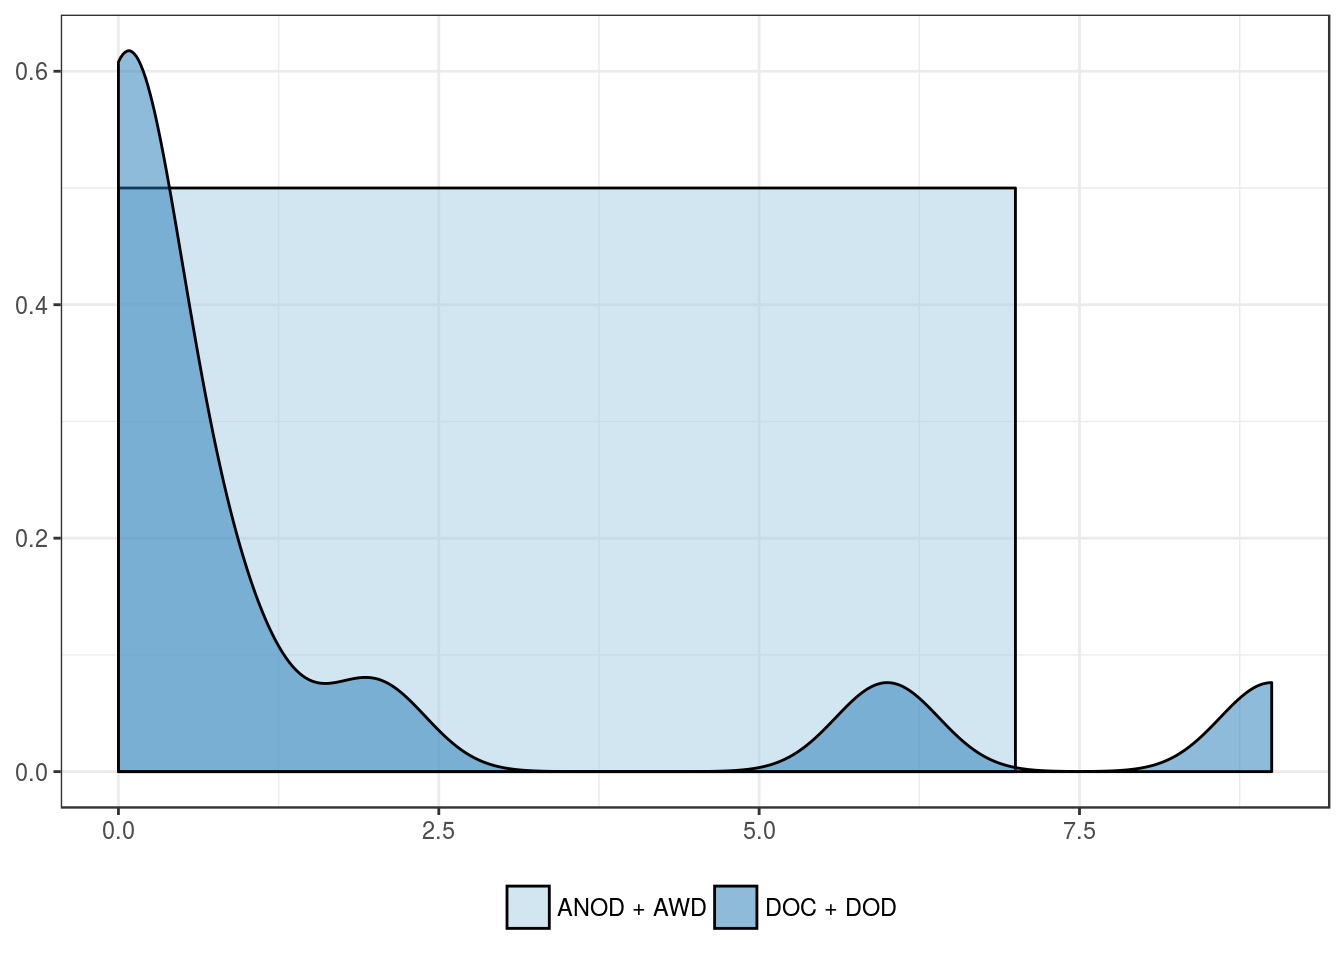
FOXP3 positivity in stromal lymphocytes
Clinical features
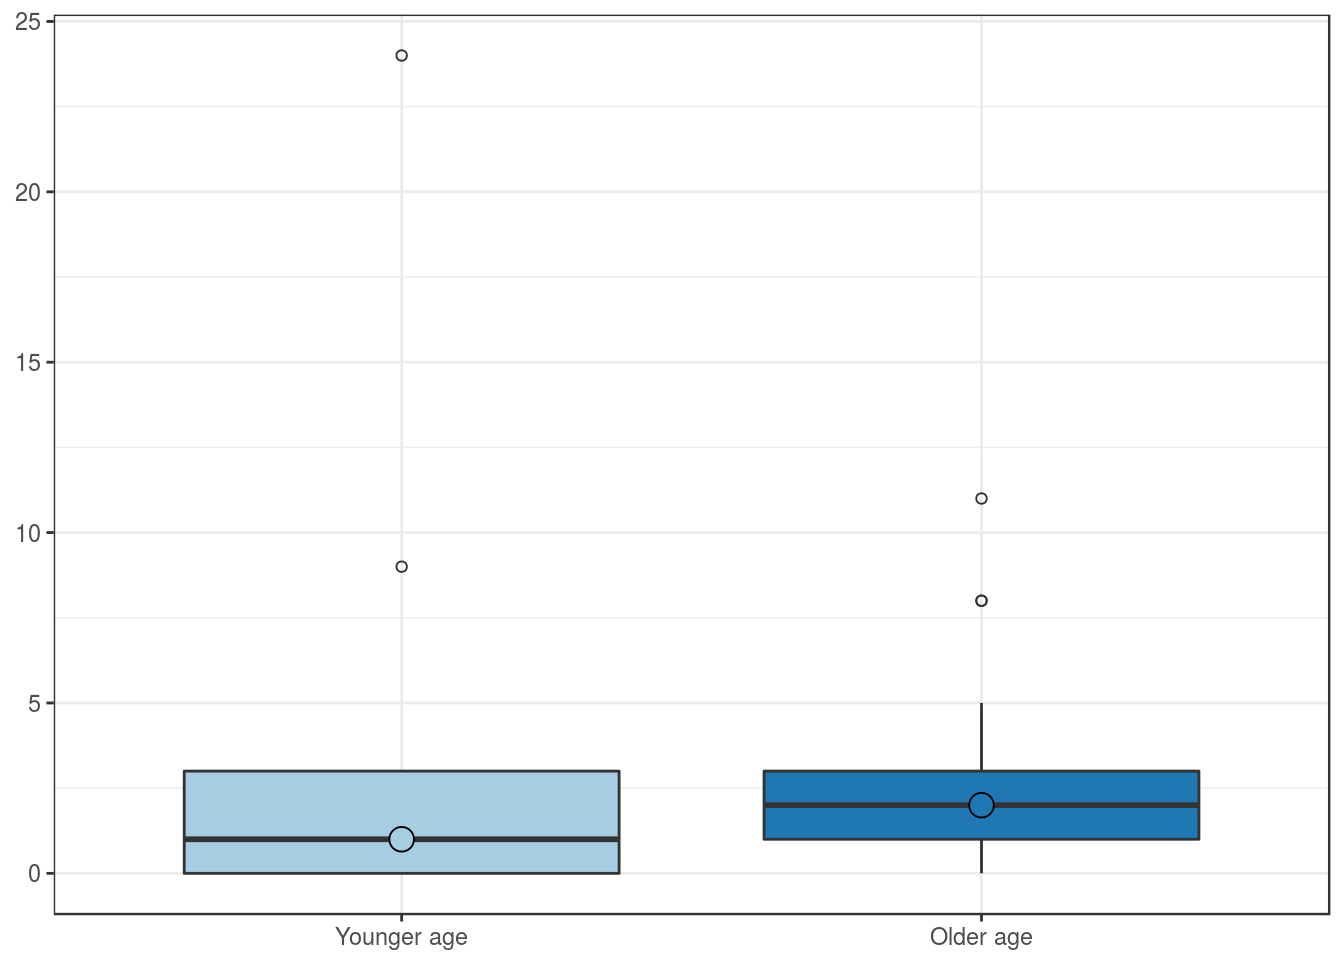
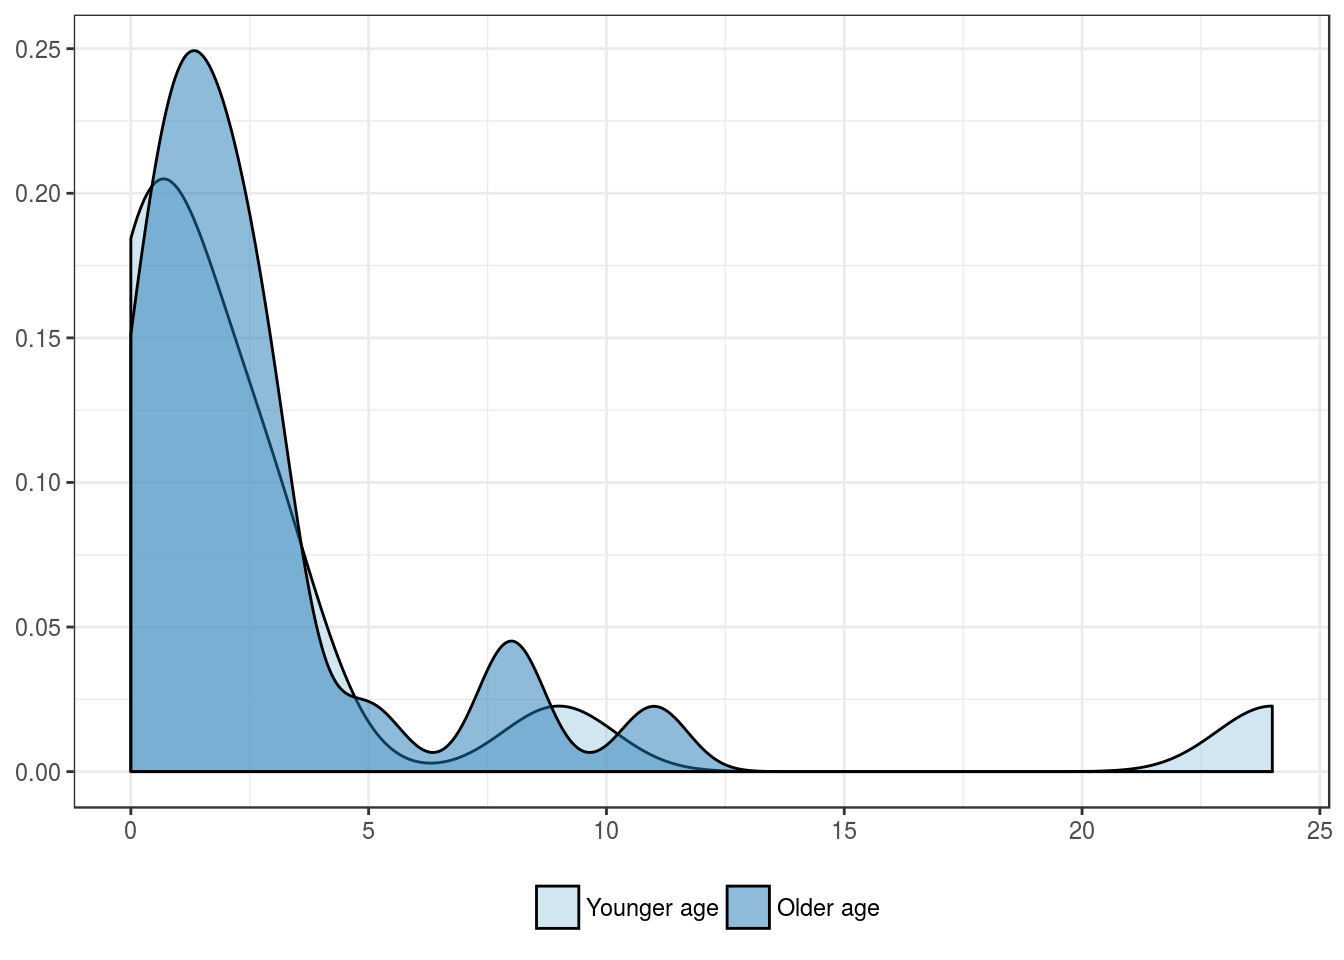
Patients’ age group, in years
| Younger age | Older age | |
|---|---|---|
| Mean | 0.1 | 2.8 |
| Standard deviation | 0.2 | 3.5 |
| Median | 0.0 | 1.0 |
| Interquartile range | 0.0 | 6.0 |
| Minimum | 0.0 | 0.0 |
| Maximum | 0.5 | 9.0 |
| Value | |
|---|---|
| U-statistic | 11 |
| P statistic | 4.7e-02 |
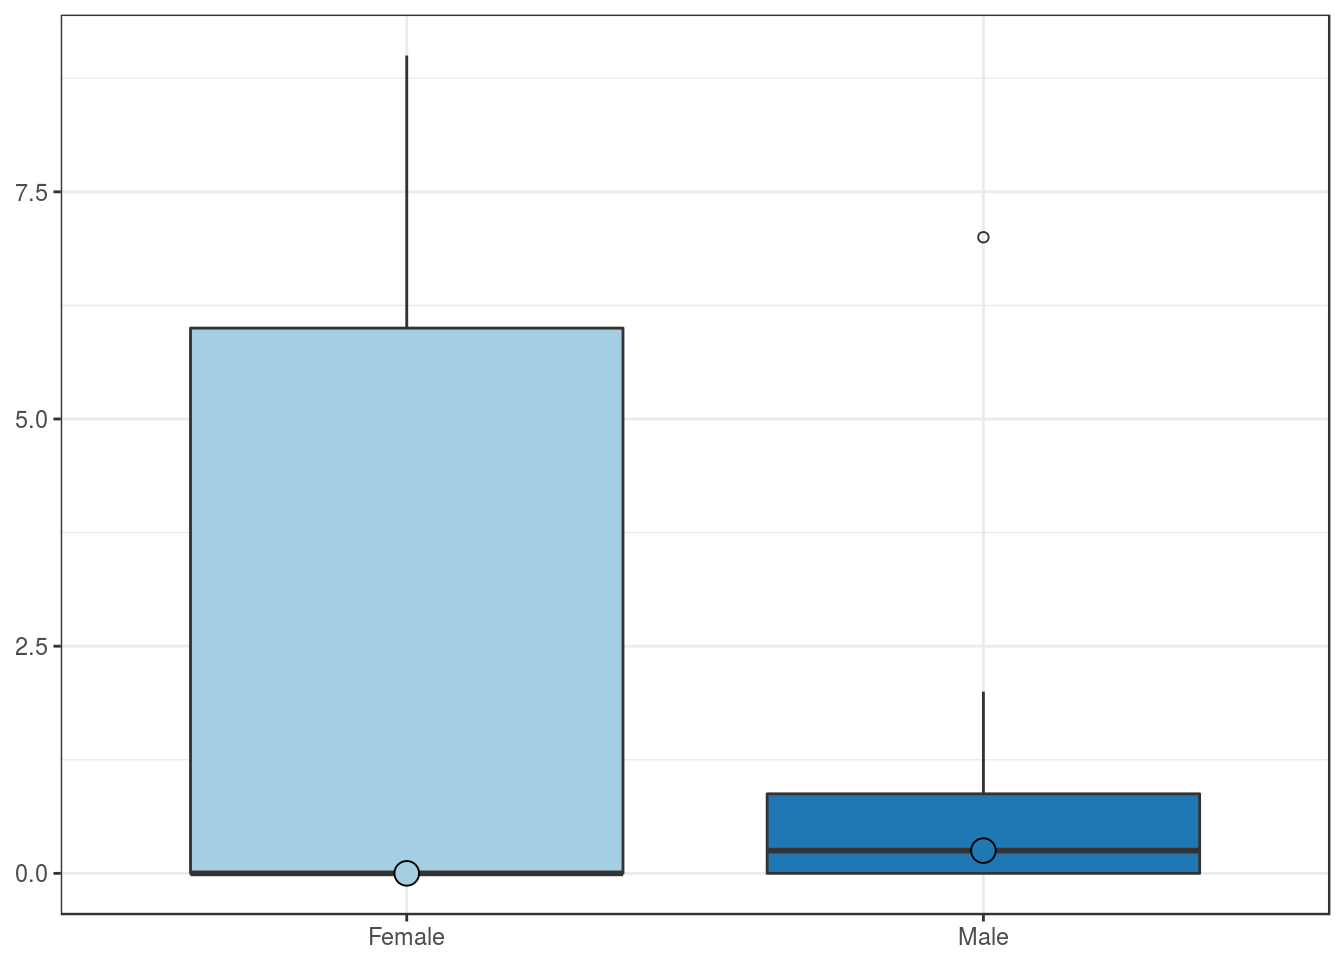
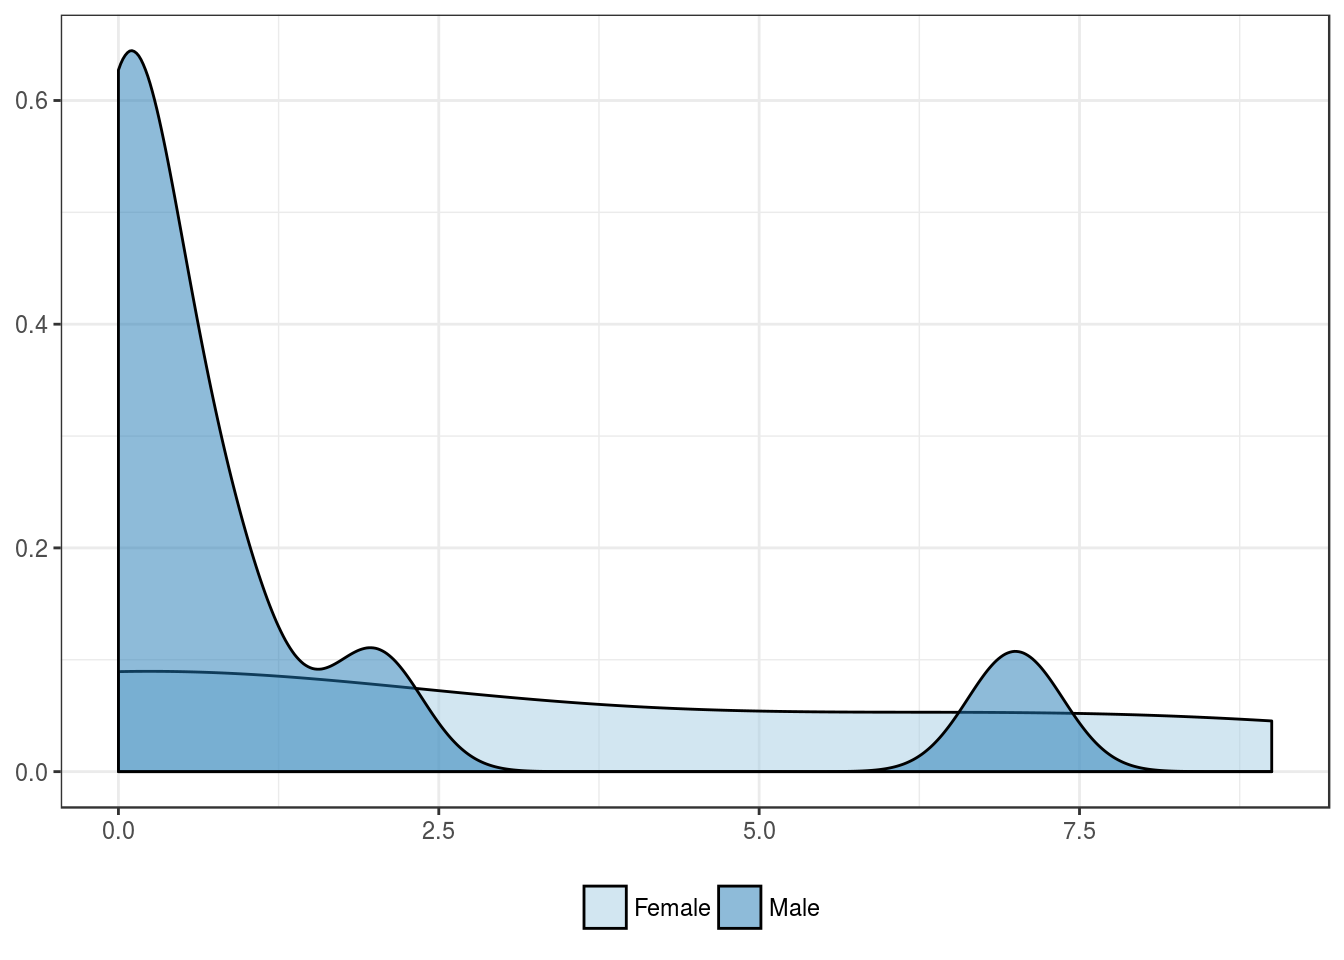
Patients’ sex
| Female | Male | |
|---|---|---|
| Mean | 3.0 | 1.1 |
| Standard deviation | 4.2 | 2.2 |
| Median | 0.0 | 0.2 |
| Interquartile range | 6.0 | 0.9 |
| Minimum | 0.0 | 0.0 |
| Maximum | 9.0 | 7.0 |
| Value | |
|---|---|
| U-statistic | 26.5 |
| P statistic | 8.9e-01 |
Patients’ race
| Caucasian | African-American | Asian | Other | |
|---|---|---|---|---|
| Mean | 1.7 | NaN | NA | NA |
| Standard deviation | 3.0 | NA | NA | NA |
| Median | 0.0 | NA | NA | NA |
| Interquartile range | 1.5 | NA | NA | NA |
| Minimum | 0.0 | Inf | NA | NA |
| Maximum | 9.0 | -Inf | NA | NA |
Outcome features
Overall mortality
| ANOD + AWD | DOC + DOD | |
|---|---|---|
| Mean | 3.5 | 1.5 |
| Standard deviation | 4.9 | 2.8 |
| Median | 3.5 | 0.0 |
| Interquartile range | 3.5 | 1.0 |
| Minimum | 0.0 | 0.0 |
| Maximum | 7.0 | 9.0 |
| Value | |
|---|---|
| U-statistic | 15.5 |
| P statistic | 7.1e-01 |
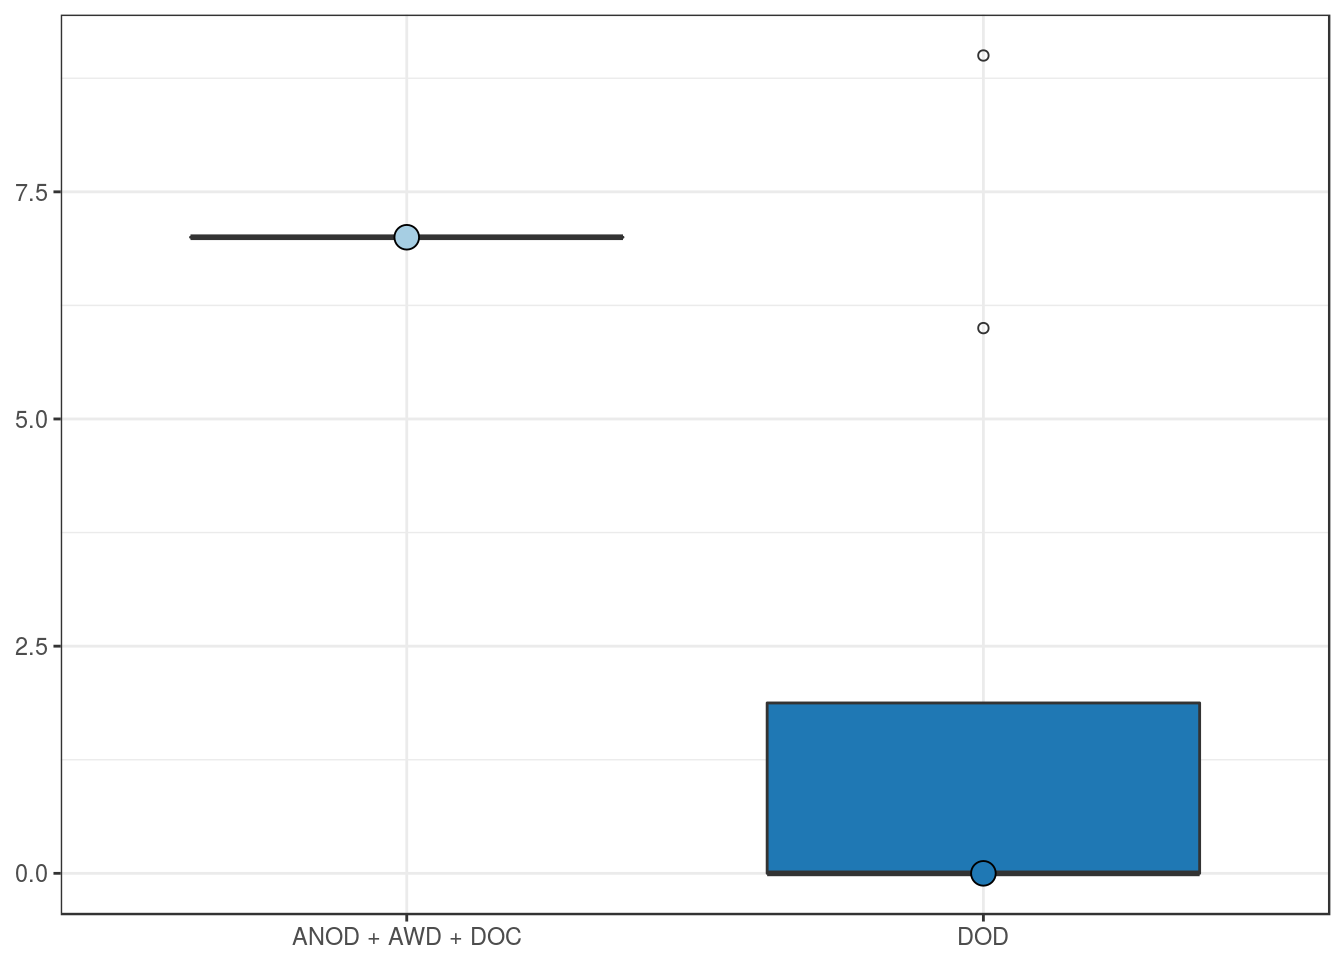
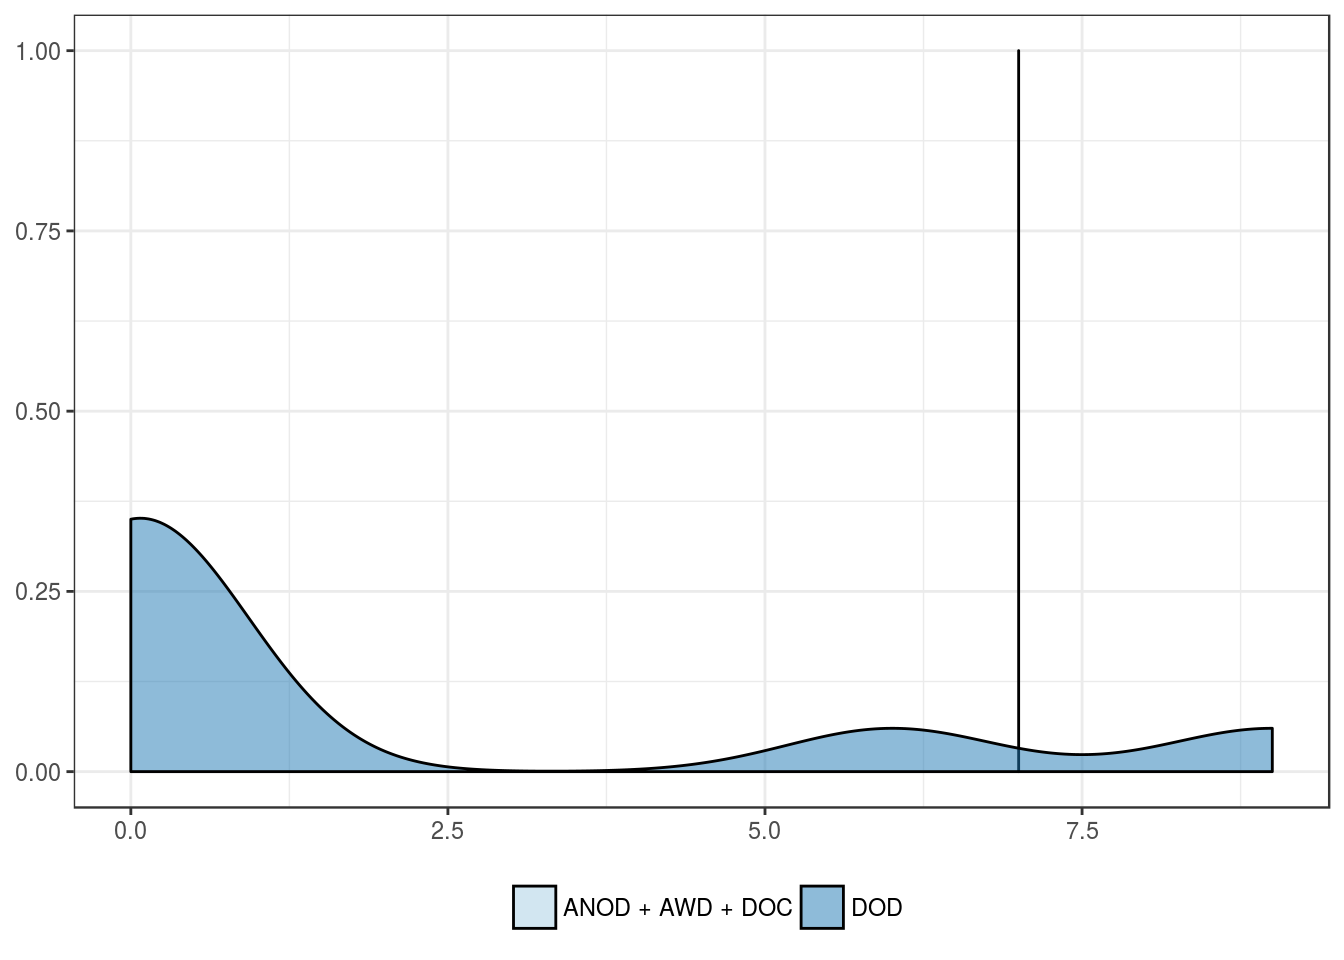
Cancer-related mortality
| ANOD + AWD + DOC | DOD | |
|---|---|---|
| Mean | 7 | 1.9 |
| Standard deviation | NA | 3.5 |
| Median | 7 | 0.0 |
| Interquartile range | 0 | 1.9 |
| Minimum | 7 | 0.0 |
| Maximum | 7 | 9.0 |
| Value | |
|---|---|
| U-statistic | 7 |
| P statistic | 2.9e-01 |