PD-L1 expression in metastatic tumors
PD-L1 positivity in tumor cells
Clinical features
Patients’ age group, in years
| Younger age | Older age | |
|---|---|---|
| Mean | 6.7 | 0 |
| Standard deviation | 18.0 | 0 |
| Median | 0.0 | 0 |
| Interquartile range | 0.0 | 0 |
| Minimum | 0.0 | 0 |
| Maximum | 60.0 | 0 |
| Value | |
|---|---|
| U-statistic | 234 |
| P statistic | 2.1e-02 |
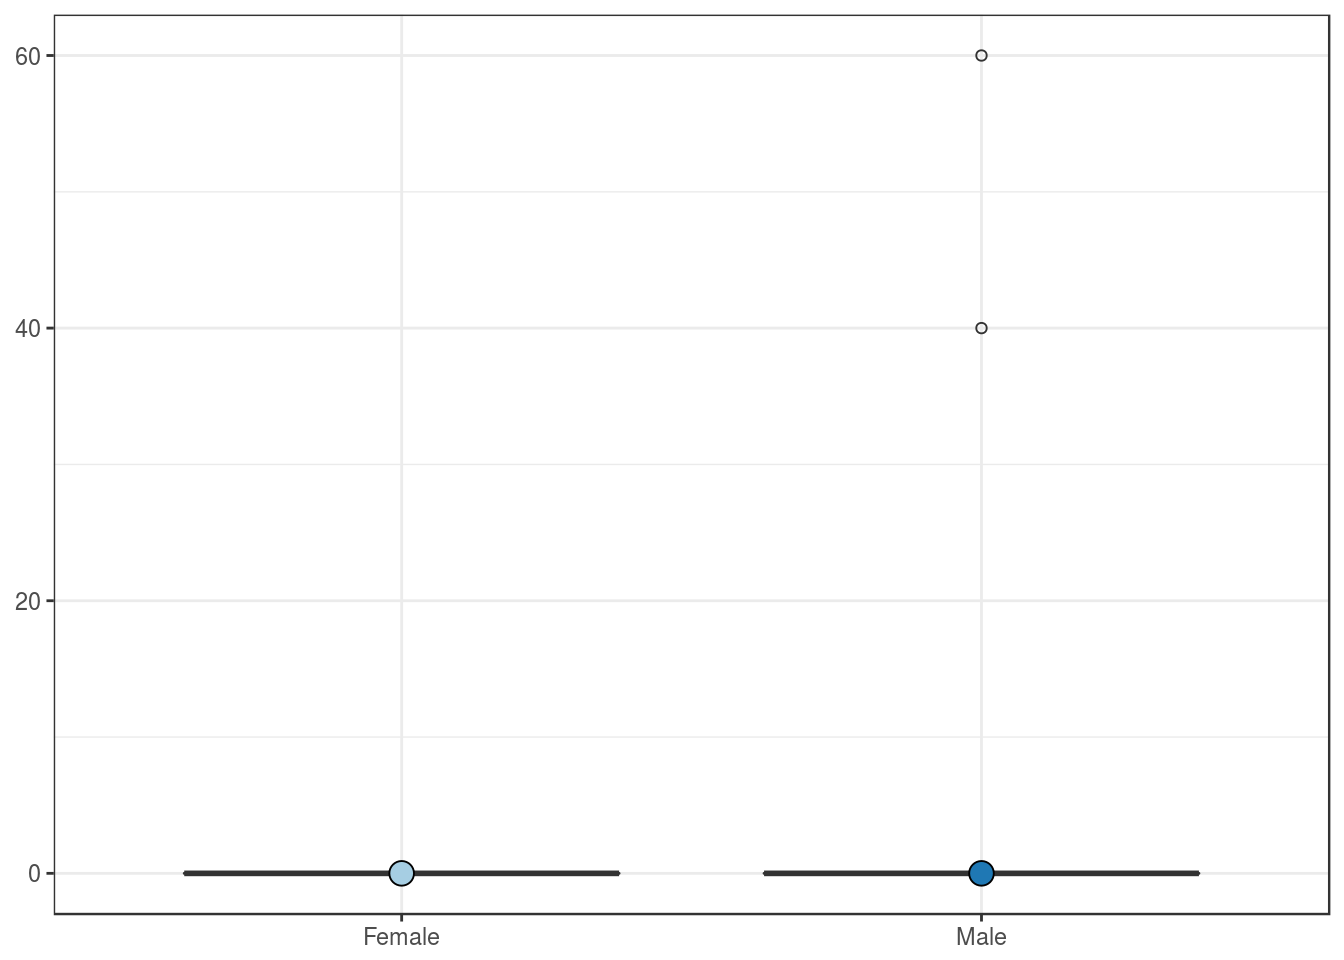
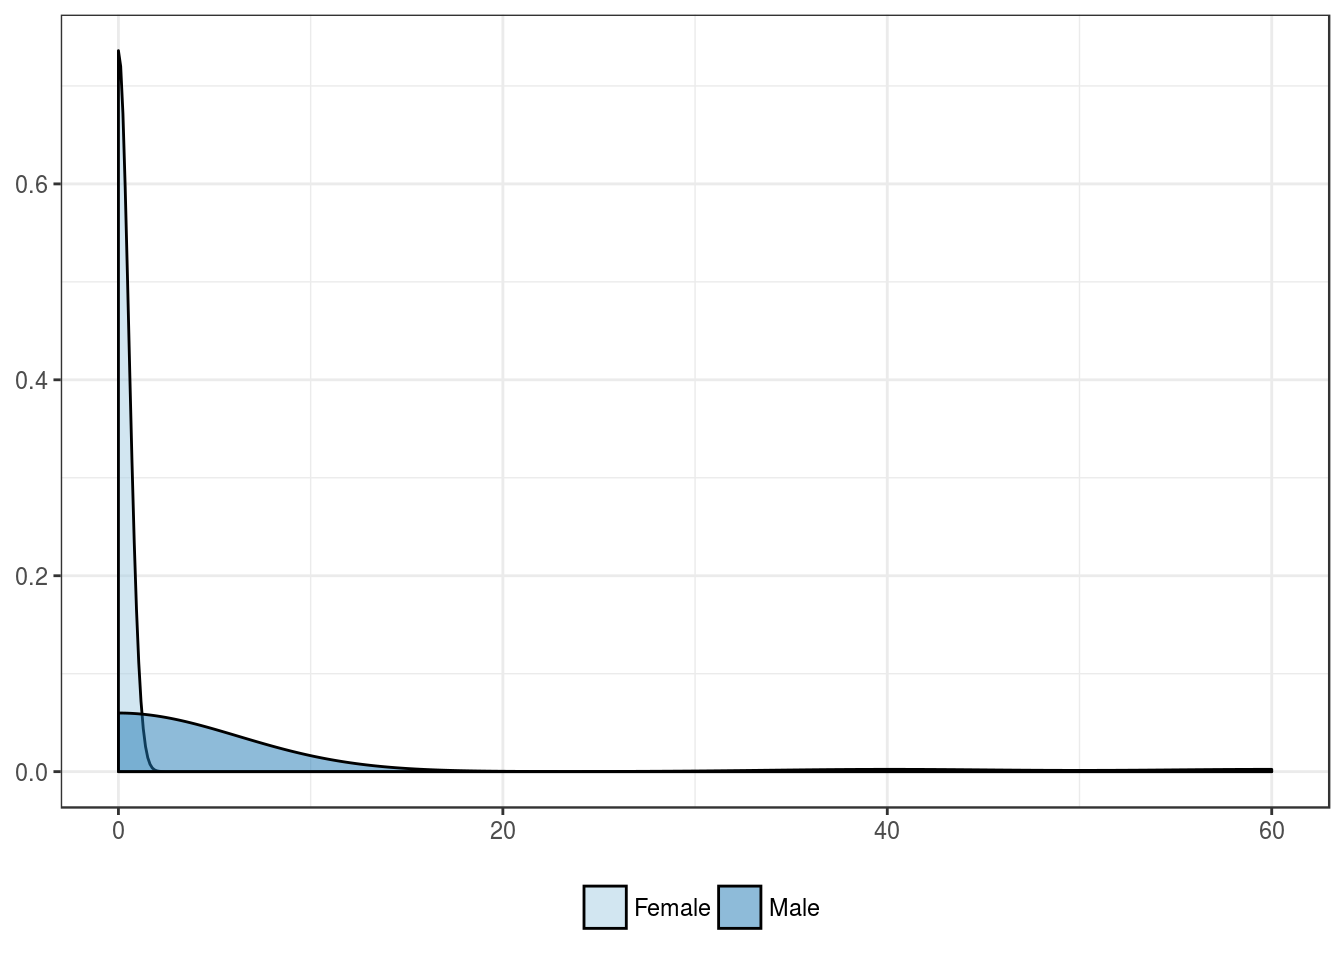
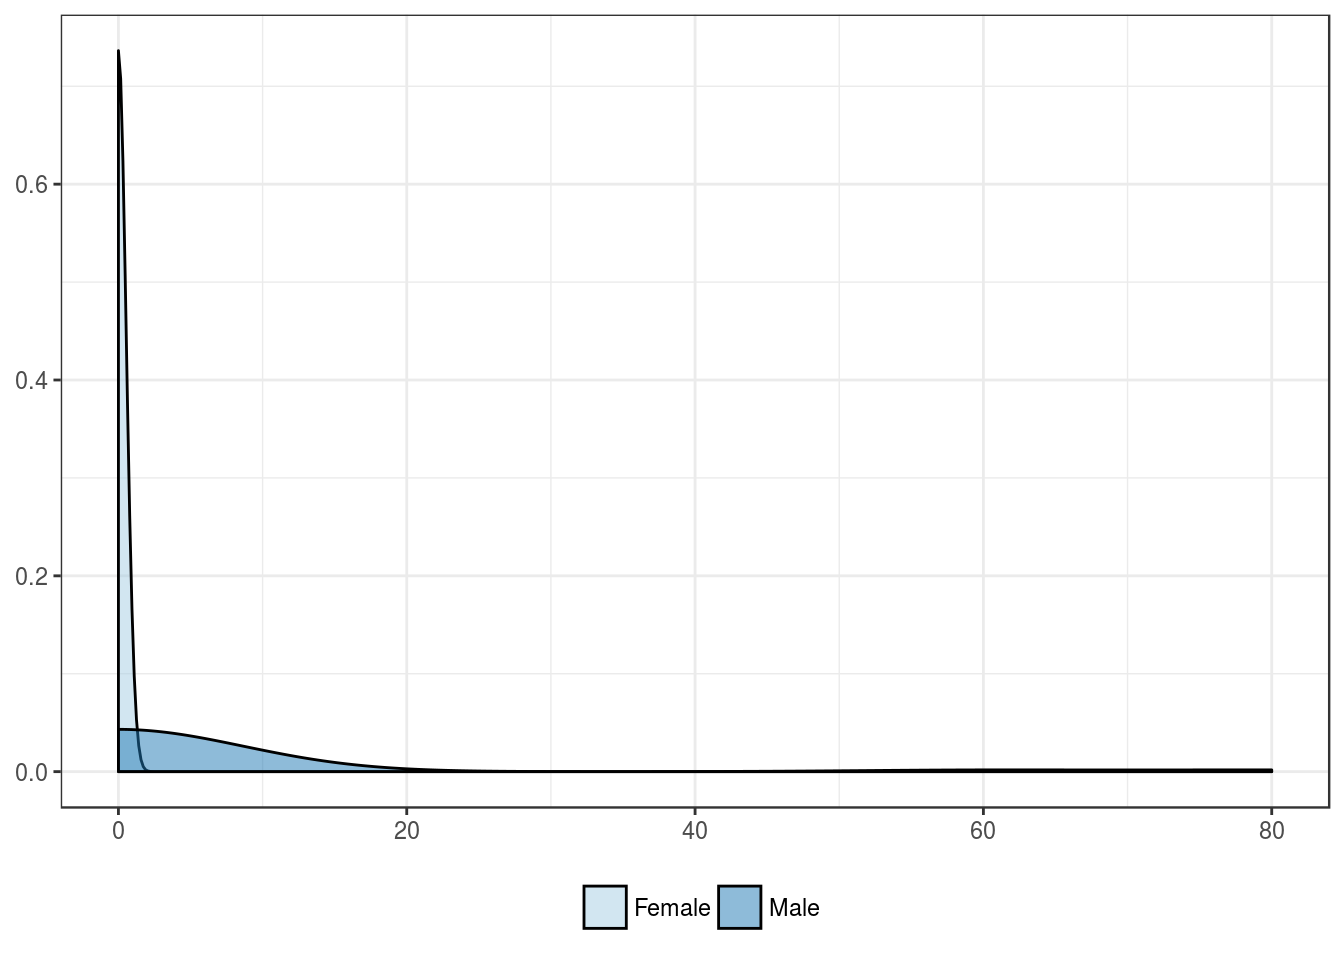
Patients’ sex
| Female | Male | |
|---|---|---|
| Mean | 0 | 3.6 |
| Standard deviation | 0 | 13.4 |
| Median | 0 | 0.0 |
| Interquartile range | 0 | 0.0 |
| Minimum | 0 | 0.0 |
| Maximum | 0 | 60.0 |
| Value | |
|---|---|
| U-statistic | 162 |
| P statistic | 2.4e-01 |
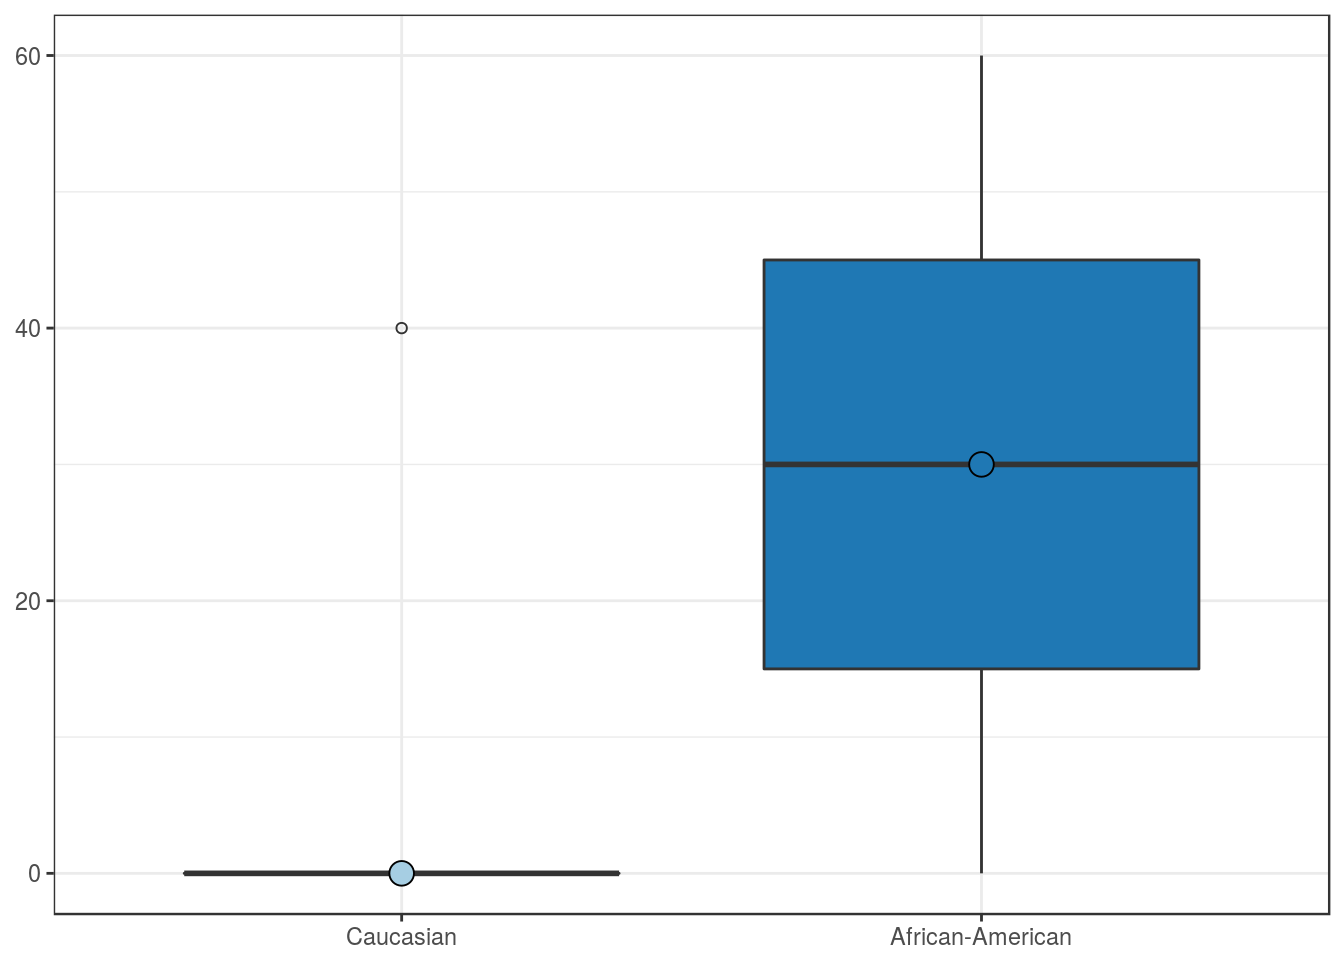
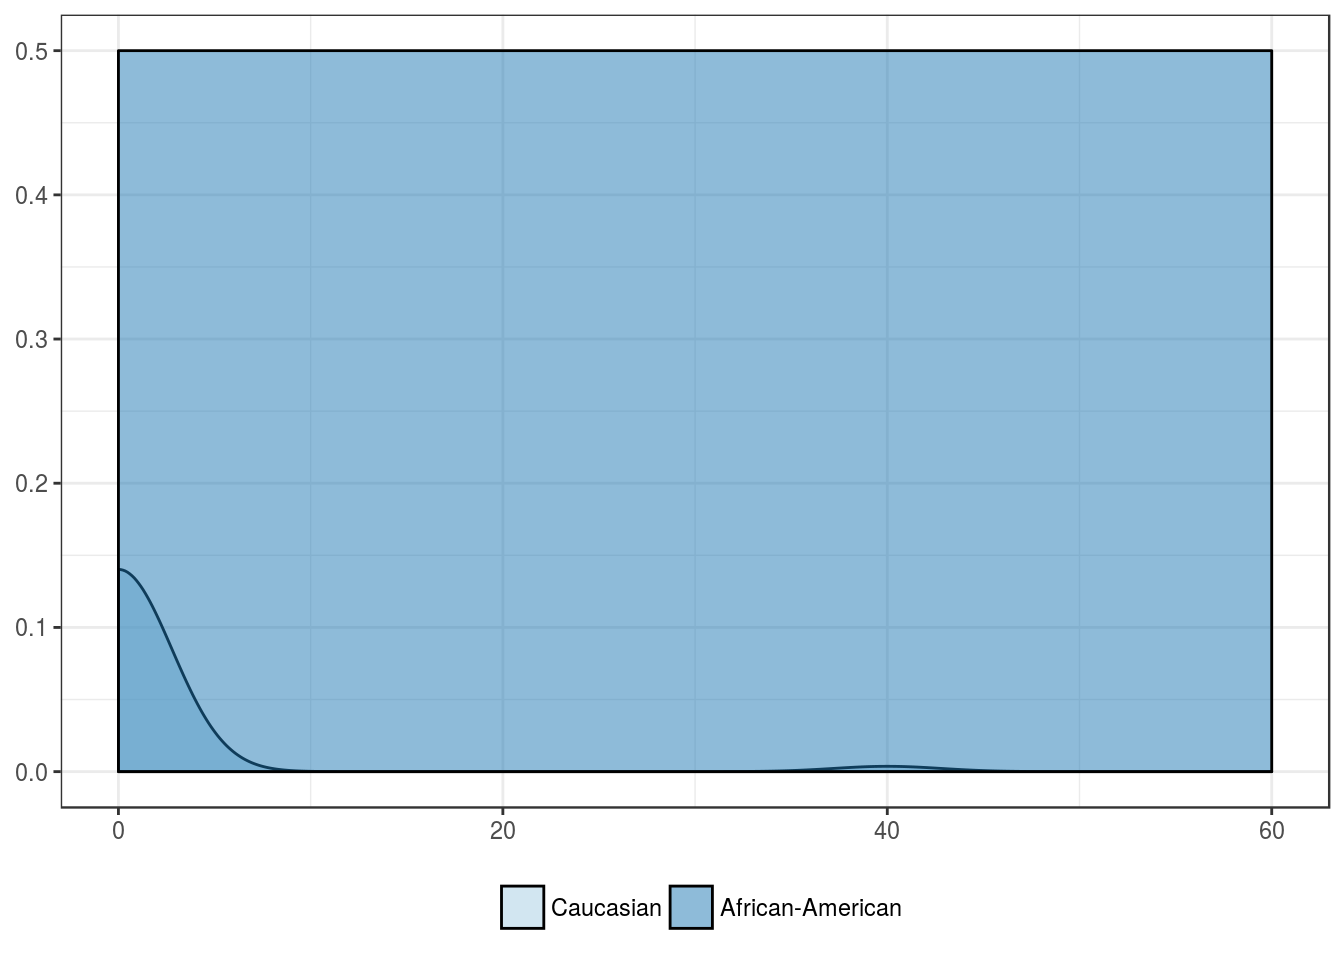
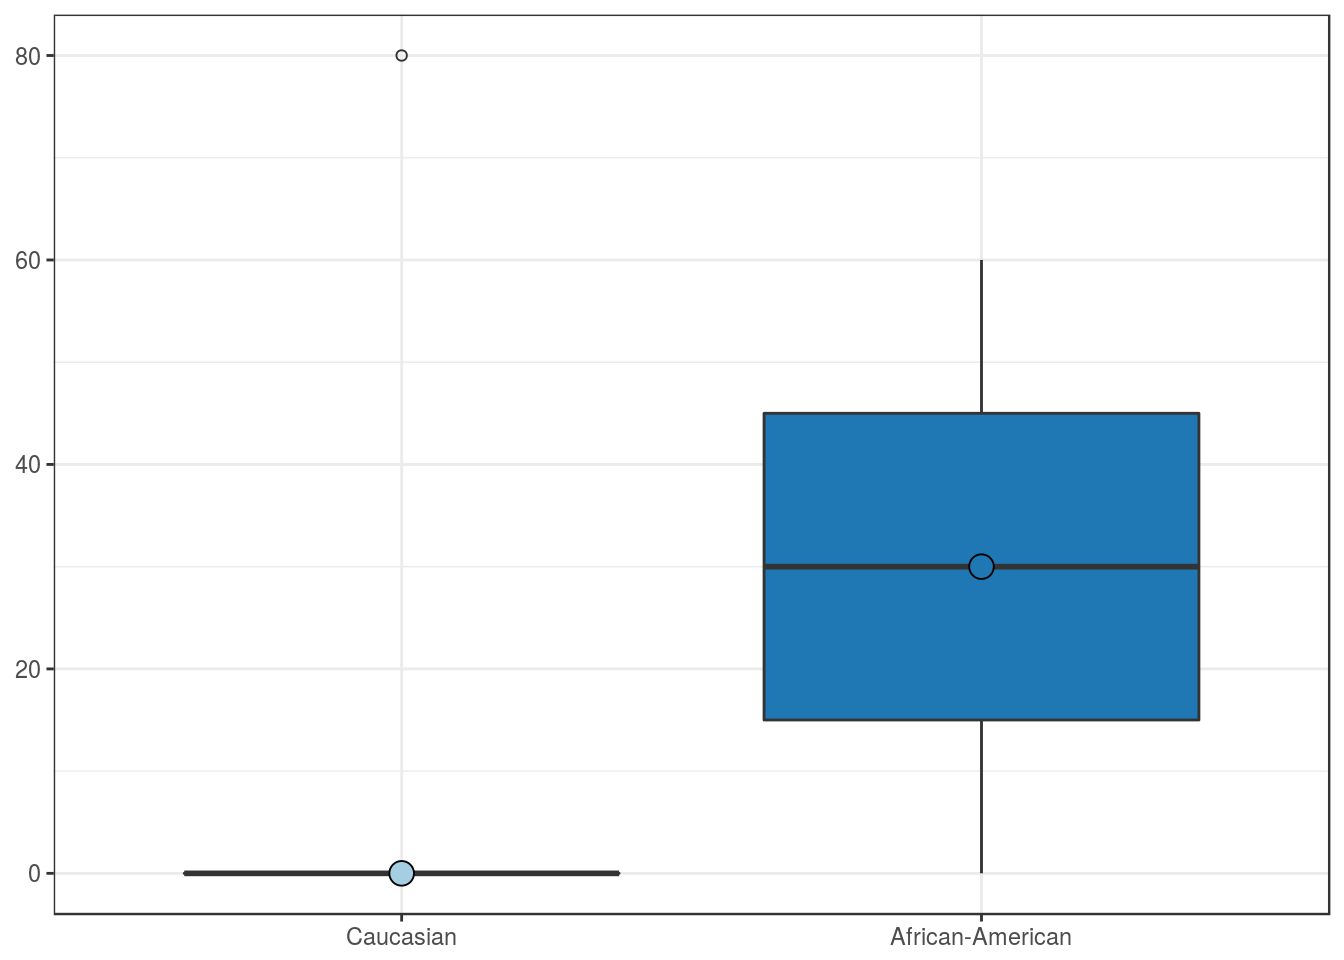
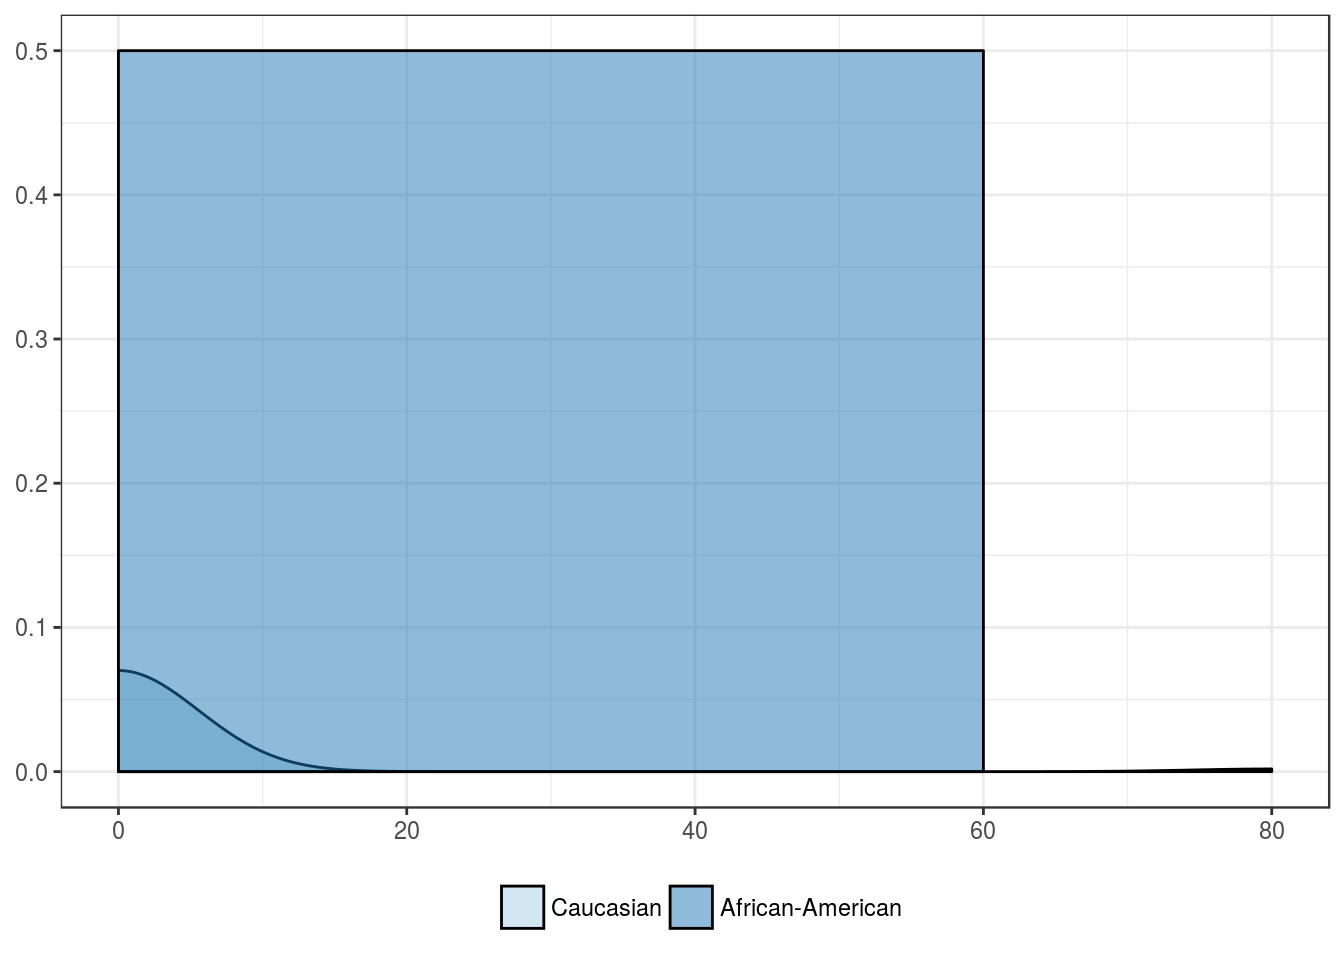
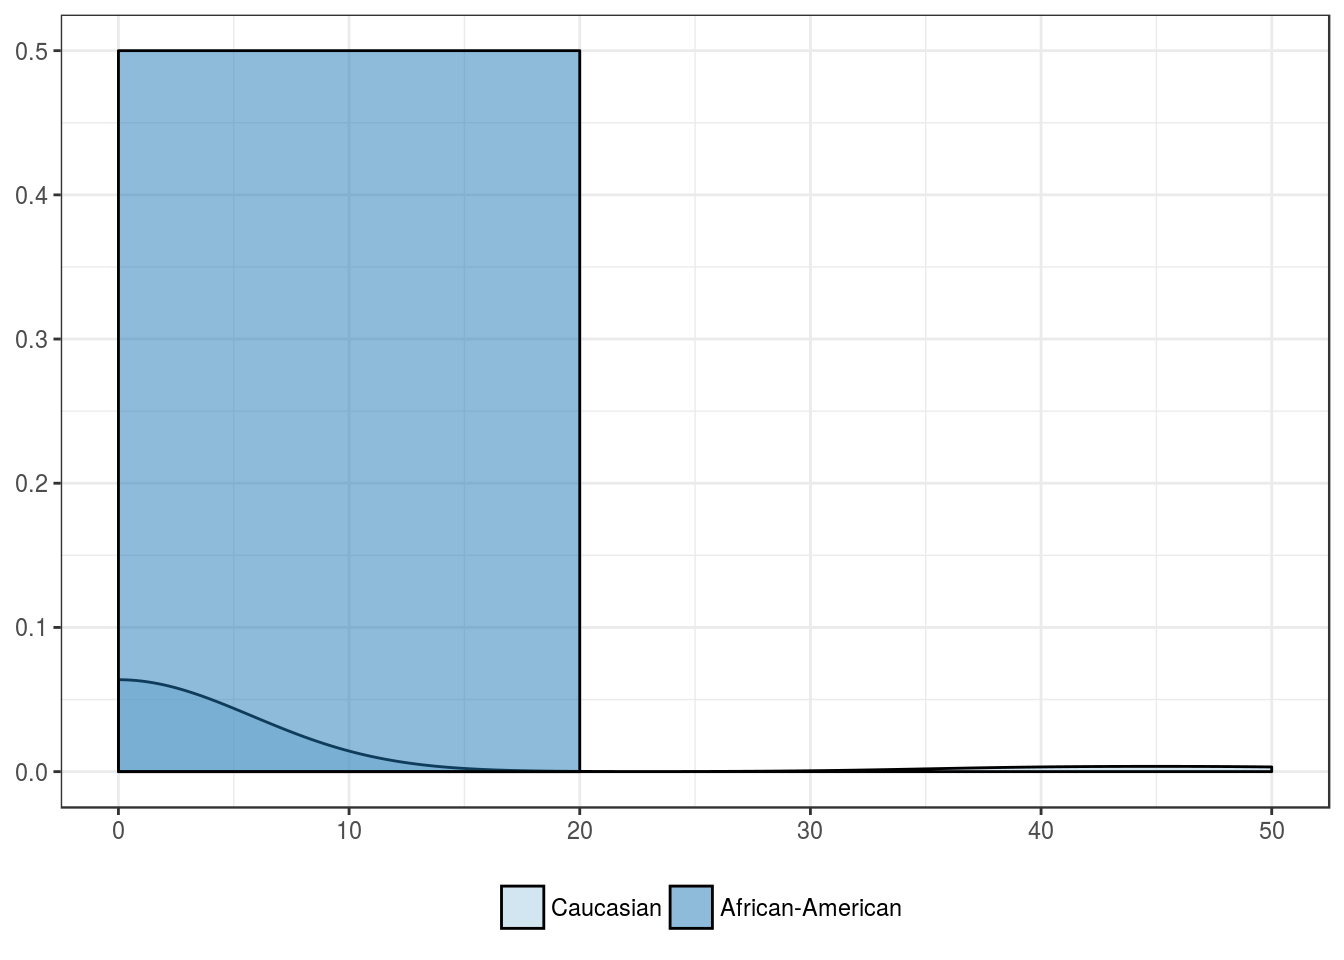
Patients’ race
| Caucasian | African-American | Asian | Other | |
|---|---|---|---|---|
| Mean | 1.0 | 30.0 | NA | NA |
| Standard deviation | 6.4 | 42.4 | NA | NA |
| Median | 0.0 | 30.0 | NA | NA |
| Interquartile range | 0.0 | 30.0 | NA | NA |
| Minimum | 0.0 | 0.0 | NA | NA |
| Maximum | 40.0 | 60.0 | NA | NA |
| Value | |
|---|---|
| Statistic | 6.148 |
| Parameter | 1 |
| P statistic | 0.013 |
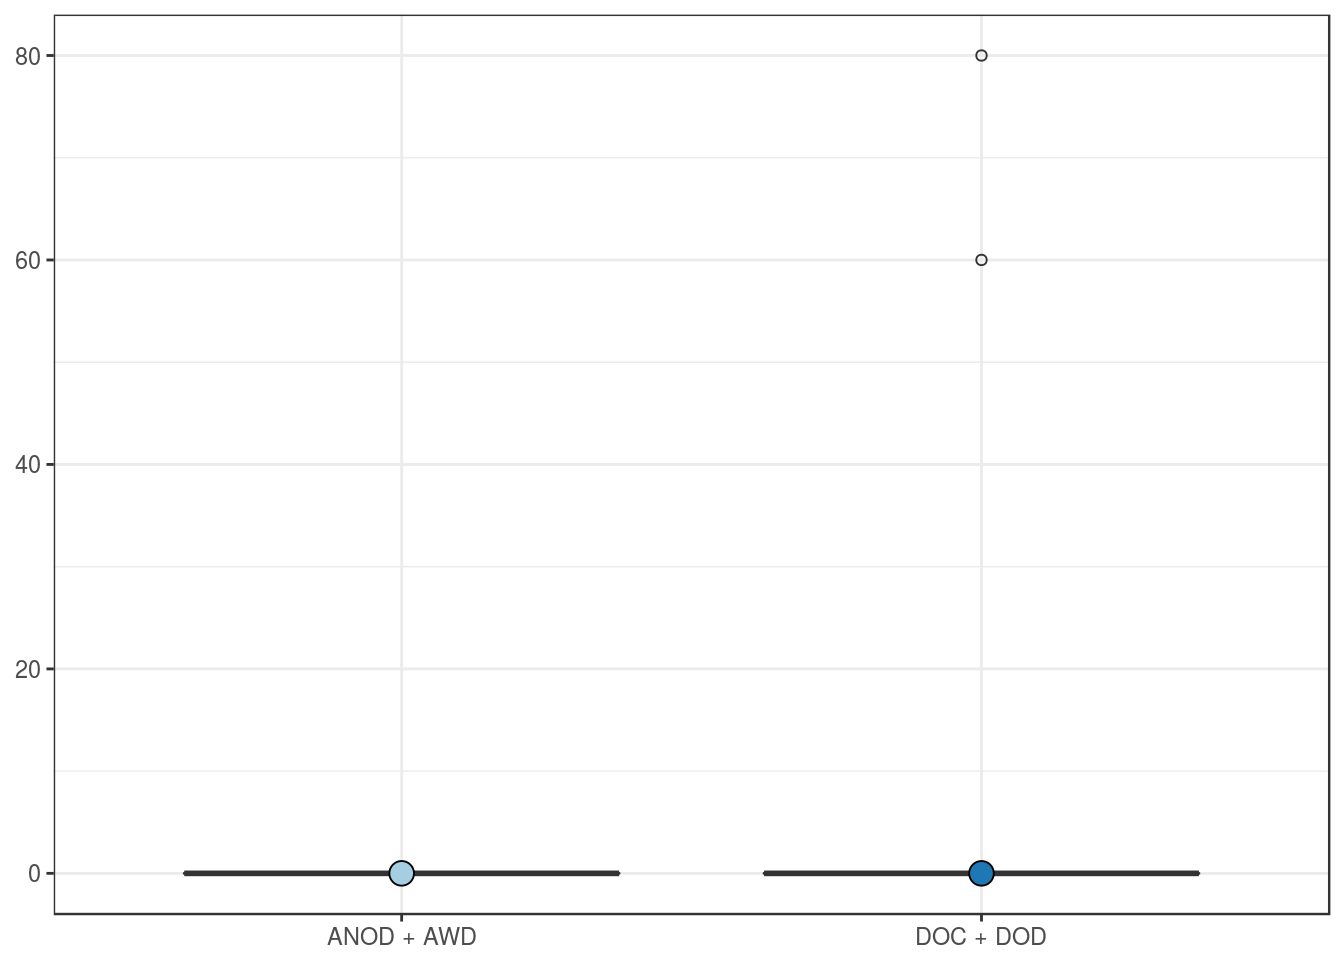
Outcome features
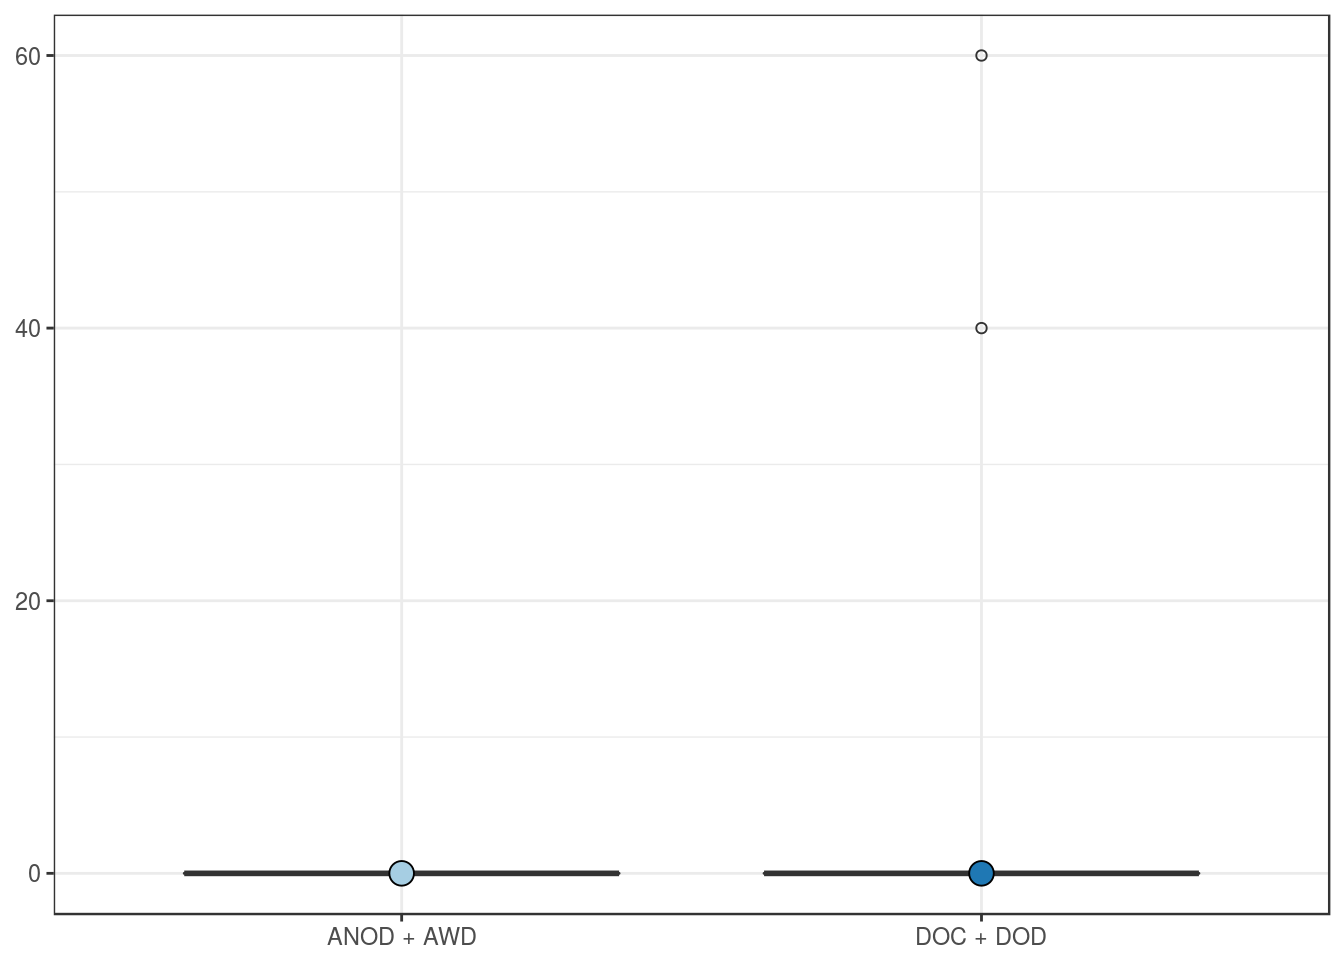
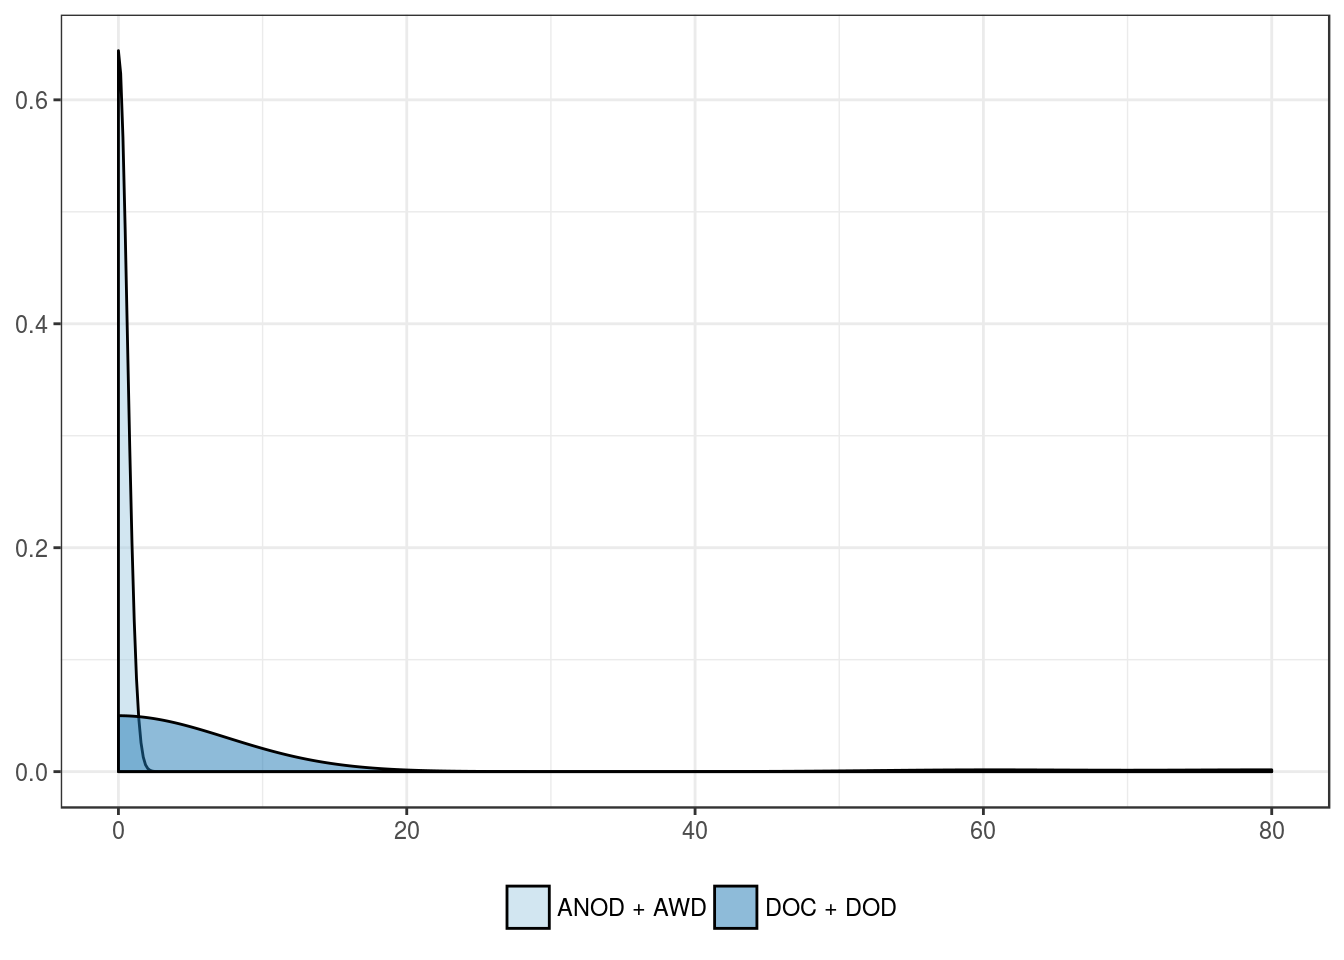
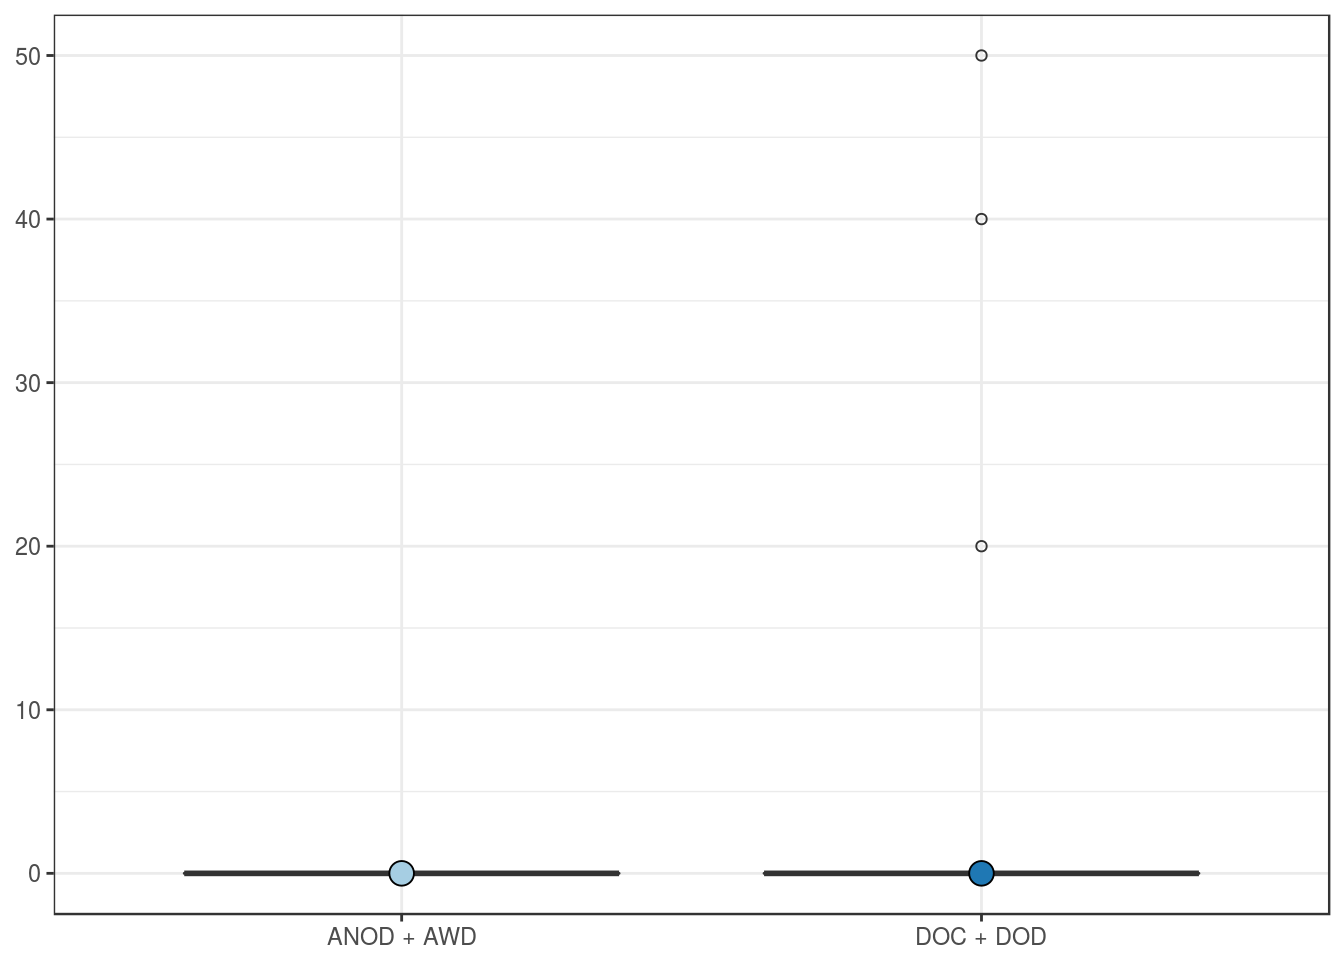
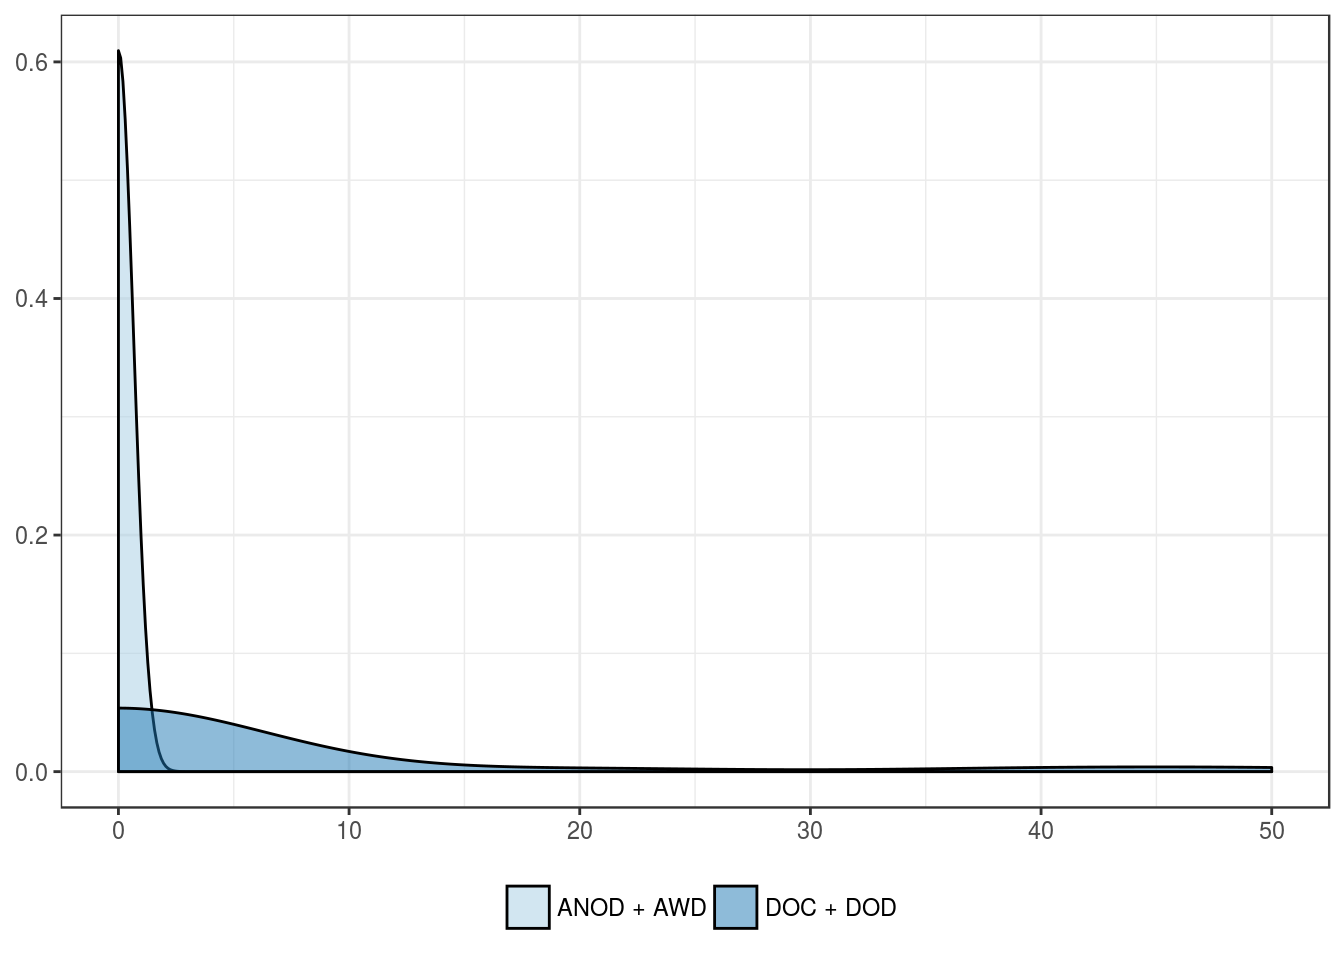
Overall mortality
| ANOD + AWD | DOC + DOD | |
|---|---|---|
| Mean | 0 | 2.9 |
| Standard deviation | 0 | 12.2 |
| Median | 0 | 0.0 |
| Interquartile range | 0 | 0.0 |
| Minimum | 0 | 0.0 |
| Maximum | 0 | 60.0 |
| Value | |
|---|---|
| U-statistic | 108 |
| P statistic | 4.4e-01 |

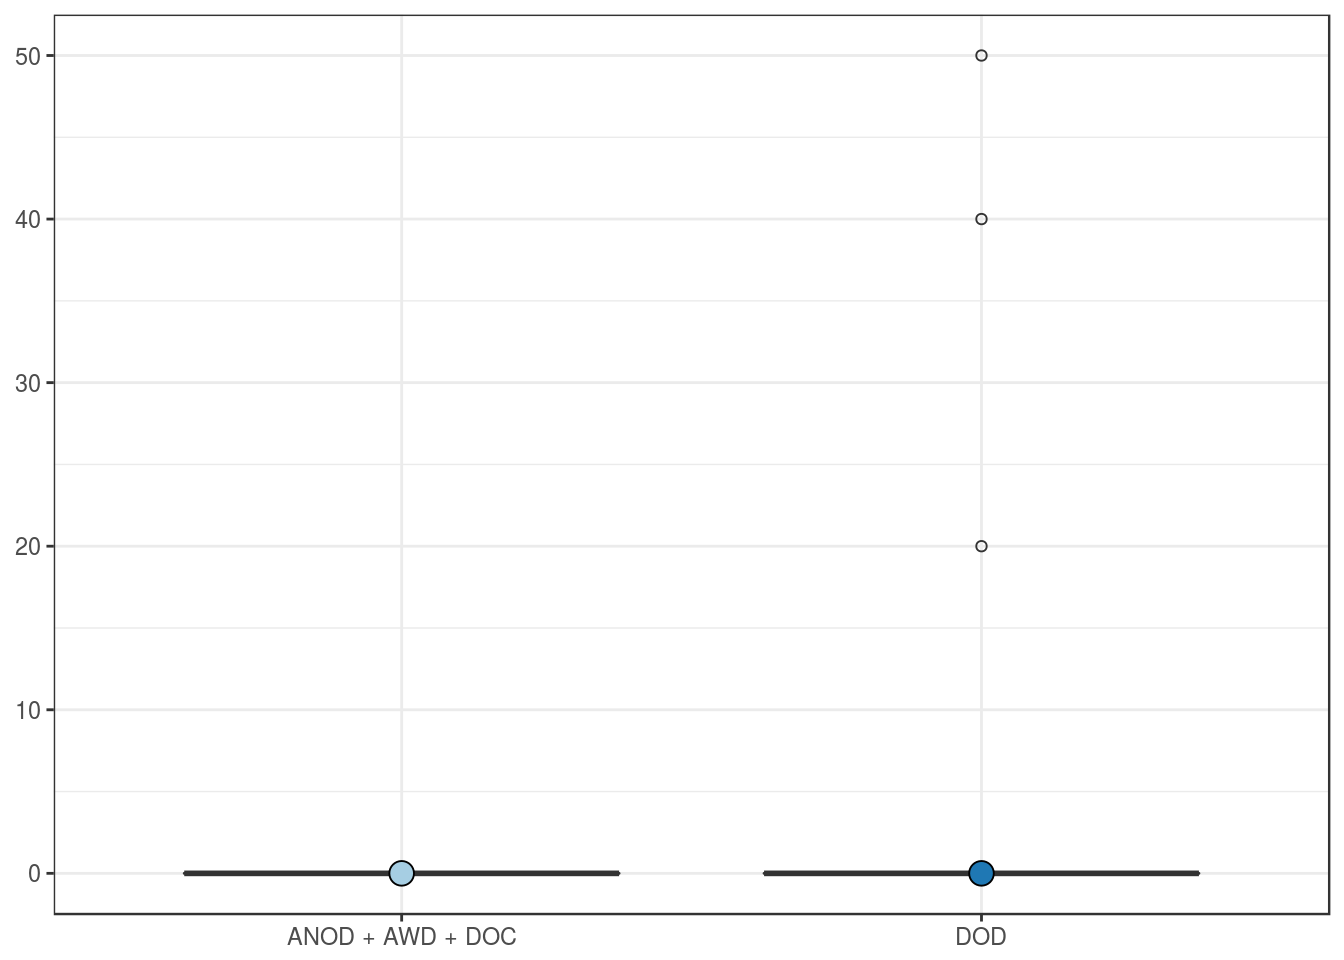
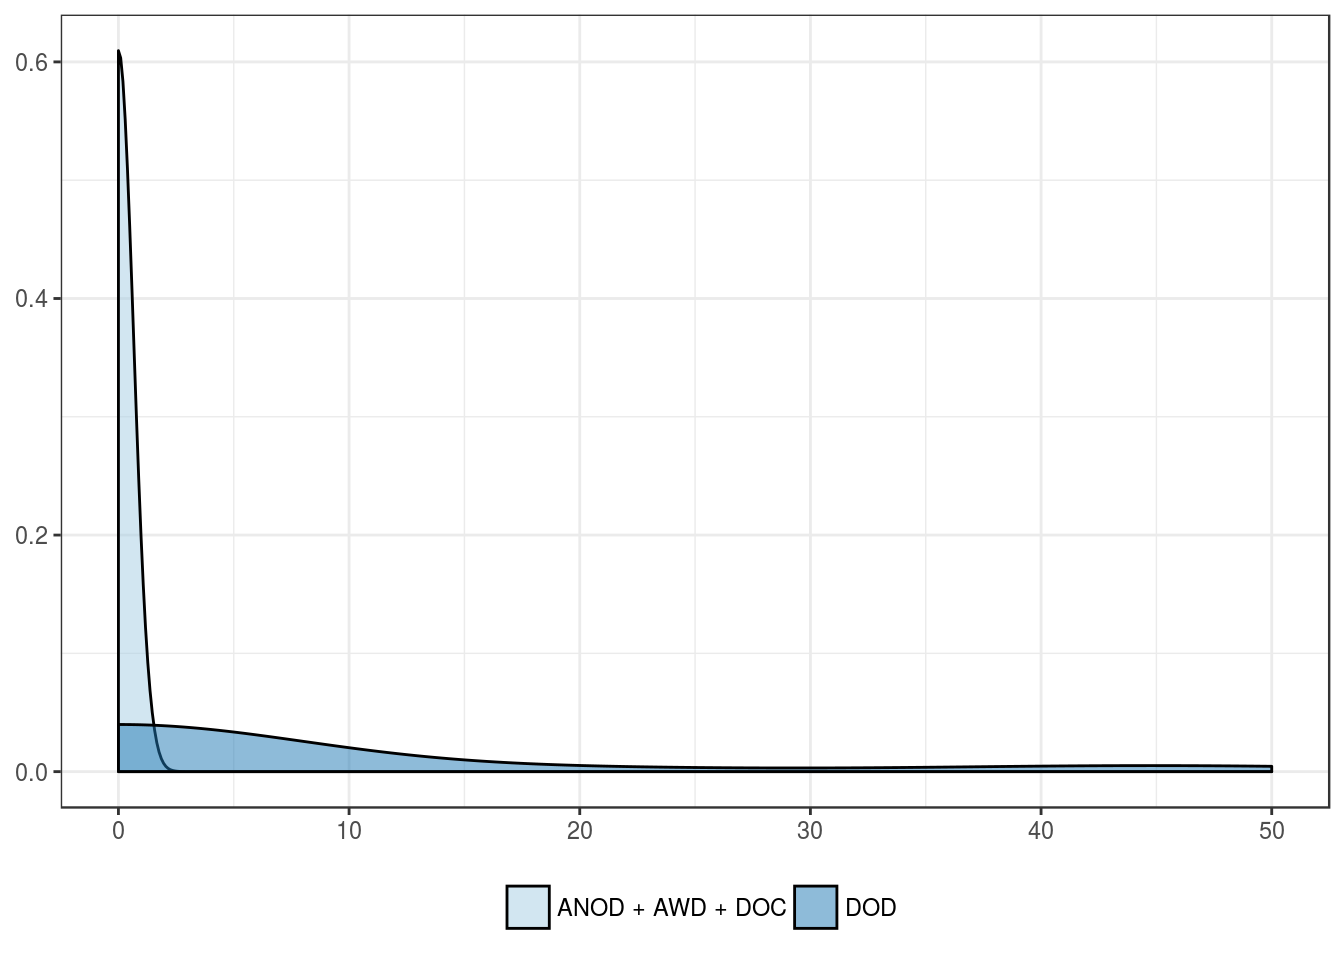
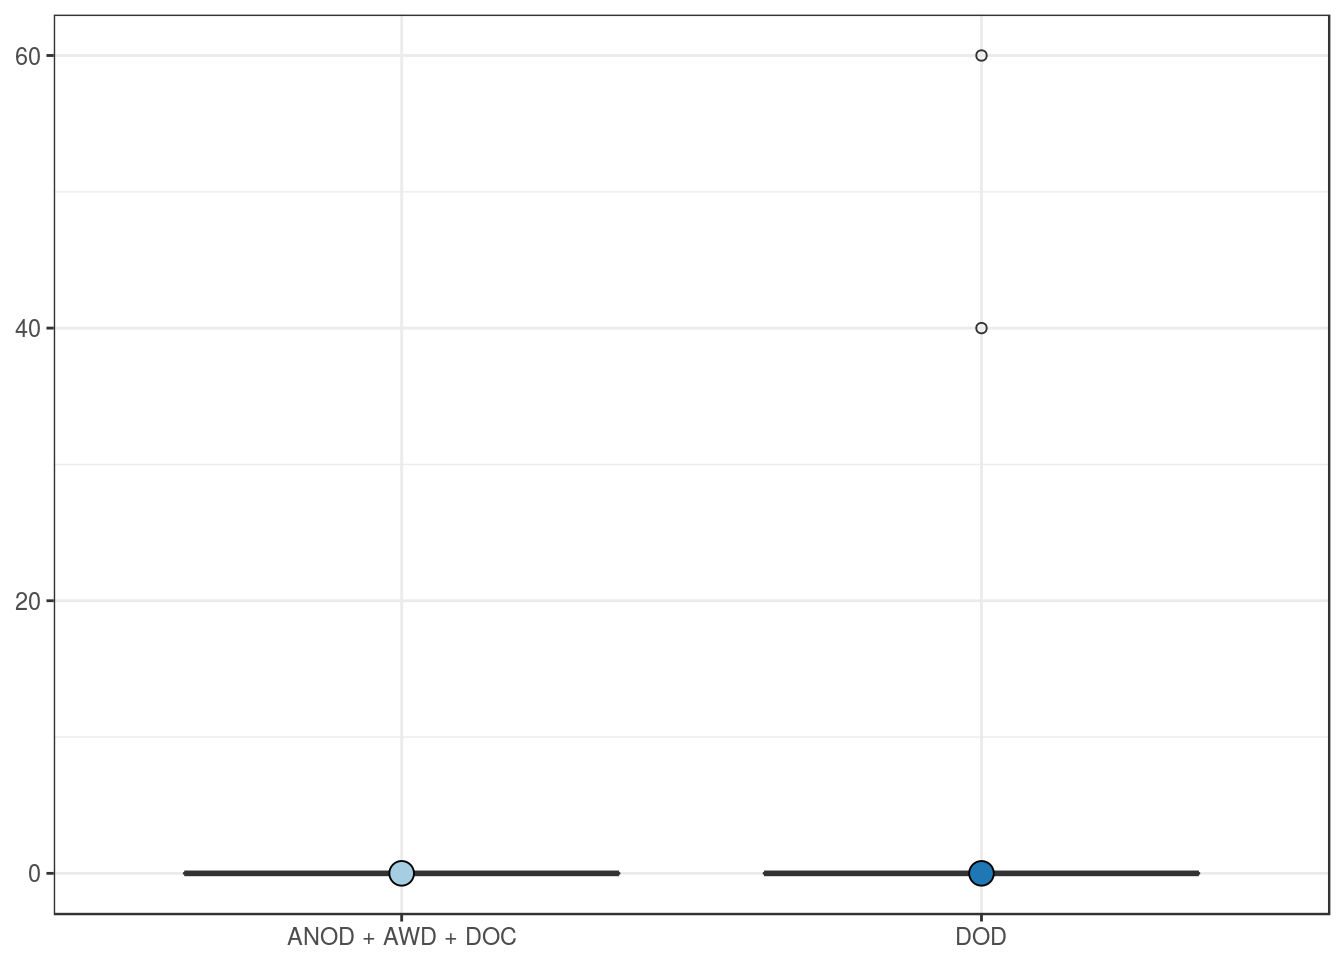
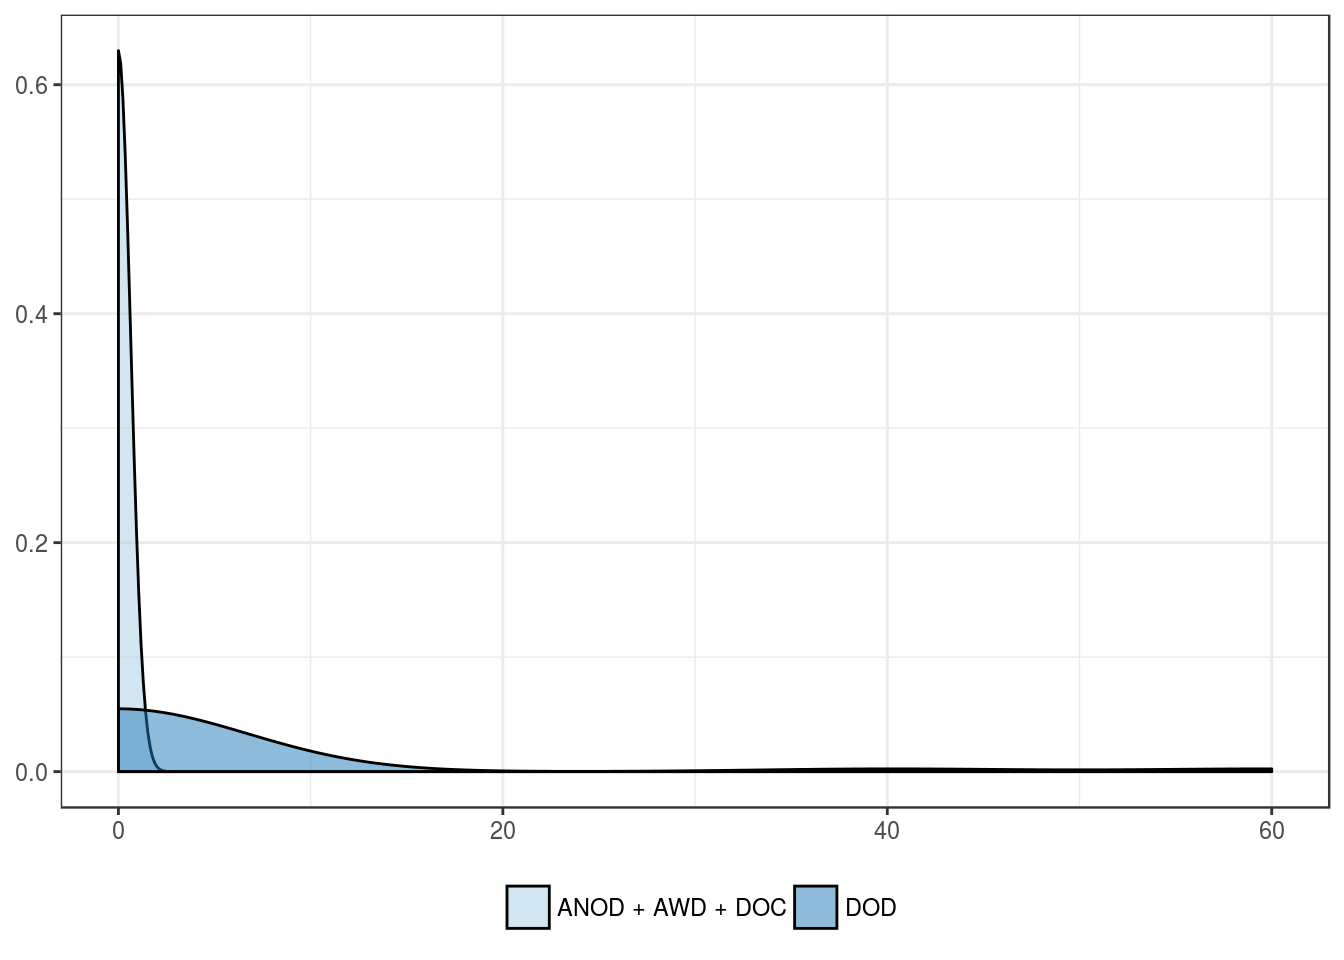
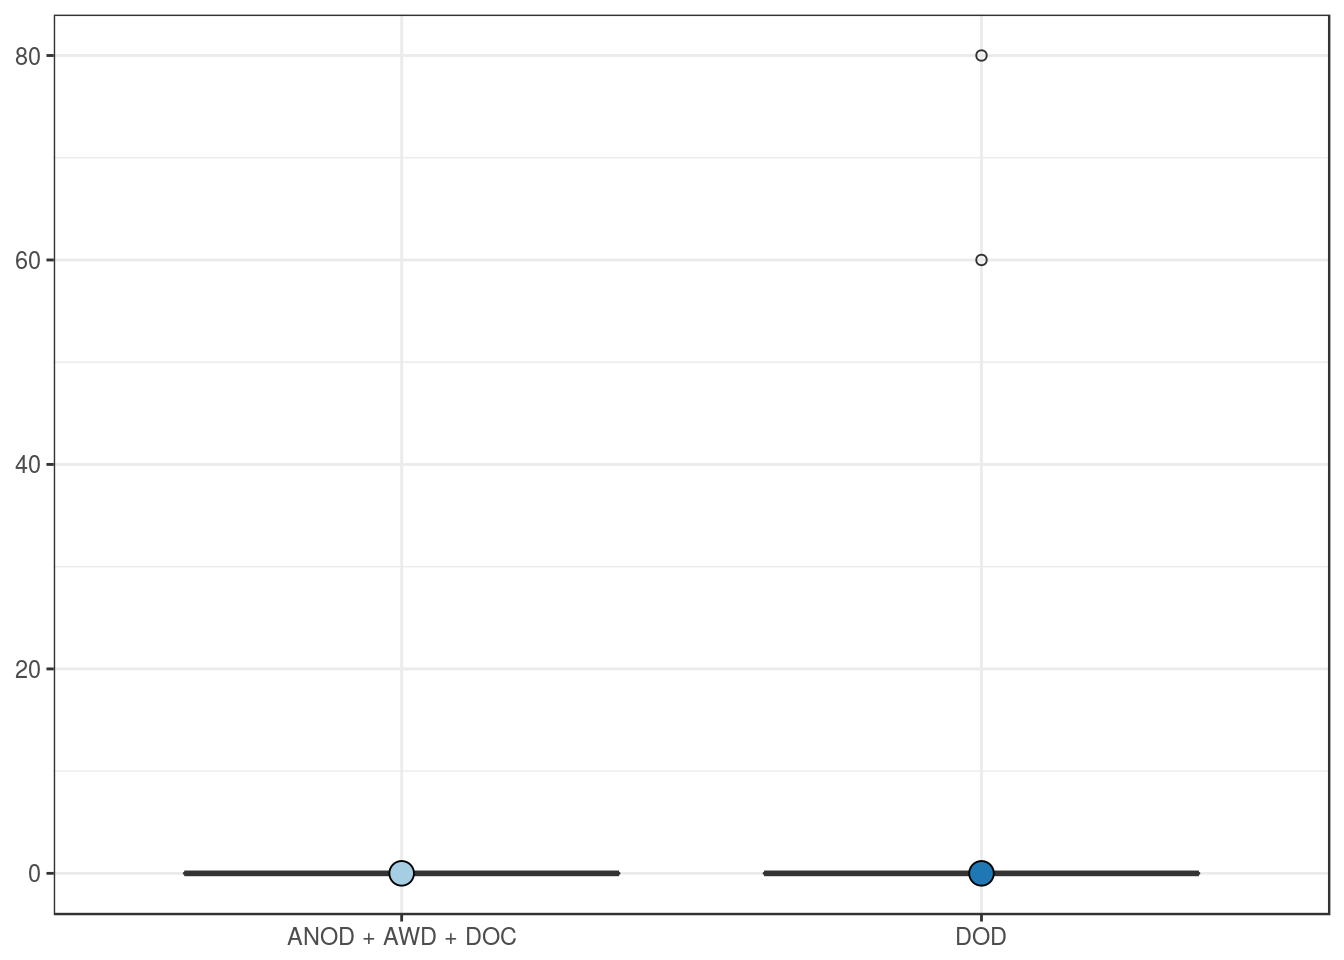
Cancer-related mortality
| ANOD + AWD + DOC | DOD | |
|---|---|---|
| Mean | 0 | 4.0 |
| Standard deviation | 0 | 14.1 |
| Median | 0 | 0.0 |
| Interquartile range | 0 | 0.0 |
| Minimum | 0 | 0.0 |
| Maximum | 0 | 60.0 |
| Value | |
|---|---|
| U-statistic | 69 |
| P statistic | 5.2e-01 |
PD-L1 H-score in tumor cells
Clinical features
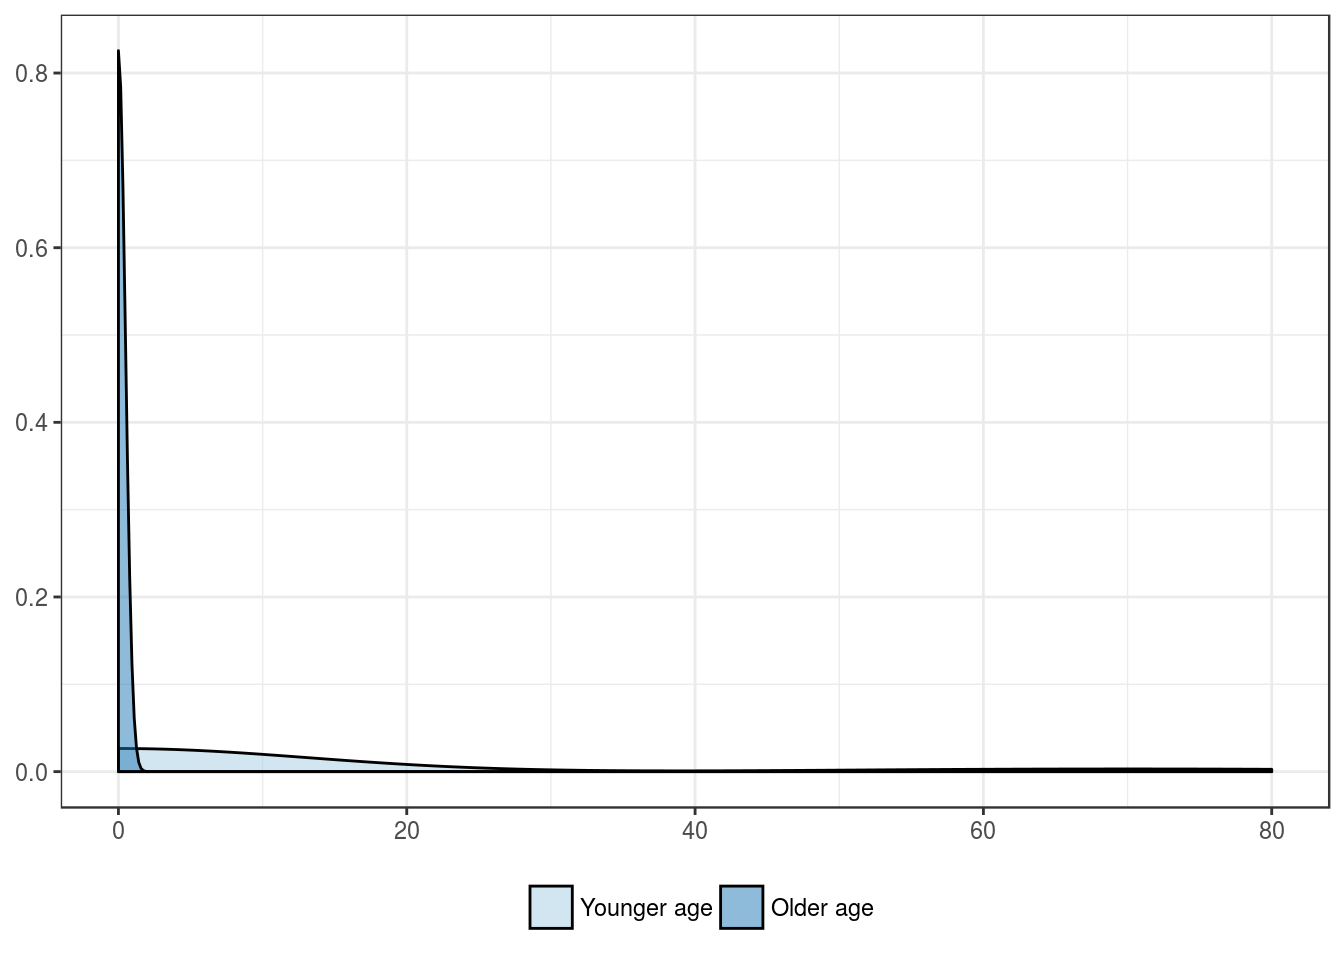
Patients’ age group, in years
| Younger age | Older age | |
|---|---|---|
| Mean | 9.3 | 0 |
| Standard deviation | 24.9 | 0 |
| Median | 0.0 | 0 |
| Interquartile range | 0.0 | 0 |
| Minimum | 0.0 | 0 |
| Maximum | 80.0 | 0 |
| Value | |
|---|---|
| U-statistic | 234 |
| P statistic | 2.1e-02 |

Patients’ sex
| Female | Male | |
|---|---|---|
| Mean | 0 | 5.0 |
| Standard deviation | 0 | 18.6 |
| Median | 0 | 0.0 |
| Interquartile range | 0 | 0.0 |
| Minimum | 0 | 0.0 |
| Maximum | 0 | 80.0 |
| Value | |
|---|---|
| U-statistic | 162 |
| P statistic | 2.4e-01 |

Patients’ race
| Caucasian | African-American | Asian | Other | |
|---|---|---|---|---|
| Mean | 2.1 | 30.0 | NA | NA |
| Standard deviation | 12.8 | 42.4 | NA | NA |
| Median | 0.0 | 30.0 | NA | NA |
| Interquartile range | 0.0 | 30.0 | NA | NA |
| Minimum | 0.0 | 0.0 | NA | NA |
| Maximum | 80.0 | 60.0 | NA | NA |
| Value | |
|---|---|
| Statistic | 5.501 |
| Parameter | 1 |
| P statistic | 0.019 |
Outcome features
Overall mortality
| ANOD + AWD | DOC + DOD | |
|---|---|---|
| Mean | 0 | 4.1 |
| Standard deviation | 0 | 16.9 |
| Median | 0 | 0.0 |
| Interquartile range | 0 | 0.0 |
| Minimum | 0 | 0.0 |
| Maximum | 0 | 80.0 |
| Value | |
|---|---|
| U-statistic | 108 |
| P statistic | 4.4e-01 |
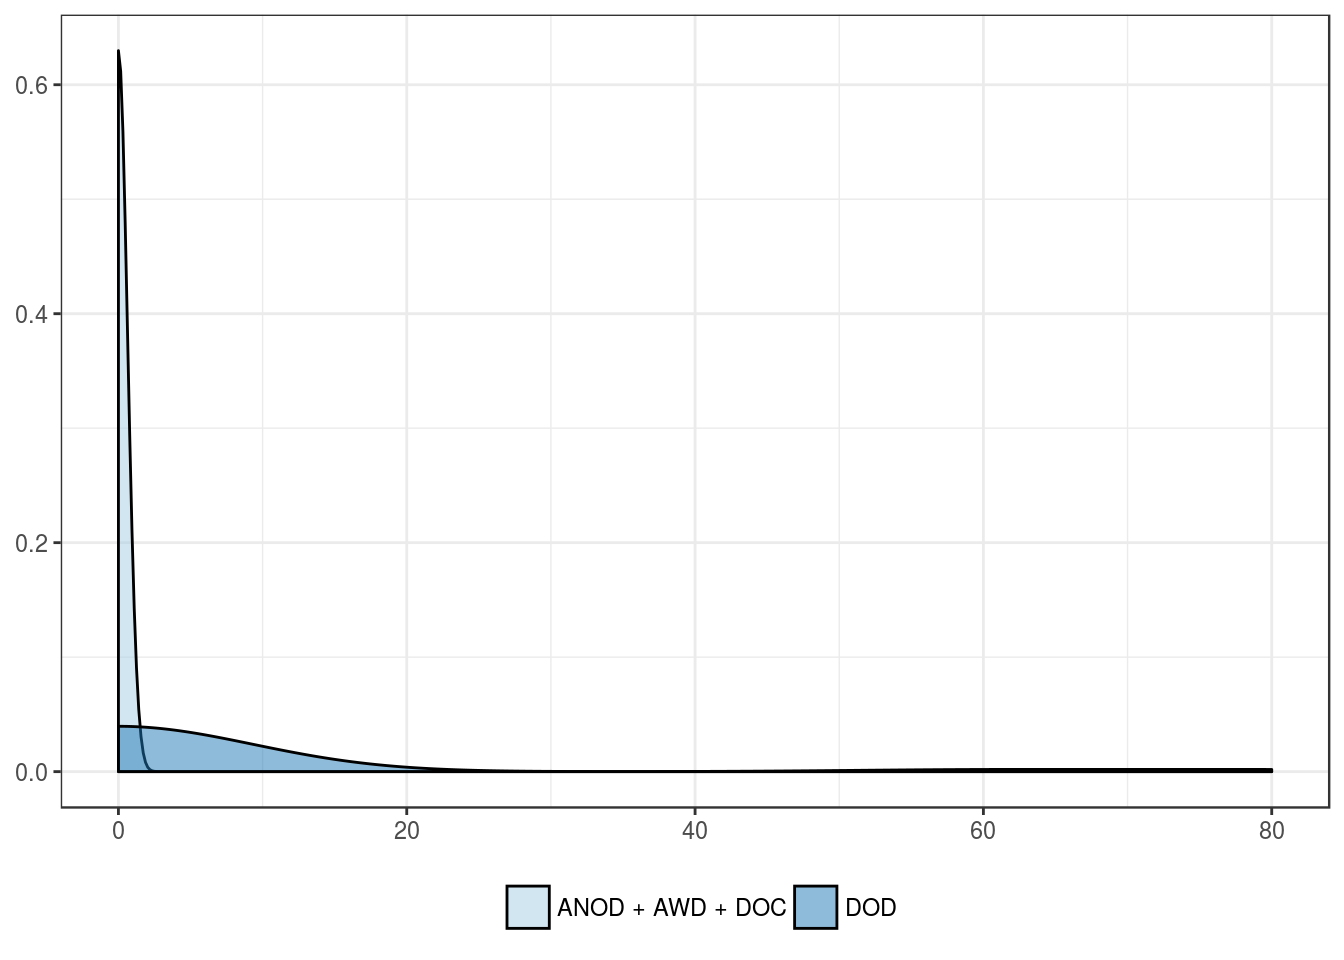
Cancer-related mortality
| ANOD + AWD + DOC | DOD | |
|---|---|---|
| Mean | 0 | 5.6 |
| Standard deviation | 0 | 19.6 |
| Median | 0 | 0.0 |
| Interquartile range | 0 | 0.0 |
| Minimum | 0 | 0.0 |
| Maximum | 0 | 80.0 |
| Value | |
|---|---|
| U-statistic | 69 |
| P statistic | 5.2e-01 |
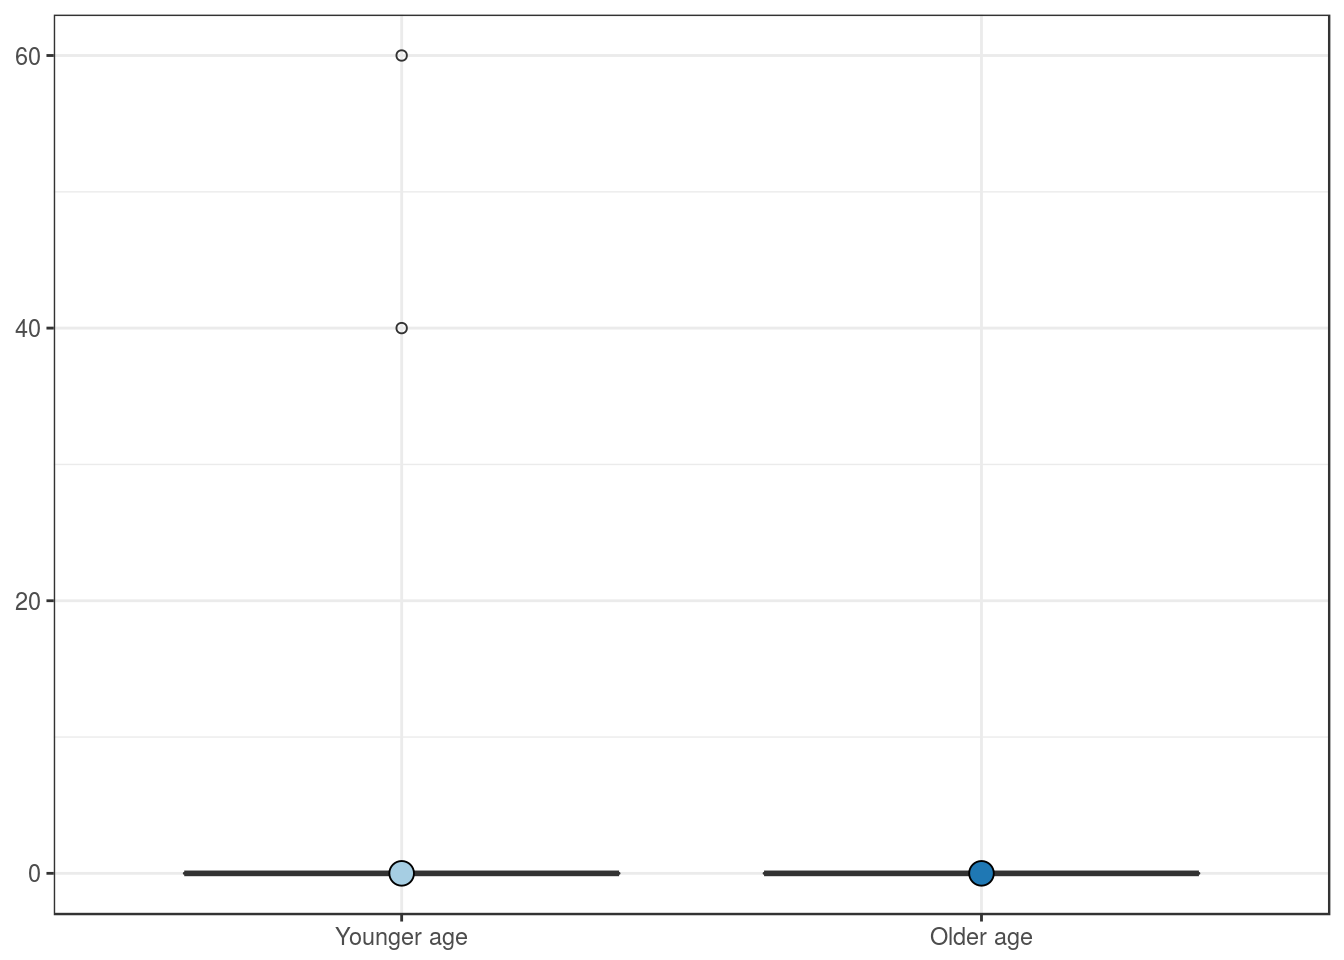
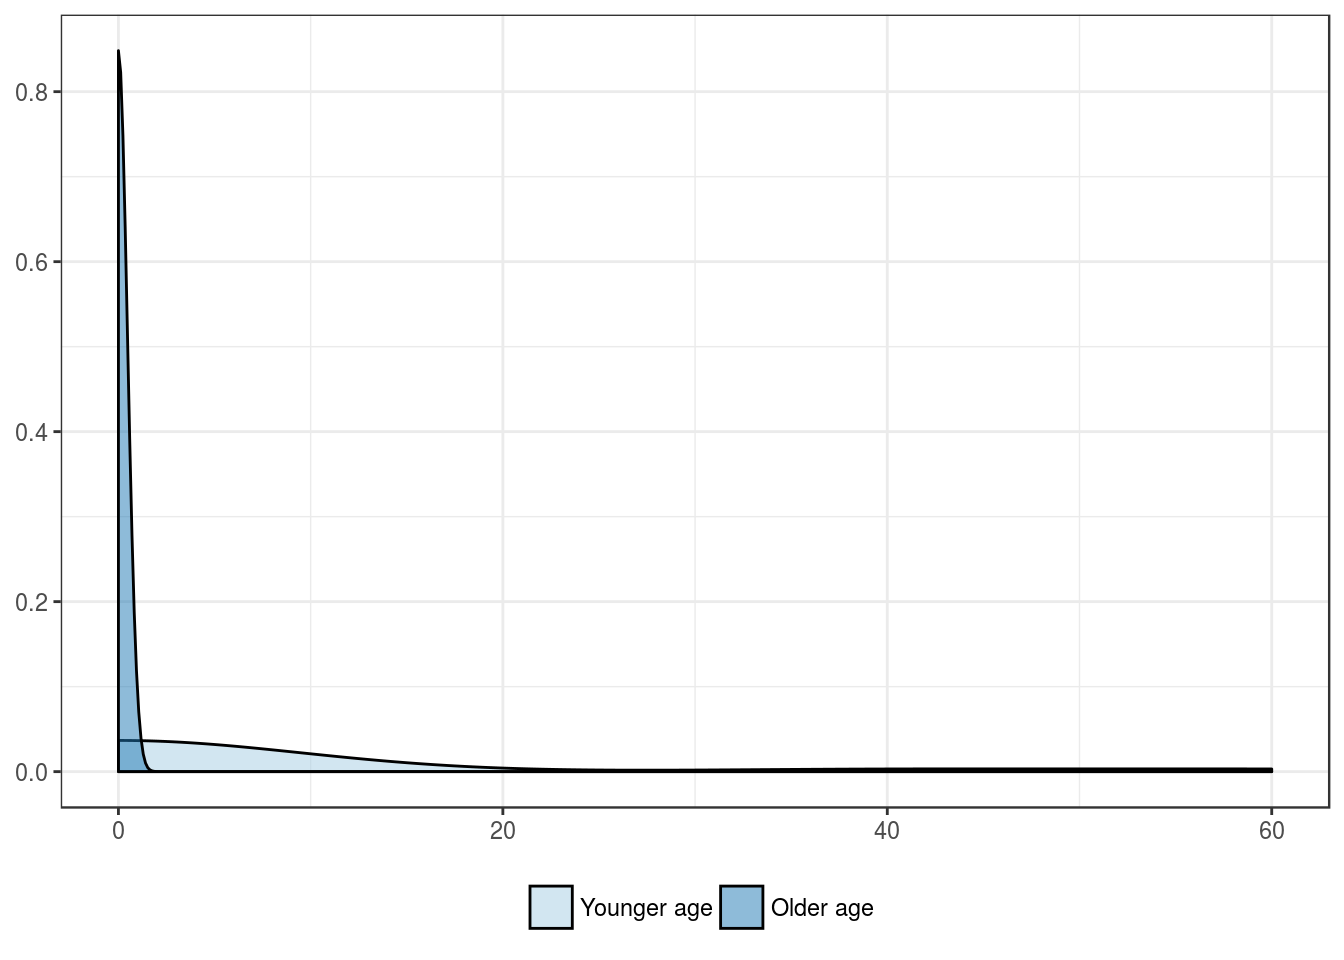
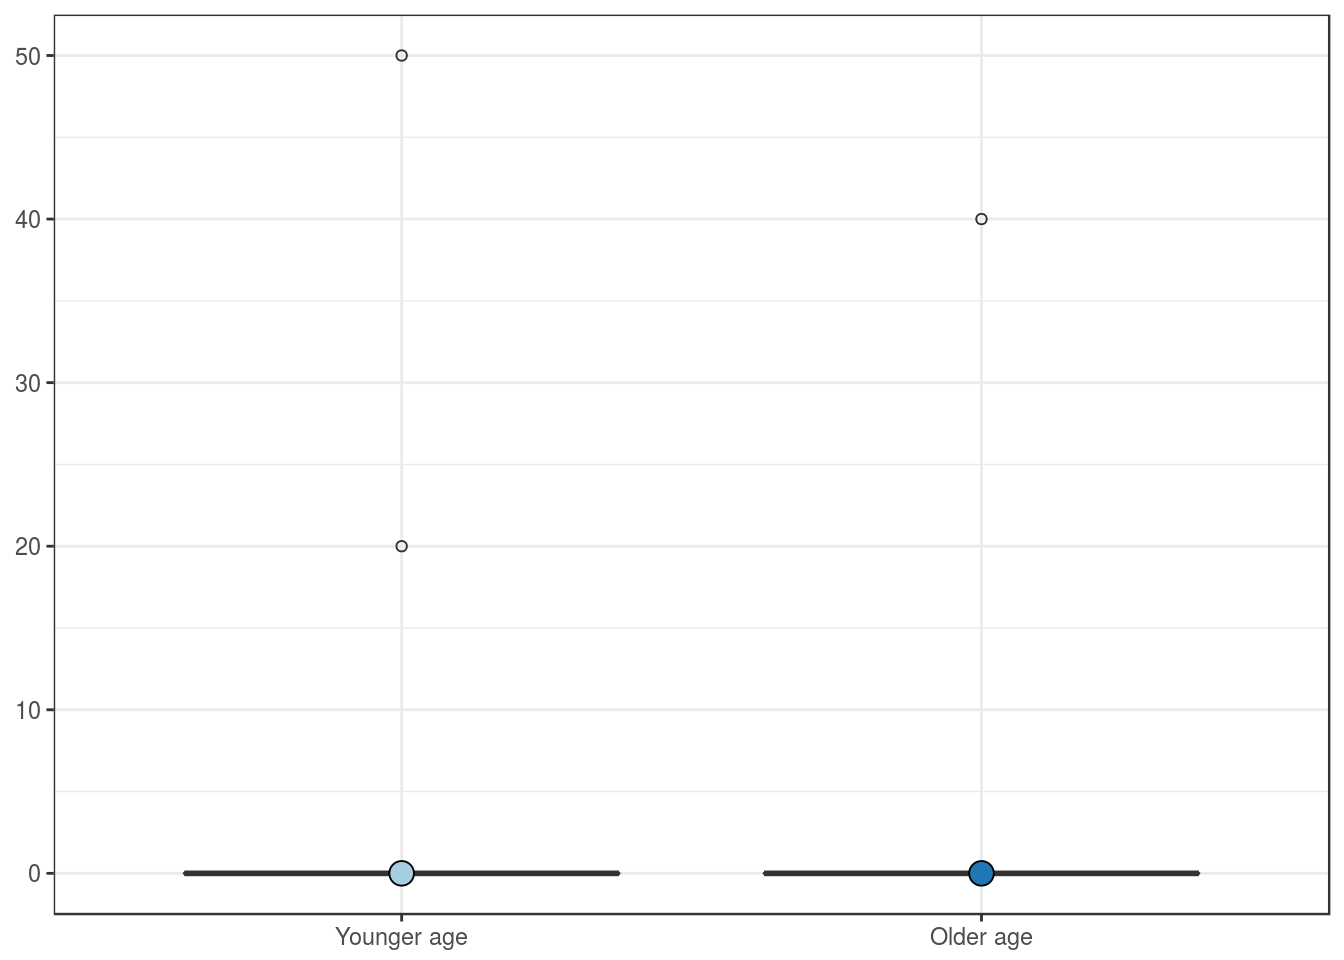
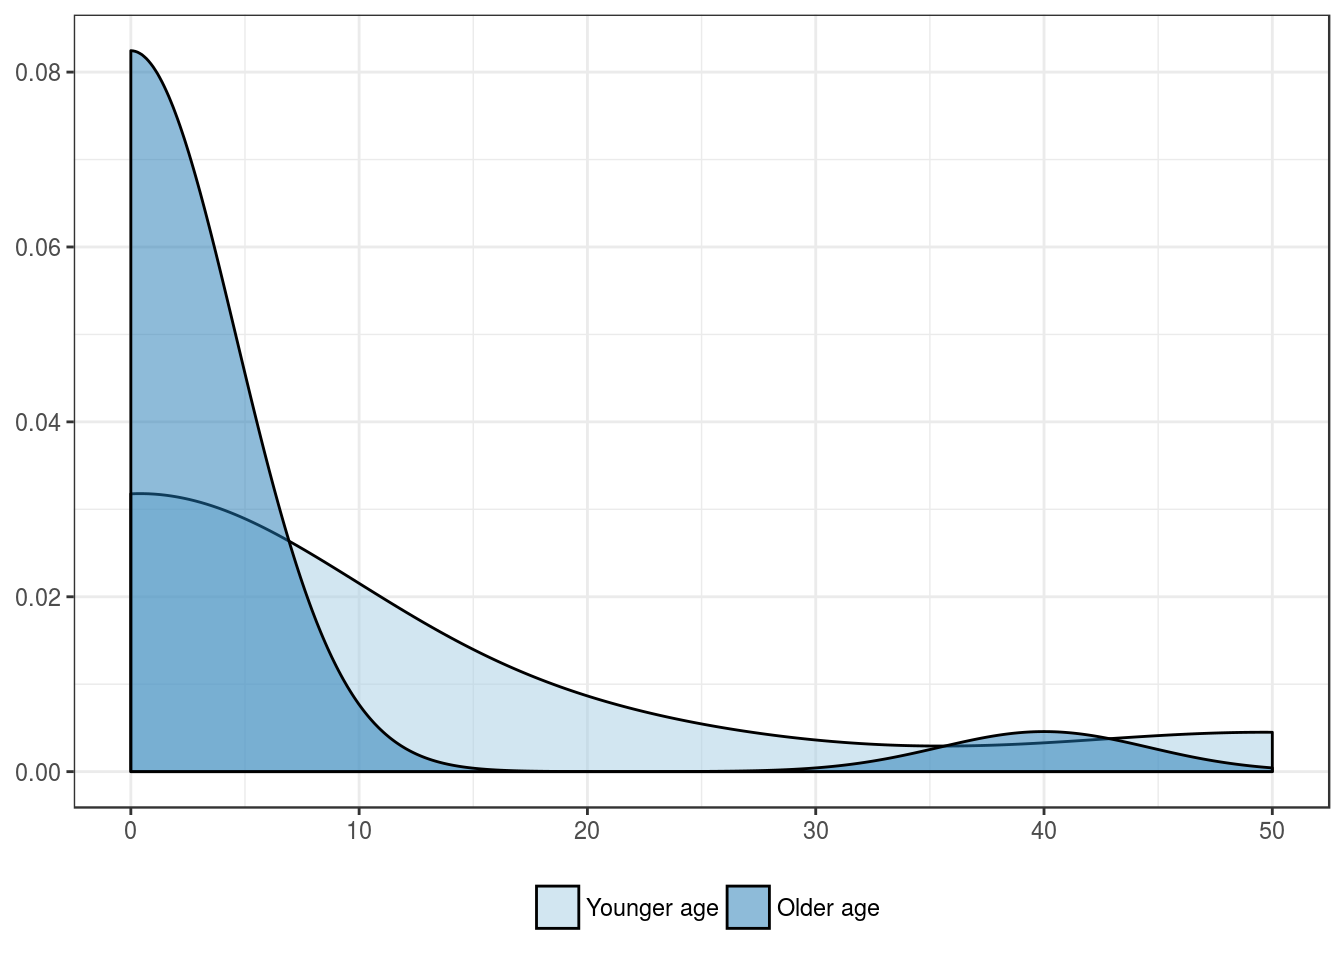
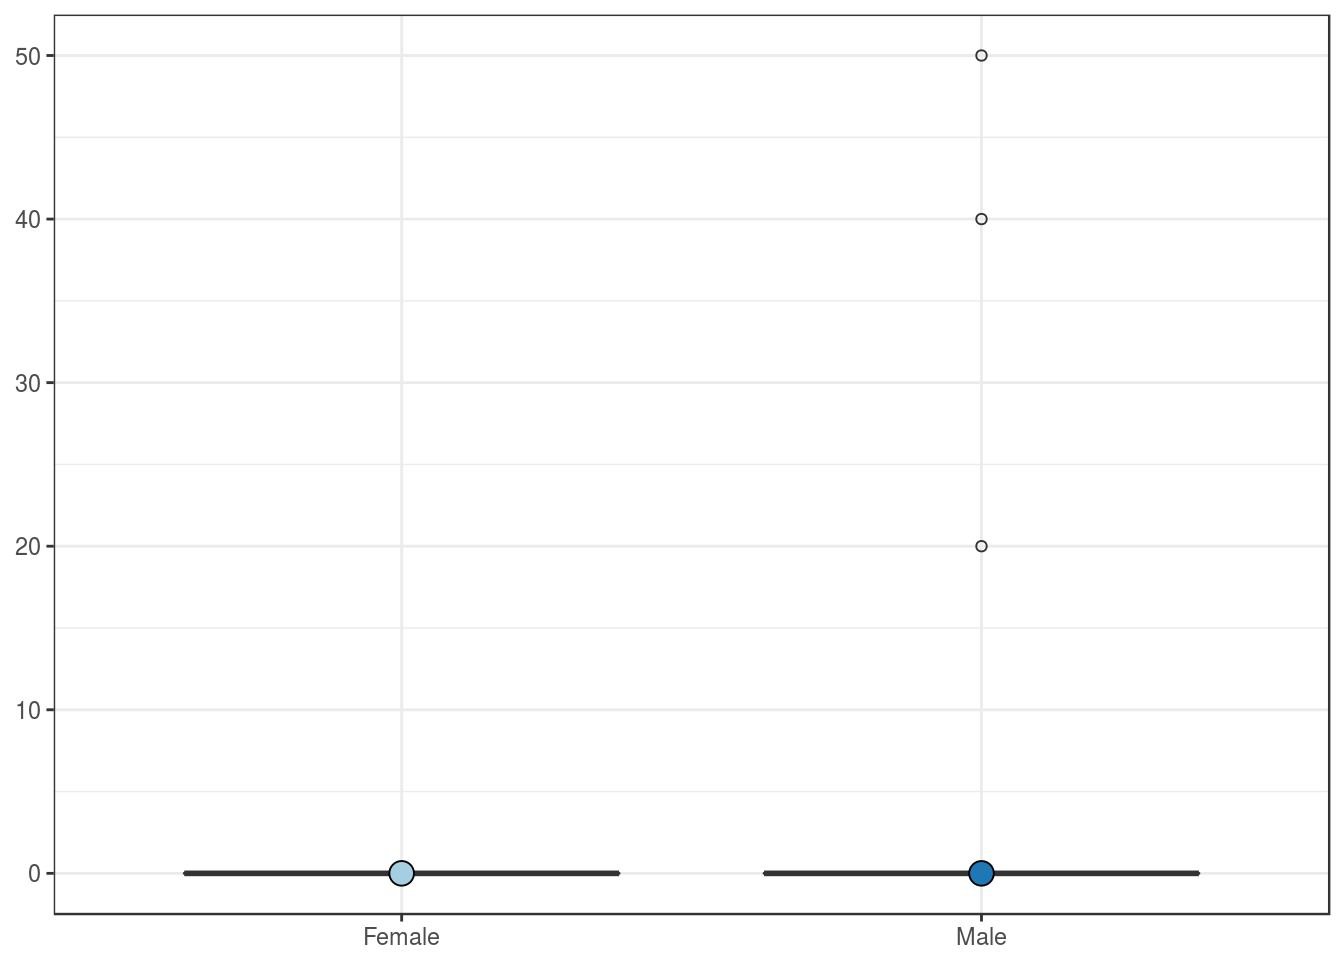
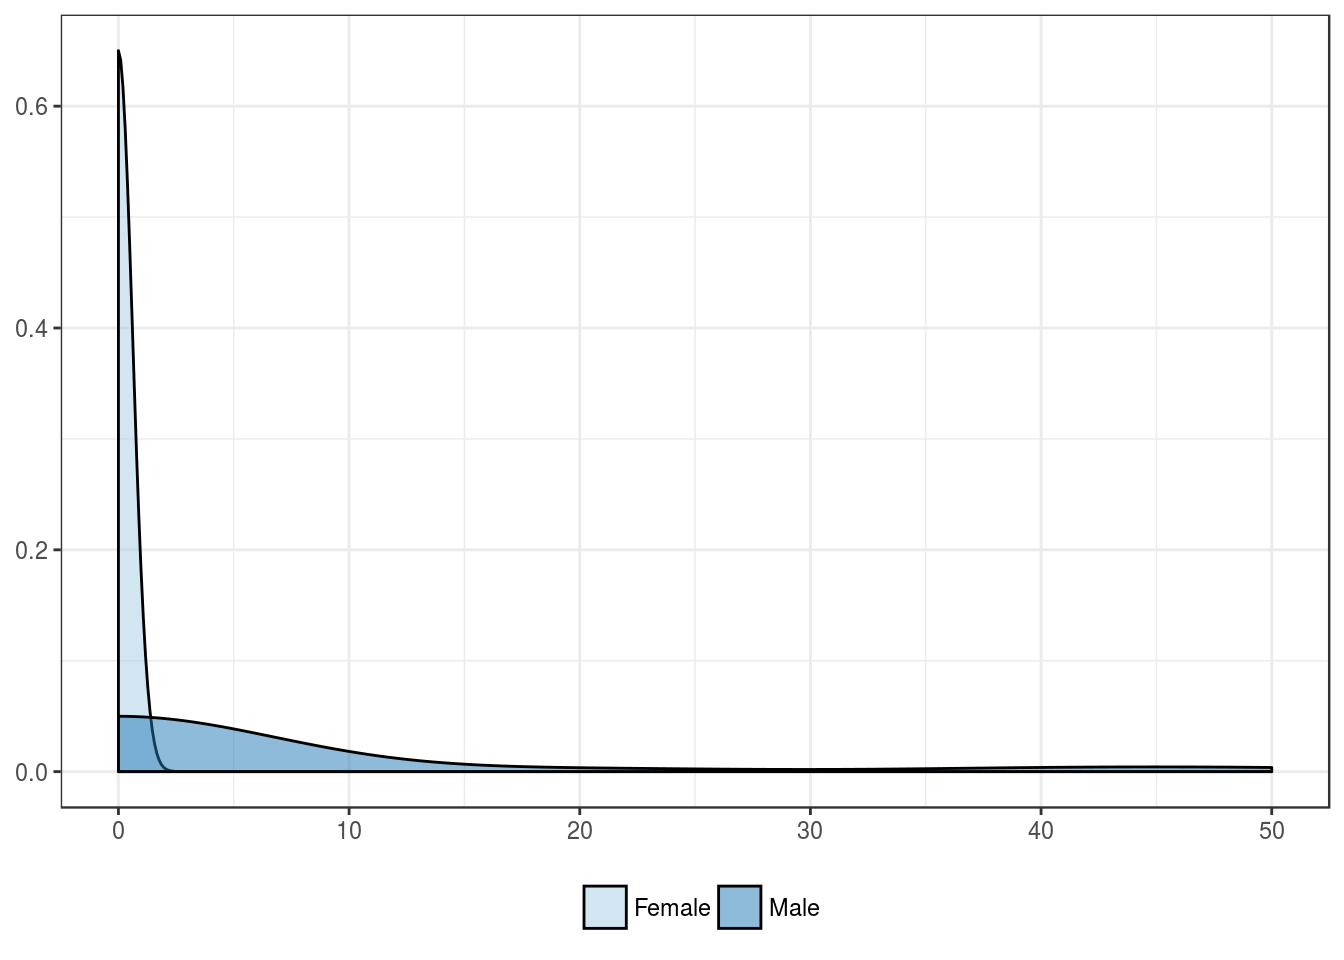
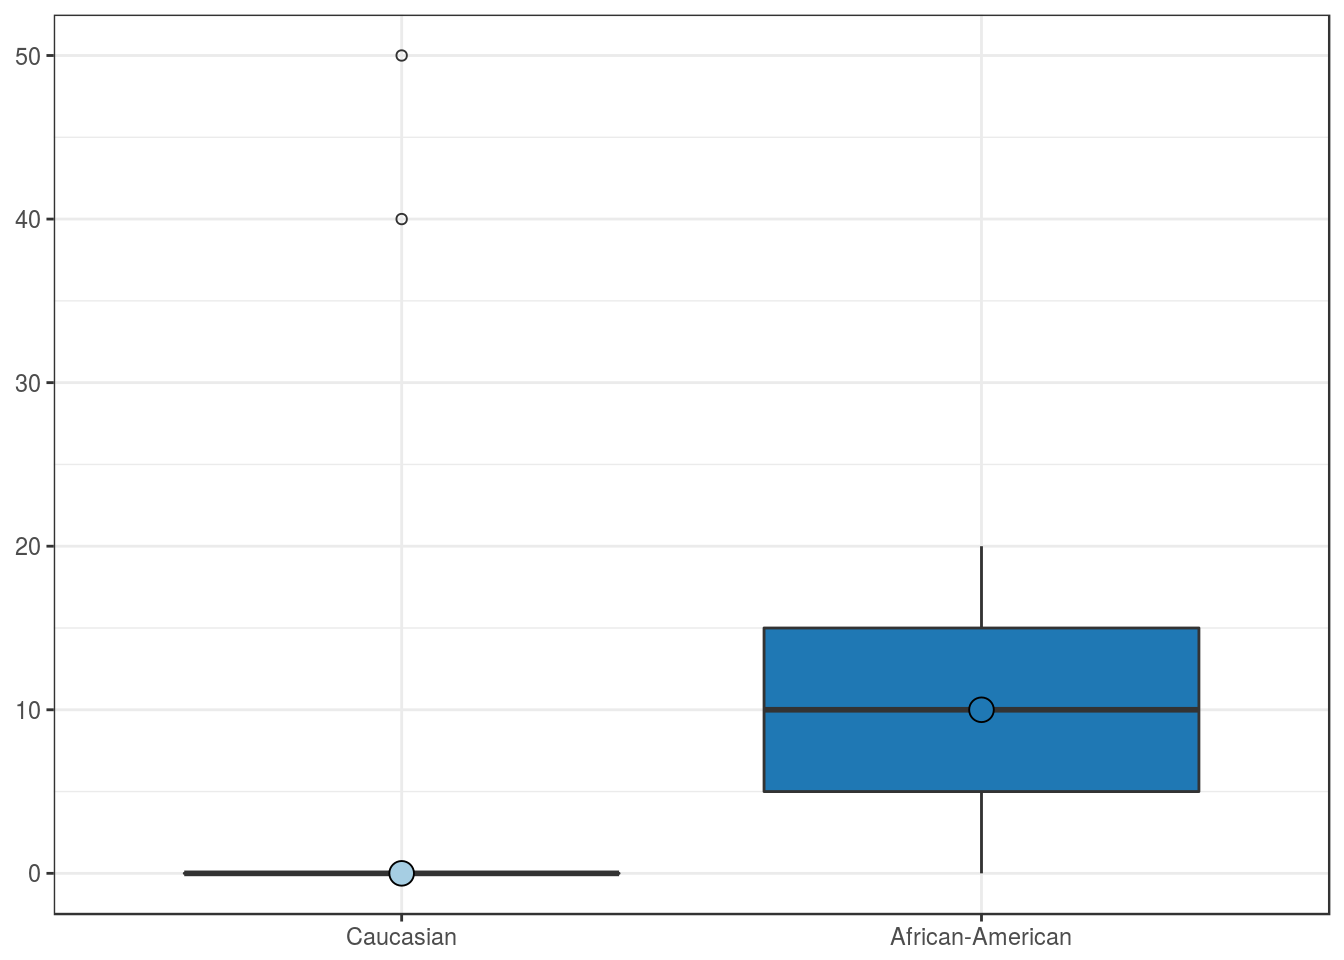
PD-L1 positivity in stromal cells
Clinical features
Patients’ age group, in years
| Younger age | Older age | |
|---|---|---|
| Mean | 7.8 | 2.1 |
| Standard deviation | 17.2 | 9.2 |
| Median | 0.0 | 0.0 |
| Interquartile range | 0.0 | 0.0 |
| Minimum | 0.0 | 0.0 |
| Maximum | 50.0 | 40.0 |
| Value | |
|---|---|
| U-statistic | 100 |
| P statistic | 2e-01 |
Patients’ sex
| Female | Male | |
|---|---|---|
| Mean | 0 | 5.2 |
| Standard deviation | 0 | 14.0 |
| Median | 0 | 0.0 |
| Interquartile range | 0 | 0.0 |
| Minimum | 0 | 0.0 |
| Maximum | 0 | 50.0 |
| Value | |
|---|---|
| U-statistic | 63 |
| P statistic | 3.2e-01 |
Patients’ race
| Caucasian | African-American | Asian | Other | |
|---|---|---|---|---|
| Mean | 3.5 | 10.0 | NA | NA |
| Standard deviation | 12.3 | 14.1 | NA | NA |
| Median | 0.0 | 10.0 | NA | NA |
| Interquartile range | 0.0 | 10.0 | NA | NA |
| Minimum | 0.0 | 0.0 | NA | NA |
| Maximum | 50.0 | 20.0 | NA | NA |
| Value | |
|---|---|
| Statistic | 2.759 |
| Parameter | 1 |
| P statistic | 0.097 |
Outcome features
Overall mortality
| ANOD + AWD | DOC + DOD | |
|---|---|---|
| Mean | 0 | 4.8 |
| Standard deviation | 0 | 13.4 |
| Median | 0 | 0.0 |
| Interquartile range | 0 | 0.0 |
| Minimum | 0 | 0.0 |
| Maximum | 0 | 50.0 |
| Value | |
|---|---|
| U-statistic | 50 |
| P statistic | 4.3e-01 |
Cancer-related mortality
| ANOD + AWD + DOC | DOD | |
|---|---|---|
| Mean | 0 | 6.9 |
| Standard deviation | 0 | 15.8 |
| Median | 0 | 0.0 |
| Interquartile range | 0 | 0.0 |
| Minimum | 0 | 0.0 |
| Maximum | 0 | 50.0 |
| Value | |
|---|---|
| U-statistic | 32.5 |
| P statistic | 3.4e-01 |