Outcome analysis for metastatic tumors
PD-L1 expression
Overall mortality
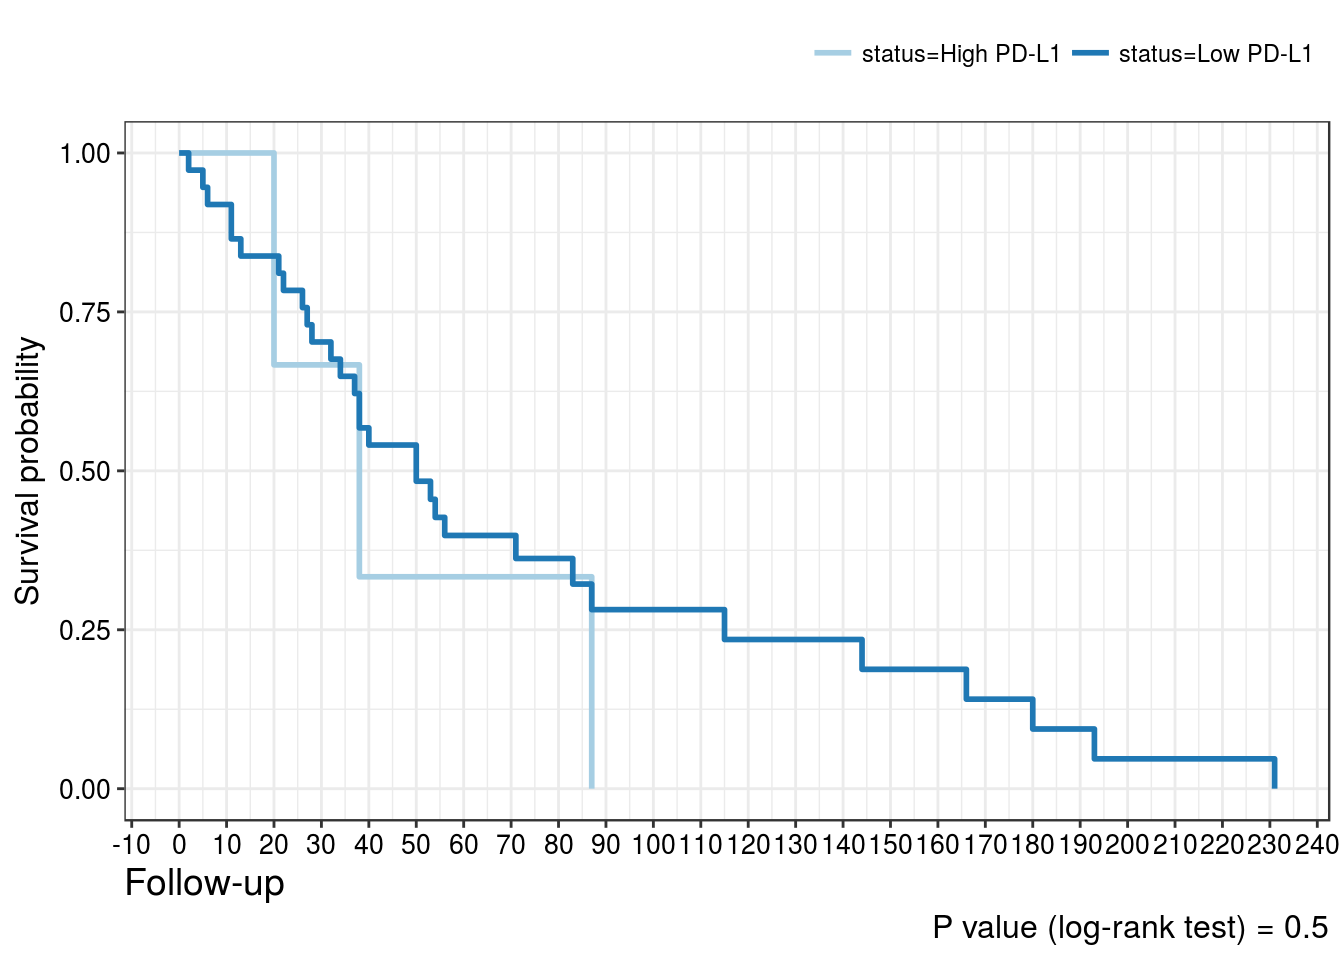
PD-L1 positivity in tumor cells
| ANOD + AWD (%) | DOC + DOD (%) | |
|---|---|---|
| Low PD-L1 | 7 (100) | 31 (91.2) |
| High PD-L1 | 0 (0) | 3 (8.8) |

| Predictors | Odds Ratio (95% CI) | P value | Hazard Ratio (95% CI) | P value |
|---|---|---|---|---|
| High PDL1 positivity in tumor cells | 9606893.11 (1.3e-122, NA) | 0.99 | 1.56 (0.47, 5.18) | 0.49 |
PD-L1 H-score in tumor cells
| ANOD + AWD (%) | DOC + DOD (%) | |
|---|---|---|
| Low PD-L1 | 7 (100) | 31 (91.2) |
| High PD-L1 | 0 (0) | 3 (8.8) |

| Predictors | Odds Ratio (95% CI) | P value | Hazard Ratio (95% CI) | P value |
|---|---|---|---|---|
| High PDL1 H-score in tumor cells | 9606893.11 (1.3e-122, NA) | 0.99 | 1.56 (0.47, 5.18) | 0.49 |

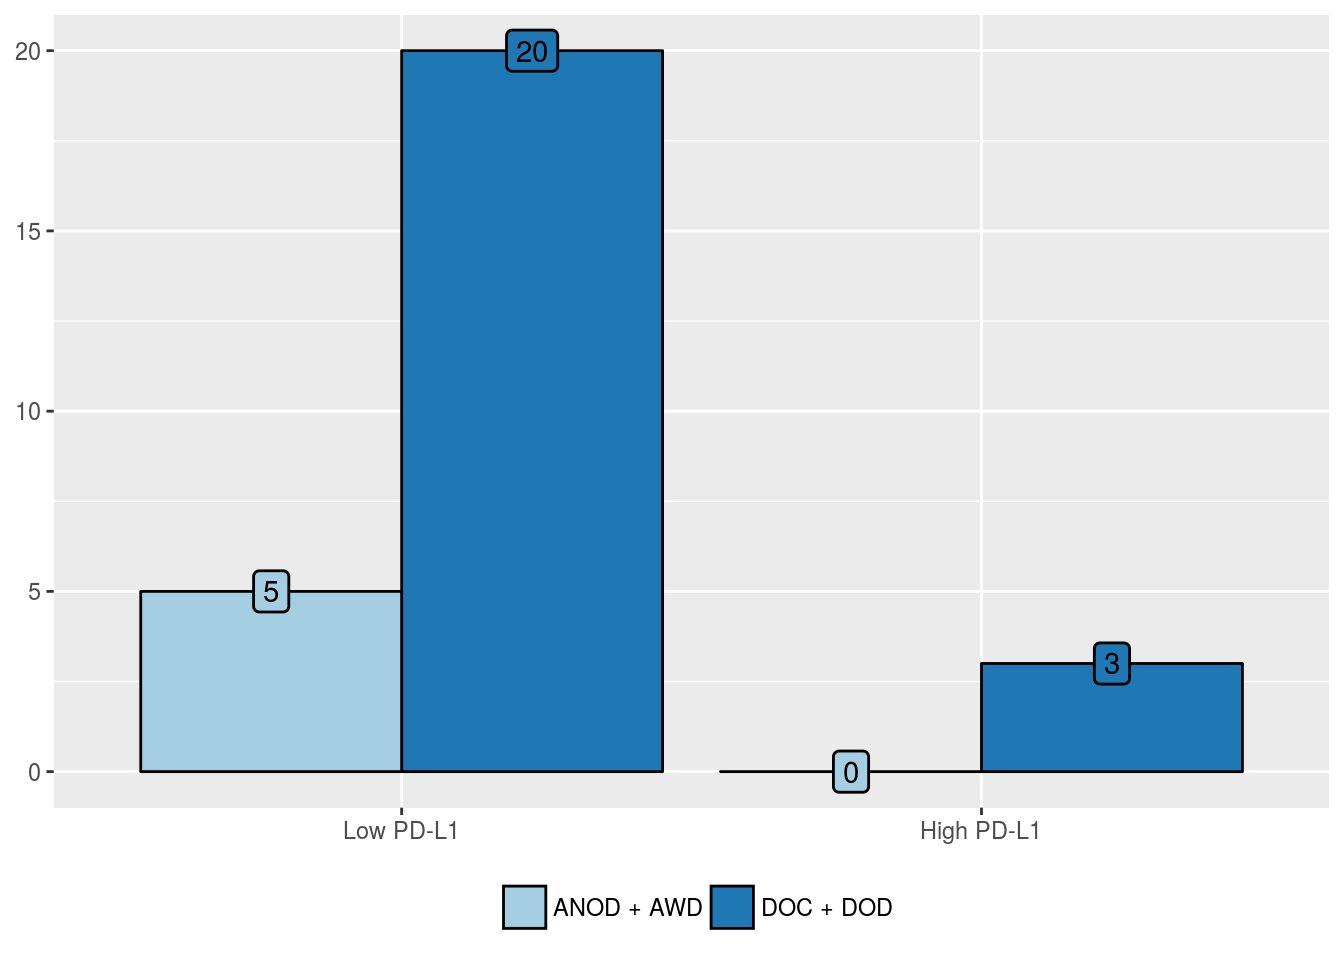
PD-L1 positivity in stromal cells
| ANOD + AWD (%) | DOC + DOD (%) | |
|---|---|---|
| Low PD-L1 | 5 (100) | 20 (87) |
| High PD-L1 | 0 (0) | 3 (13) |
| Predictors | Odds Ratio (95% CI) | P value | Hazard Ratio (95% CI) | P value |
|---|---|---|---|---|
| High PDL1 positivity in stromal cells | 1.1e+07 (3.5e-122, NA) | 0.99 | 3.92 (1.04, 14.85) | 0.074 |
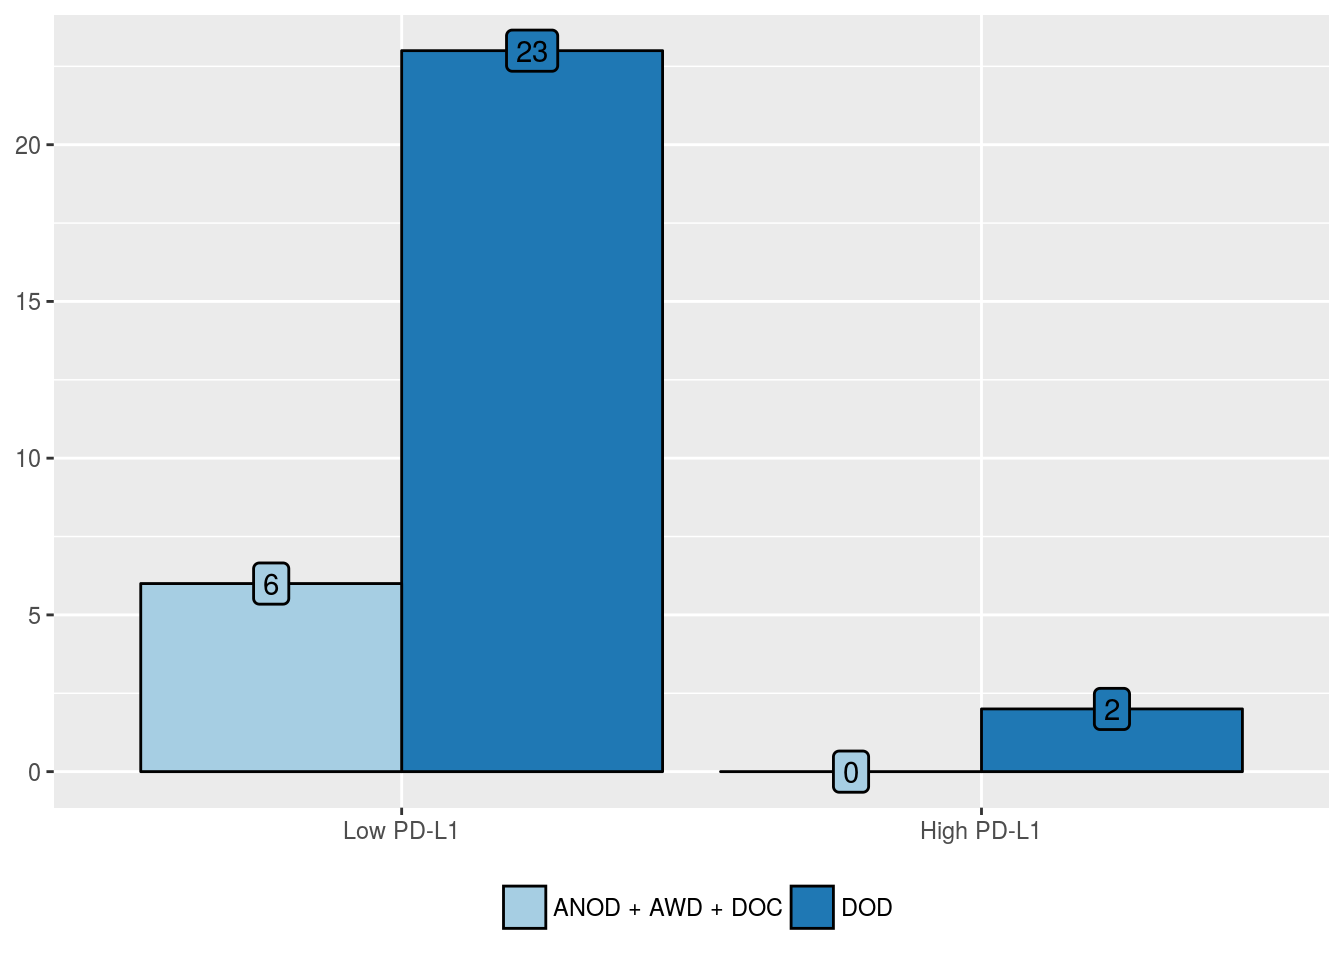
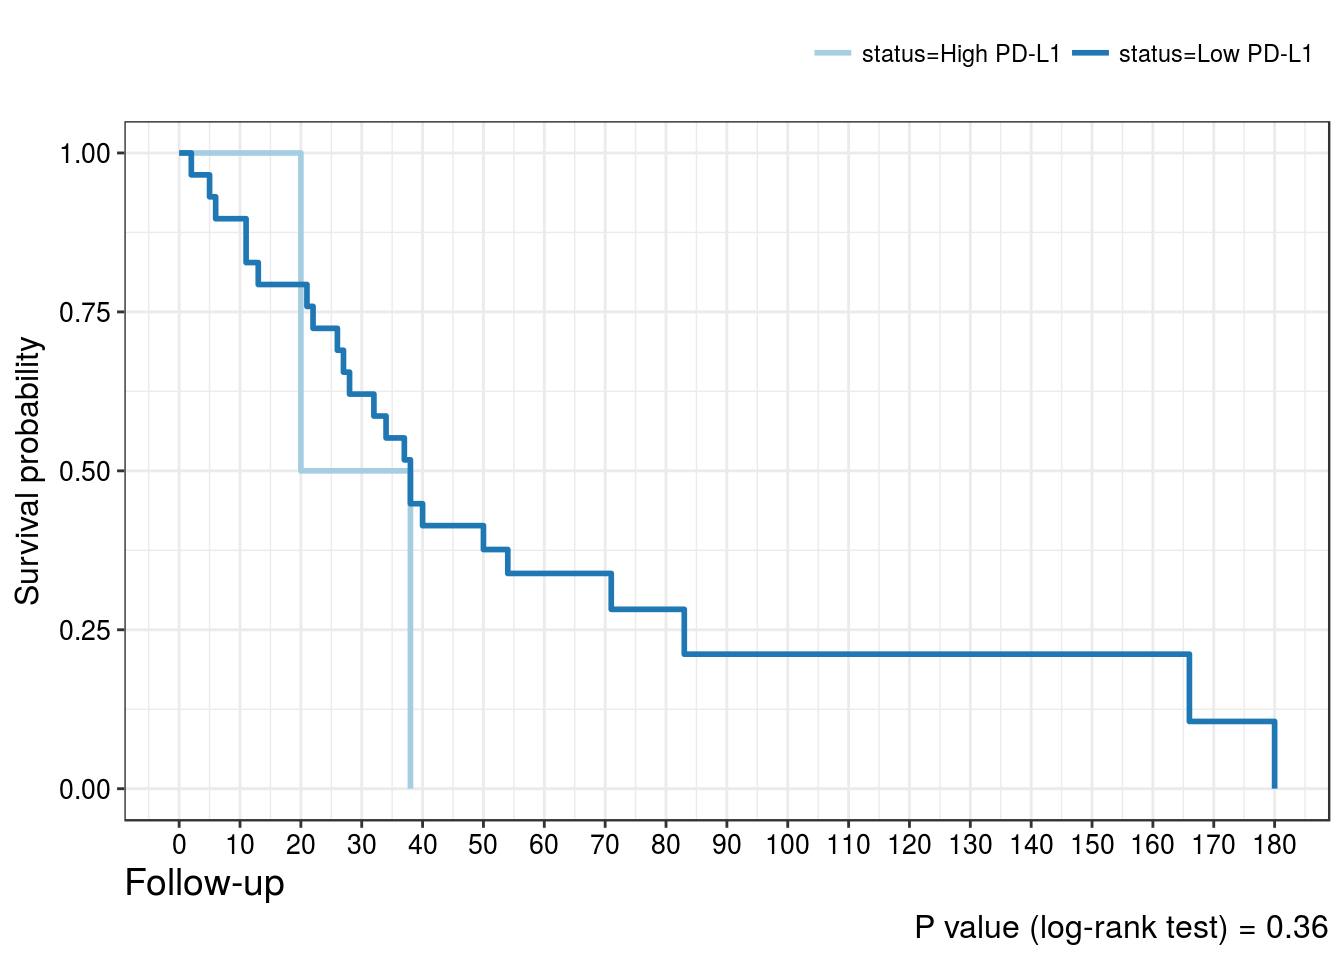
Cancer-related mortality
PD-L1 positivity in tumor cells
| ANOD + AWD + DOC (%) | DOD (%) | |
|---|---|---|
| Low PD-L1 | 6 (100) | 23 (92) |
| High PD-L1 | 0 (0) | 2 (8) |
| Predictors | Odds Ratio (95% CI) | P value | Hazard Ratio (95% CI) | P value |
|---|---|---|---|---|
| High PDL1 positivity in tumor cells | 1.1e+07 (8.1e-184, NA) | 1 | 2.07 (0.47, 9.05) | 0.38 |
PD-L1 H-score in tumor cells
| ANOD + AWD + DOC (%) | DOD (%) | |
|---|---|---|
| Low PD-L1 | 6 (100) | 23 (92) |
| High PD-L1 | 0 (0) | 2 (8) |

| Predictors | Odds Ratio (95% CI) | P value | Hazard Ratio (95% CI) | P value |
|---|---|---|---|---|
| High PDL1 H-score in tumor cells | 1.1e+07 (8.1e-184, NA) | 1 | 2.07 (0.47, 9.05) | 0.38 |

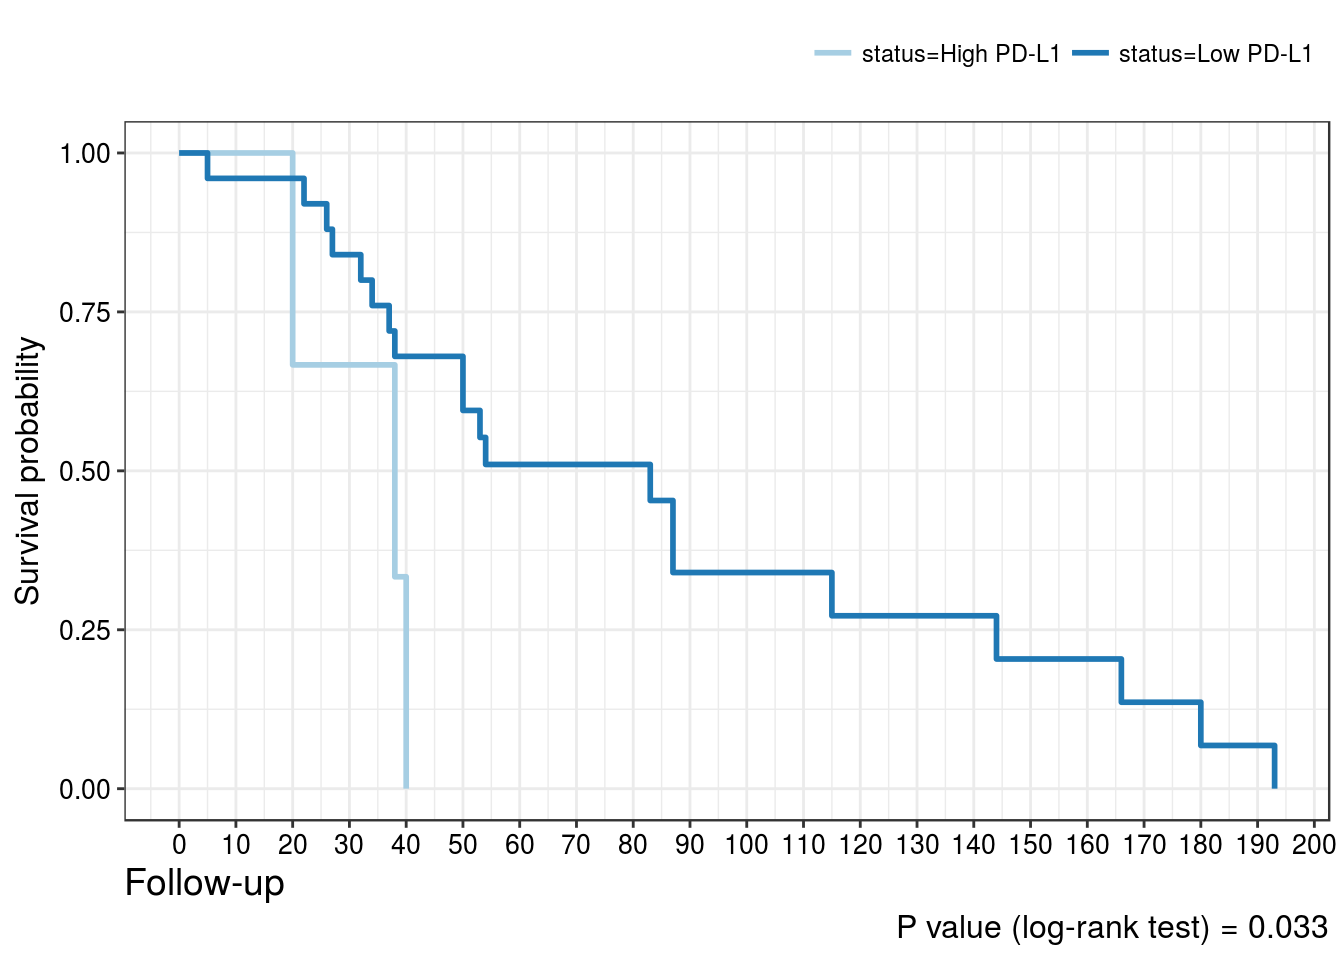
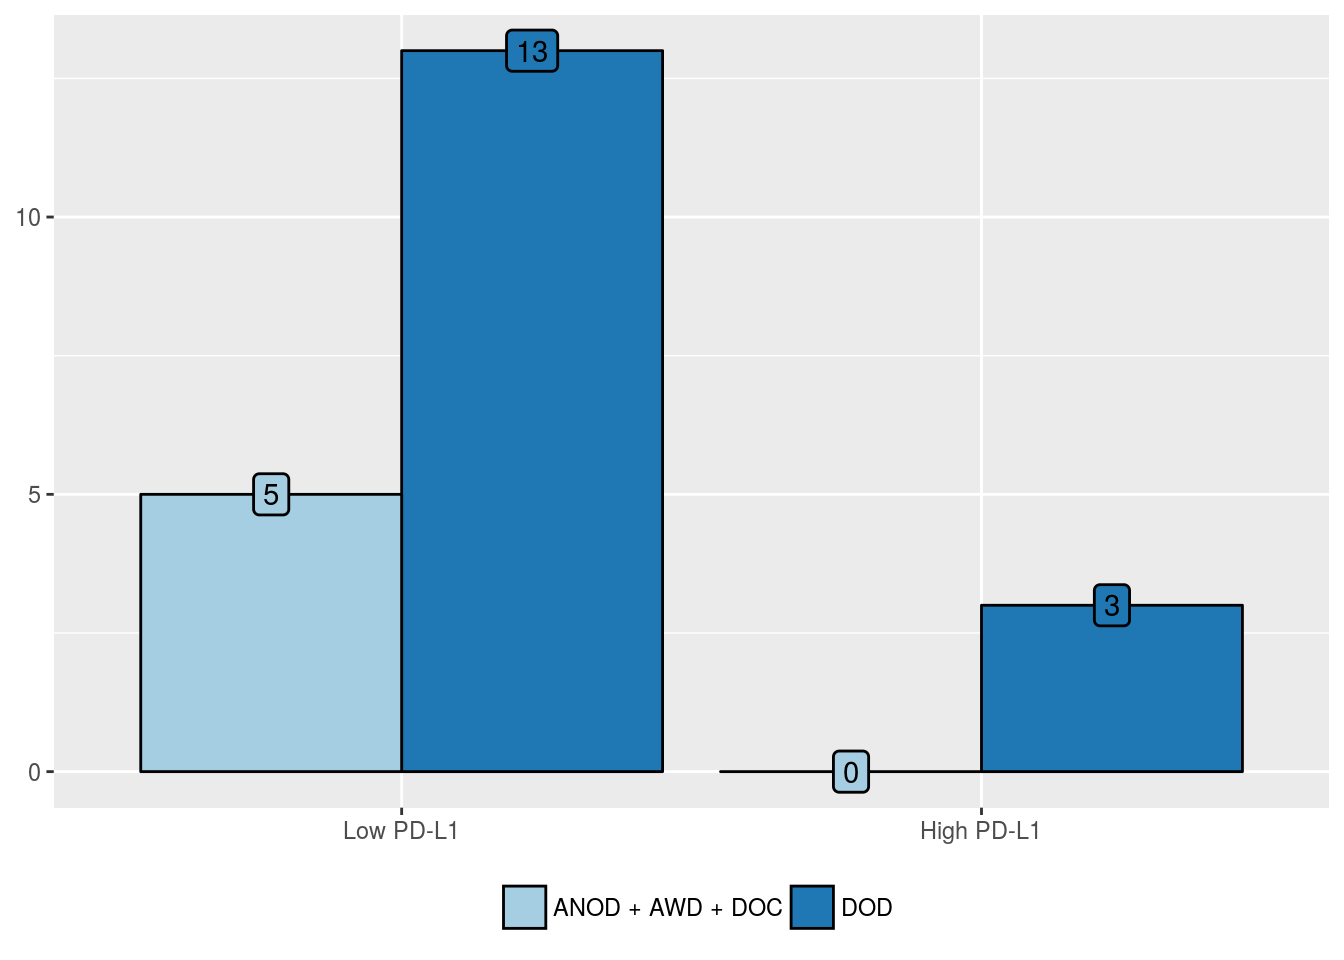
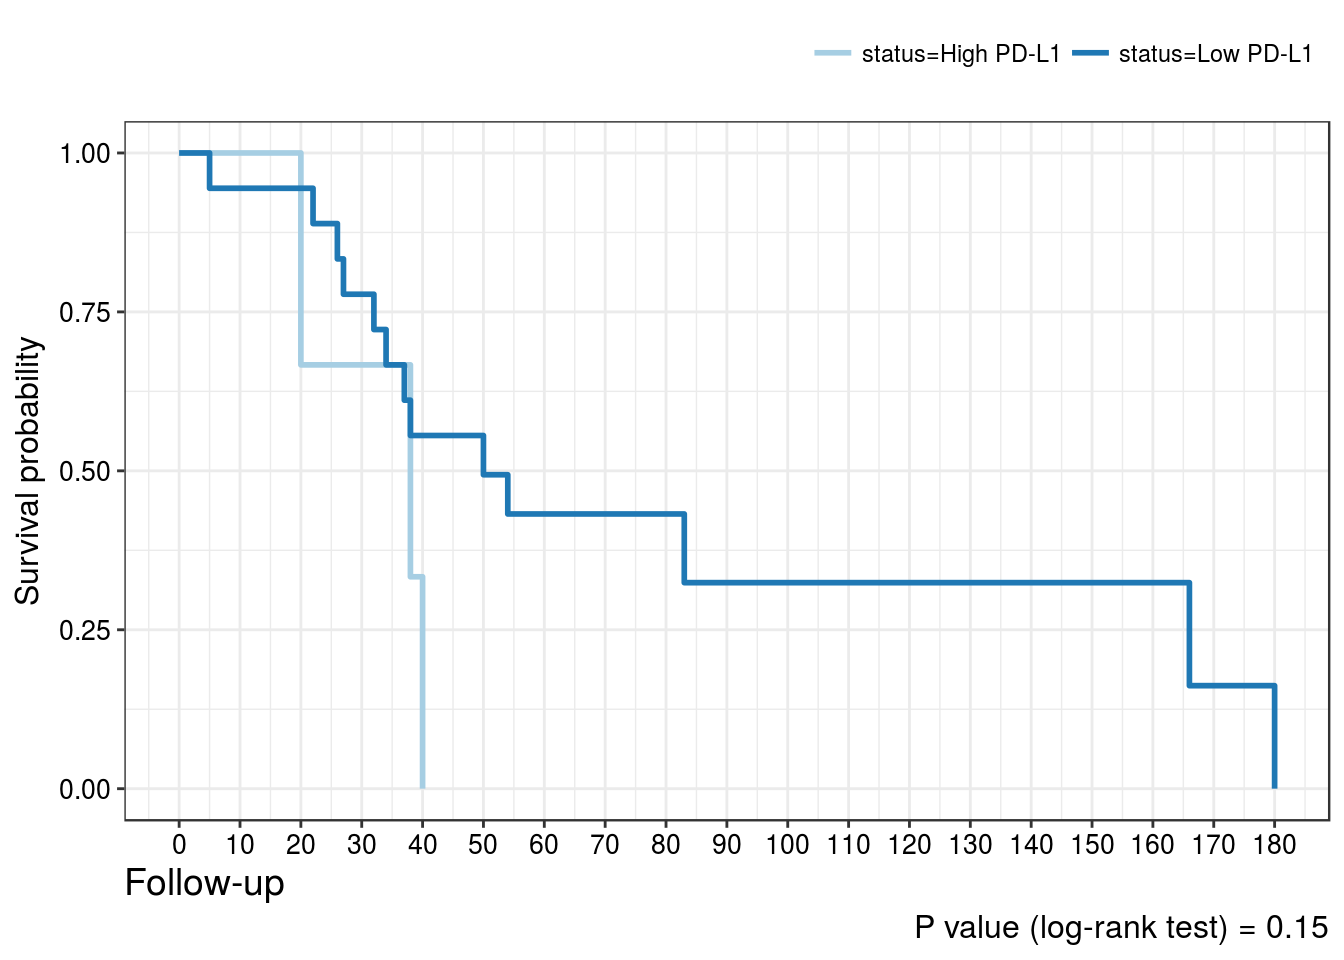
PD-L1 positivity in stromal cells
| ANOD + AWD + DOC (%) | DOD (%) | |
|---|---|---|
| Low PD-L1 | 5 (100) | 13 (81.2) |
| High PD-L1 | 0 (0) | 3 (18.8) |
| Predictors | Odds Ratio (95% CI) | P value | Hazard Ratio (95% CI) | P value |
|---|---|---|---|---|
| High PDL1 positivity in stromal cells | 4.4e+07 (7.8e-205, NA) | 1 | 2.59 (0.68, 9.79) | 0.2 |
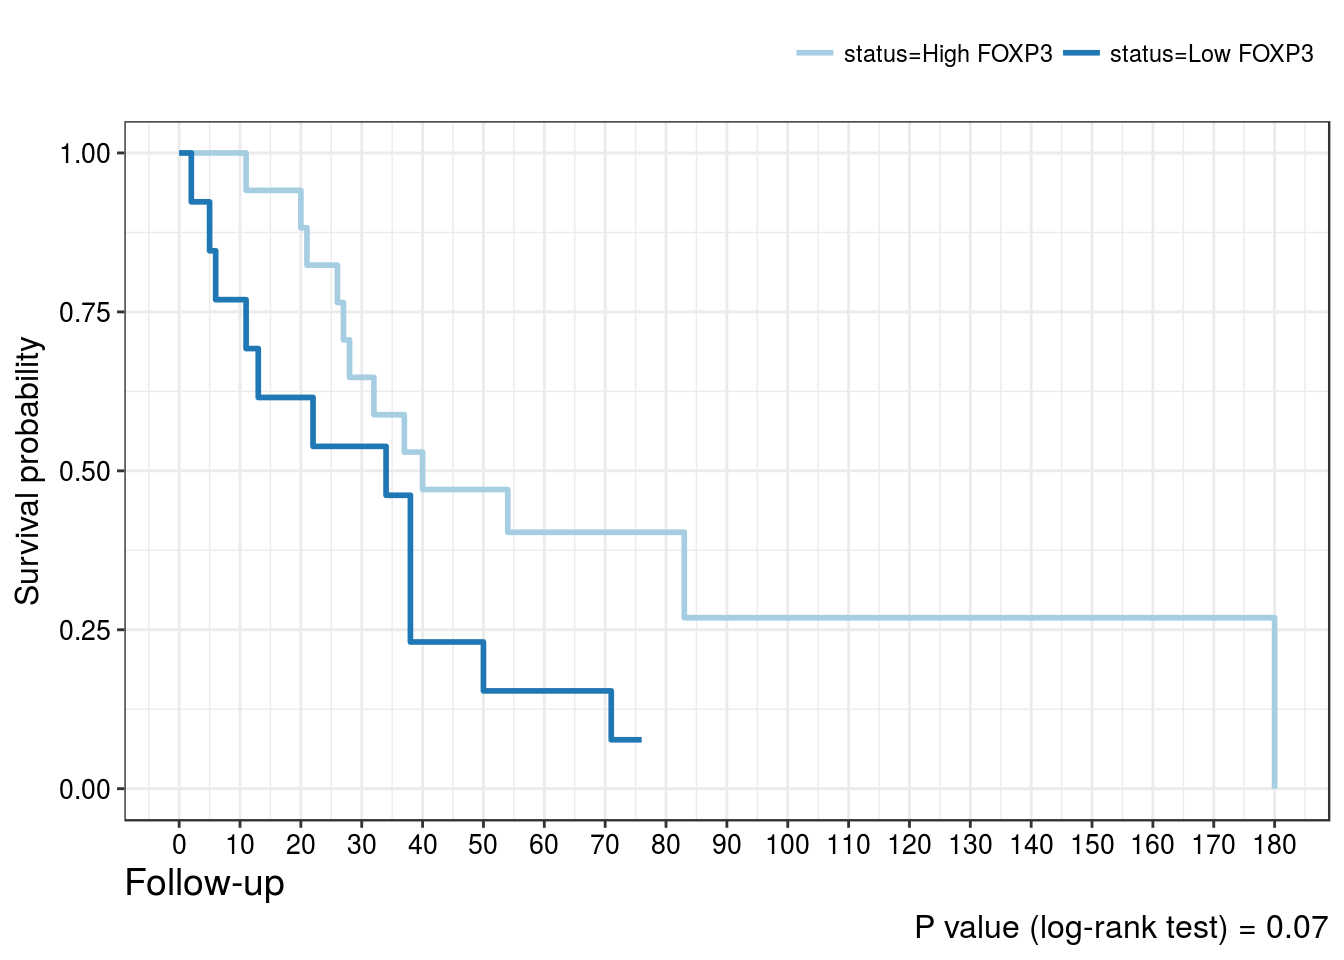
FOXP3 expression
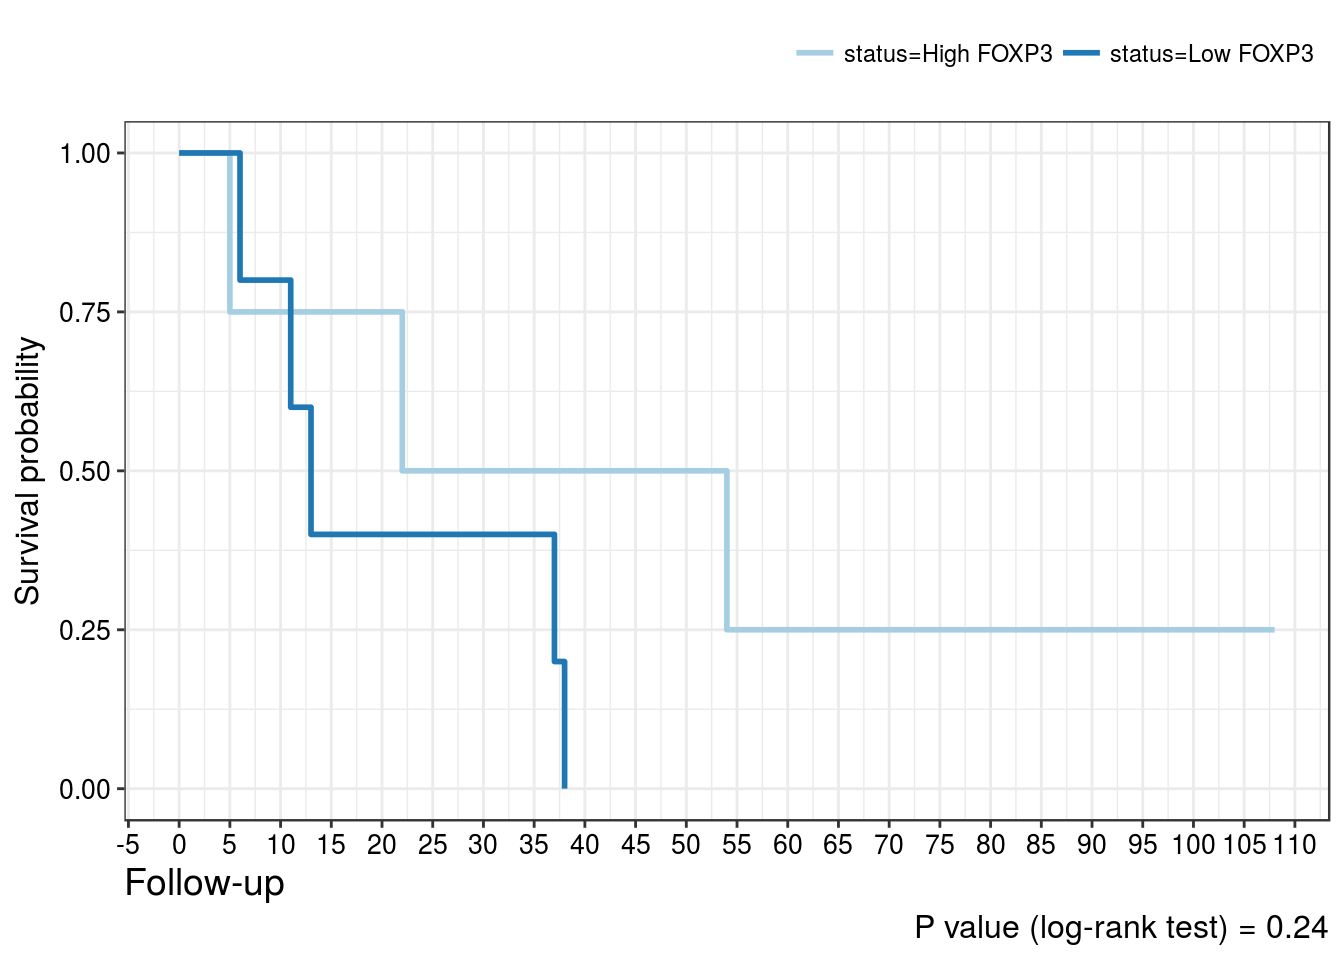
Overall mortality
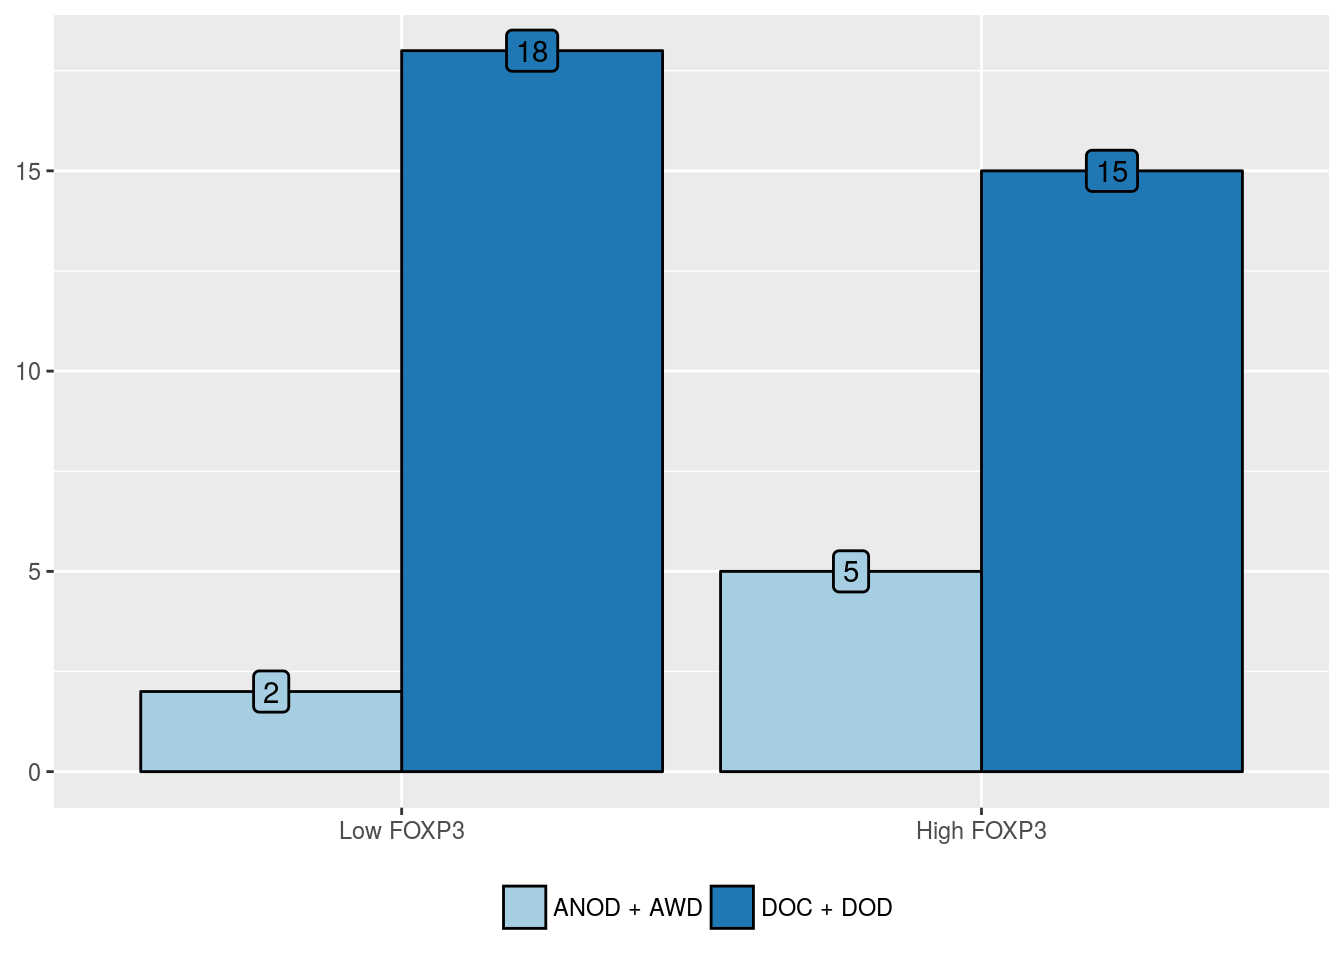
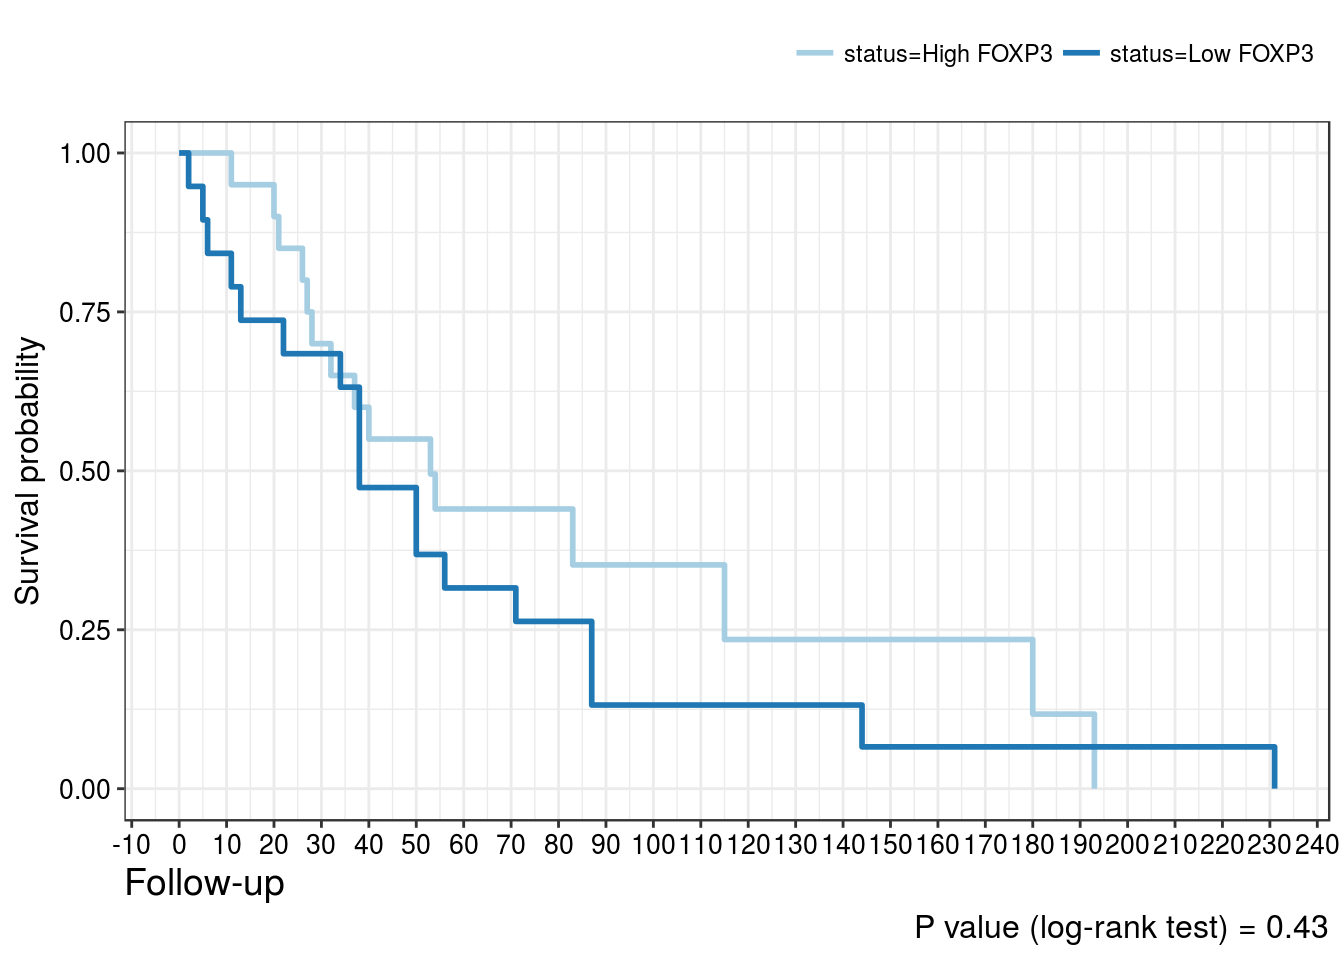
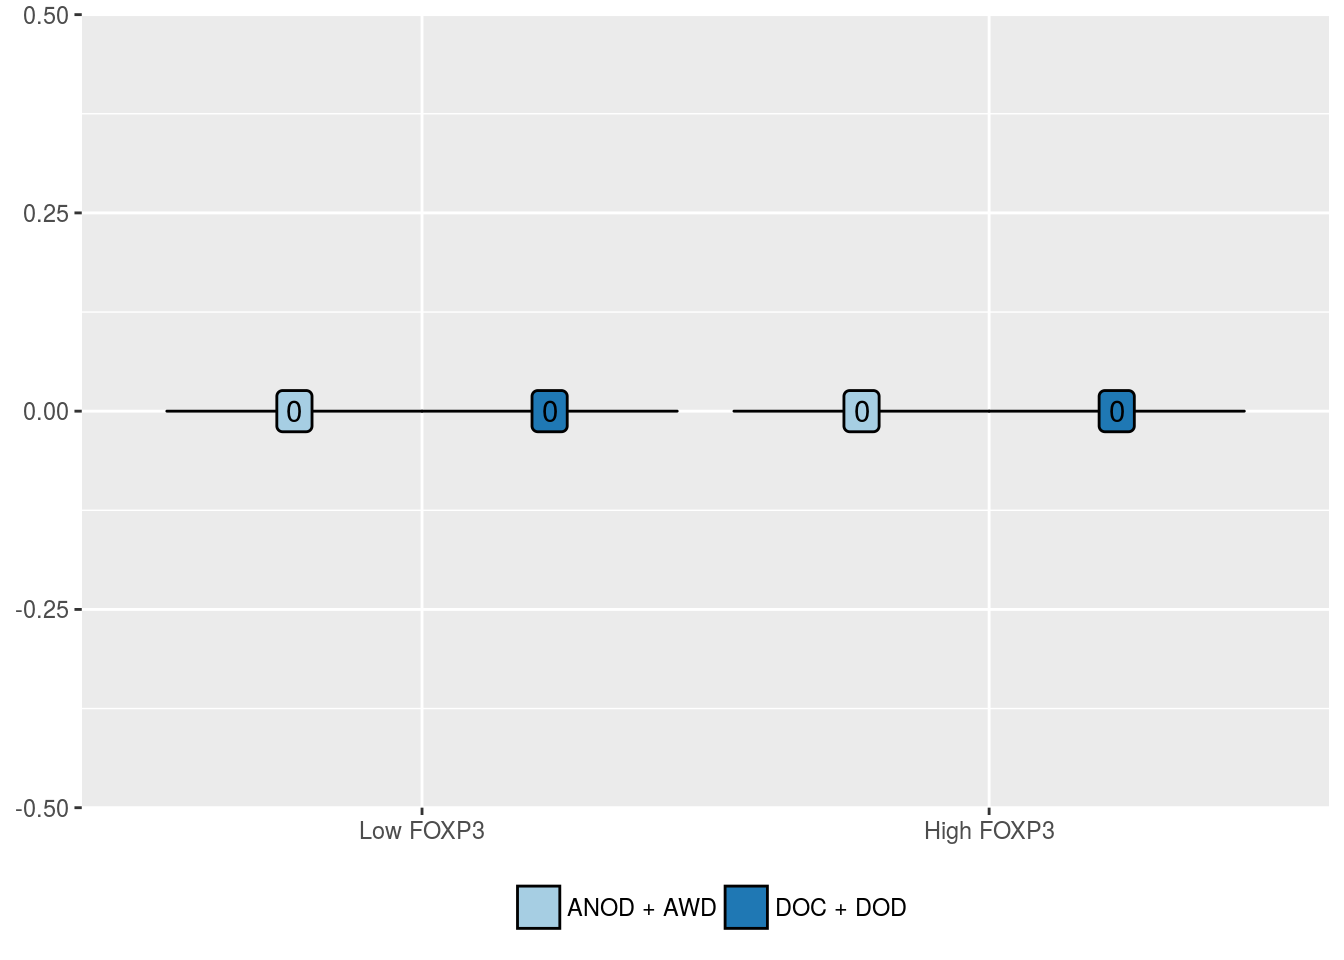
FOXP3 positivity in intratumoral lymphocytes
| ANOD + AWD (%) | DOC + DOD (%) | |
|---|---|---|
| Low FOXP3 | 2 (28.6) | 18 (54.5) |
| High FOXP3 | 5 (71.4) | 15 (45.5) |
| Predictors | Odds Ratio (95% CI) | P value | Hazard Ratio (95% CI) | P value |
|---|---|---|---|---|
| High FOXP3 positivity in intratumoral lymphocytes | 0.33 (0.043, 1.79) | 0.23 | 0.74 (0.37, 1.49) | 0.4 |
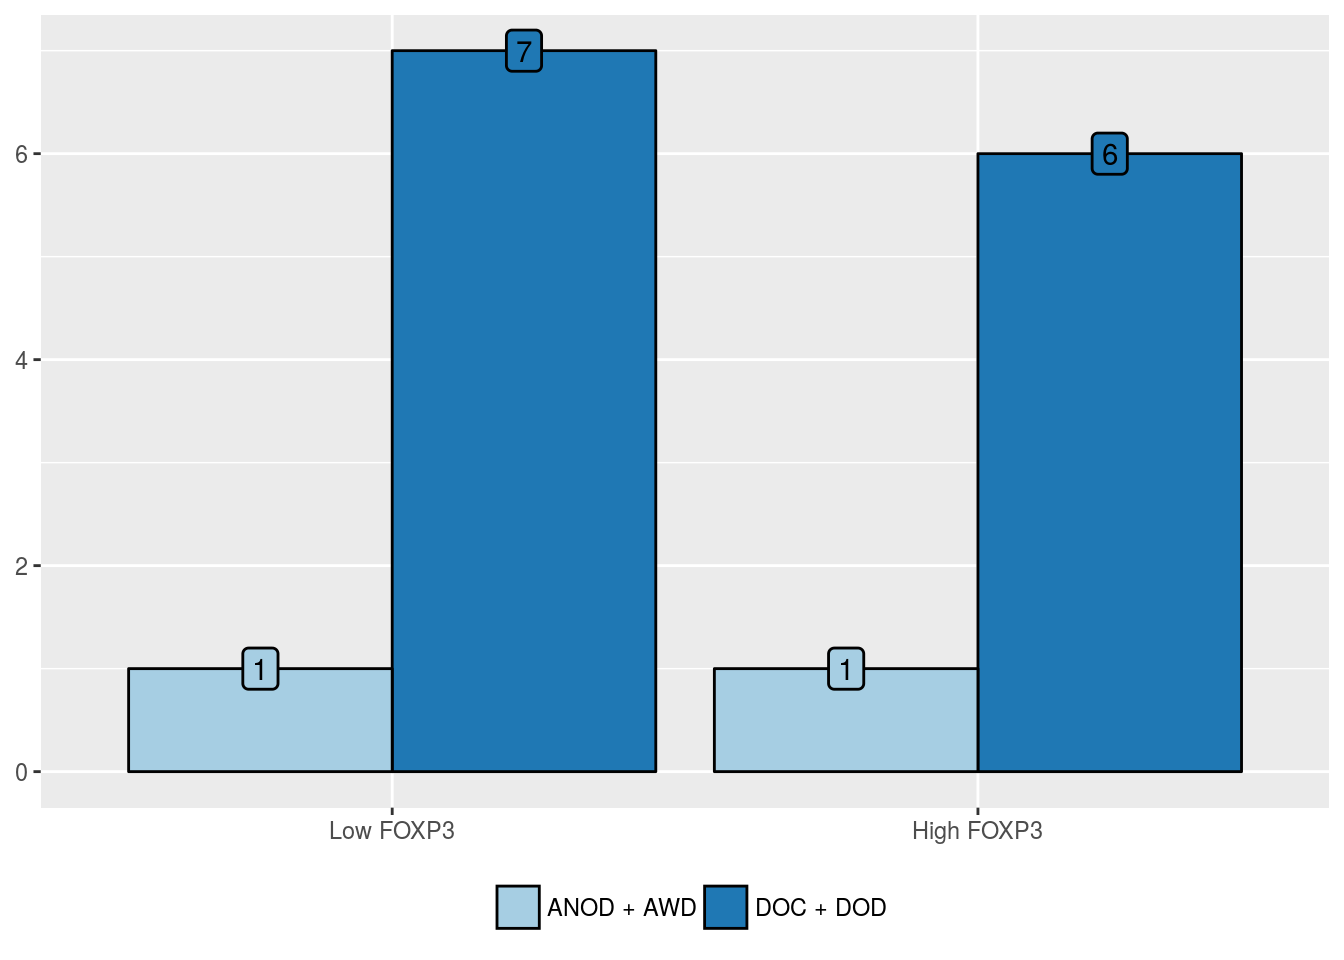
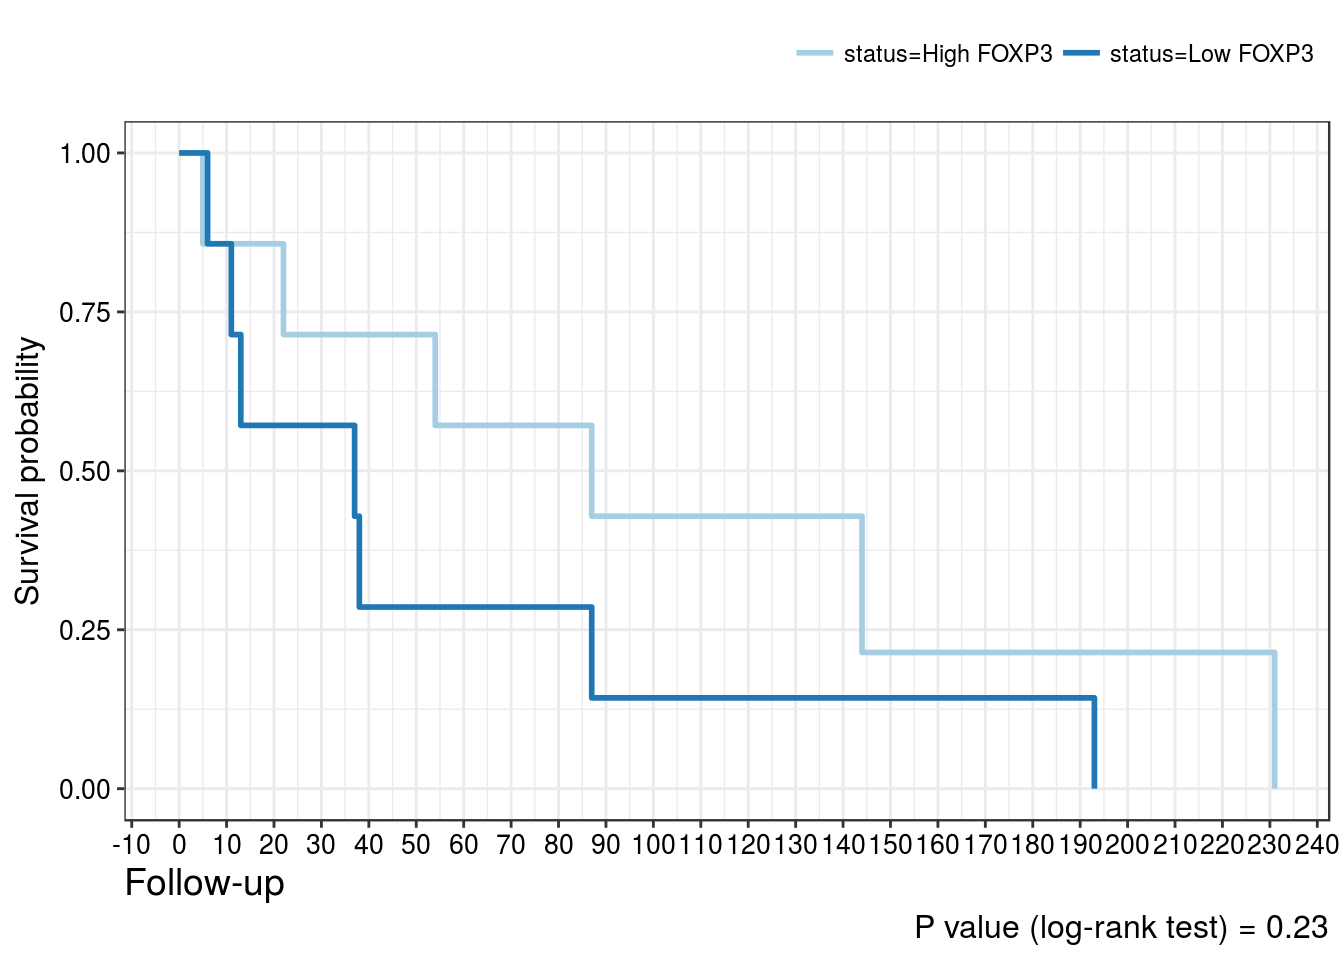
FOXP3 positivity in stromal lymphocytes
| ANOD + AWD (%) | DOC + DOD (%) | |
|---|---|---|
| Low FOXP3 | 1 (50) | 7 (53.8) |
| High FOXP3 | 1 (50) | 6 (46.2) |
| Predictors | Odds Ratio (95% CI) | P value | Hazard Ratio (95% CI) | P value |
|---|---|---|---|---|
| High FOXP3 positivity in stromal lymphocytes | 0.86 (0.029, 24.95) | 0.92 | 0.49 (0.15, 1.58) | 0.23 |
FOXP3 positivity in tumor cells
| ANOD + AWD (%) | DOC + DOD (%) | |
|---|---|---|
| Low FOXP3 | 0 (NaN) | 0 (NaN) |
| High FOXP3 | 0 (NaN) | 0 (NaN) |
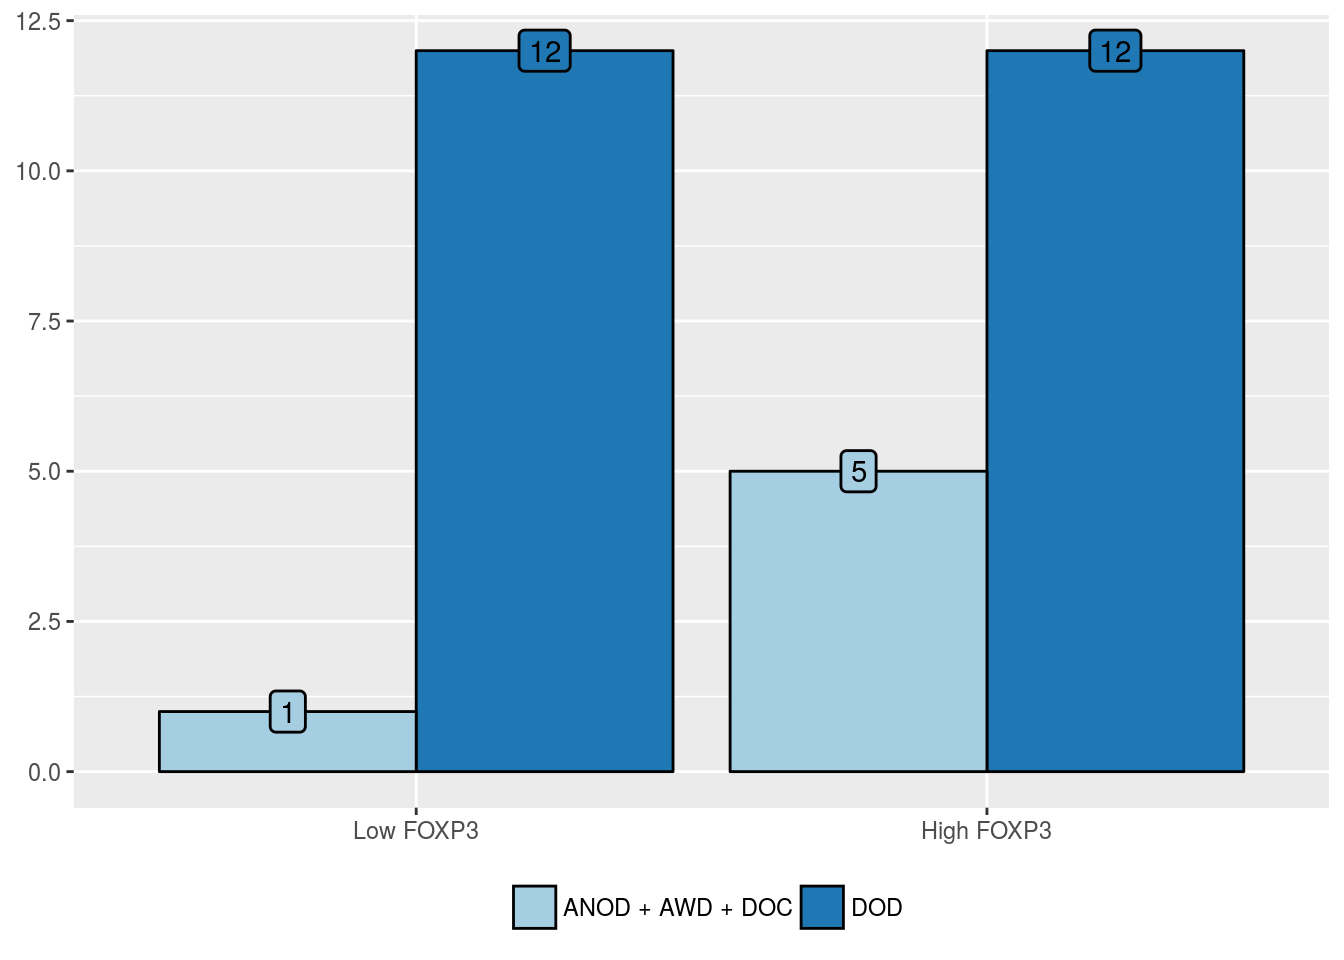
Cancer-related mortality
FOXP3 positivity in intratumoral lymphocytes
| ANOD + AWD + DOC (%) | DOD (%) | |
|---|---|---|
| Low FOXP3 | 1 (16.7) | 12 (50) |
| High FOXP3 | 5 (83.3) | 12 (50) |
| Predictors | Odds Ratio (95% CI) | P value | Hazard Ratio (95% CI) | P value |
|---|---|---|---|---|
| High FOXP3 positivity in intratumoral lymphocytes | 0.20 (0.0097, 1.49) | 0.17 | 0.46 (0.20, 1.06) | 0.07 |
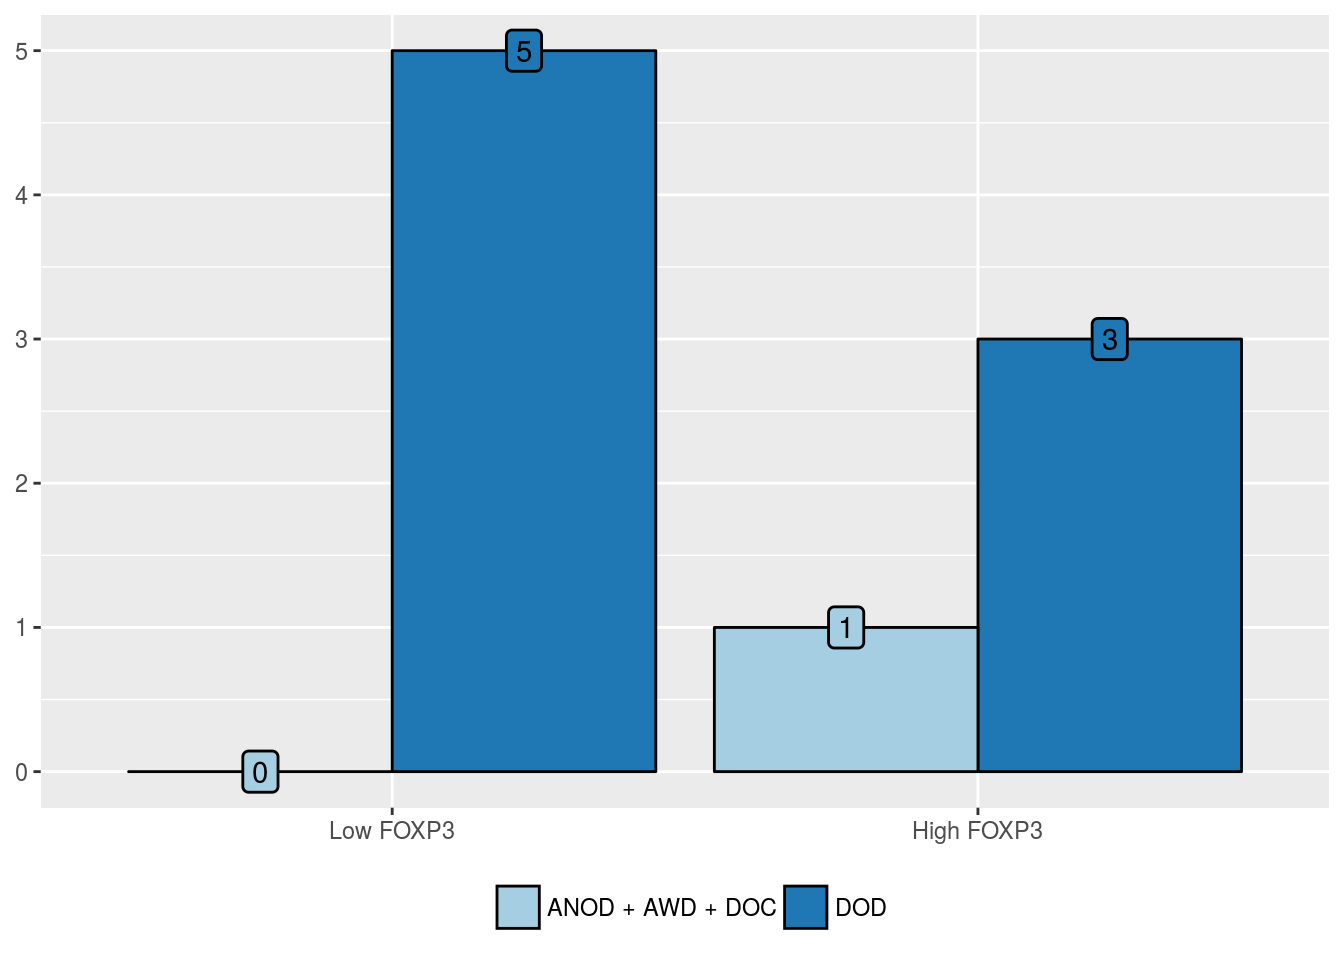
FOXP3 positivity in stromal lymphocytes
| ANOD + AWD + DOC (%) | DOD (%) | |
|---|---|---|
| Low FOXP3 | 0 (0) | 5 (62.5) |
| High FOXP3 | 1 (100) | 3 (37.5) |
| Predictors | Odds Ratio (95% CI) | P value | Hazard Ratio (95% CI) | P value |
|---|---|---|---|---|
| High FOXP3 positivity in stromal lymphocytes | 3.5e-09 (NA, Inf) | 1 | 0.38 (0.073, 2.03) | 0.24 |
FOXP3 positivity in tumor cells
| ANOD + AWD + DOC (%) | DOD (%) | |
|---|---|---|
| Low FOXP3 | 0 (NaN) | 0 (NaN) |
| High FOXP3 | 0 (NaN) | 0 (NaN) |
CD8 and Ki67 expression
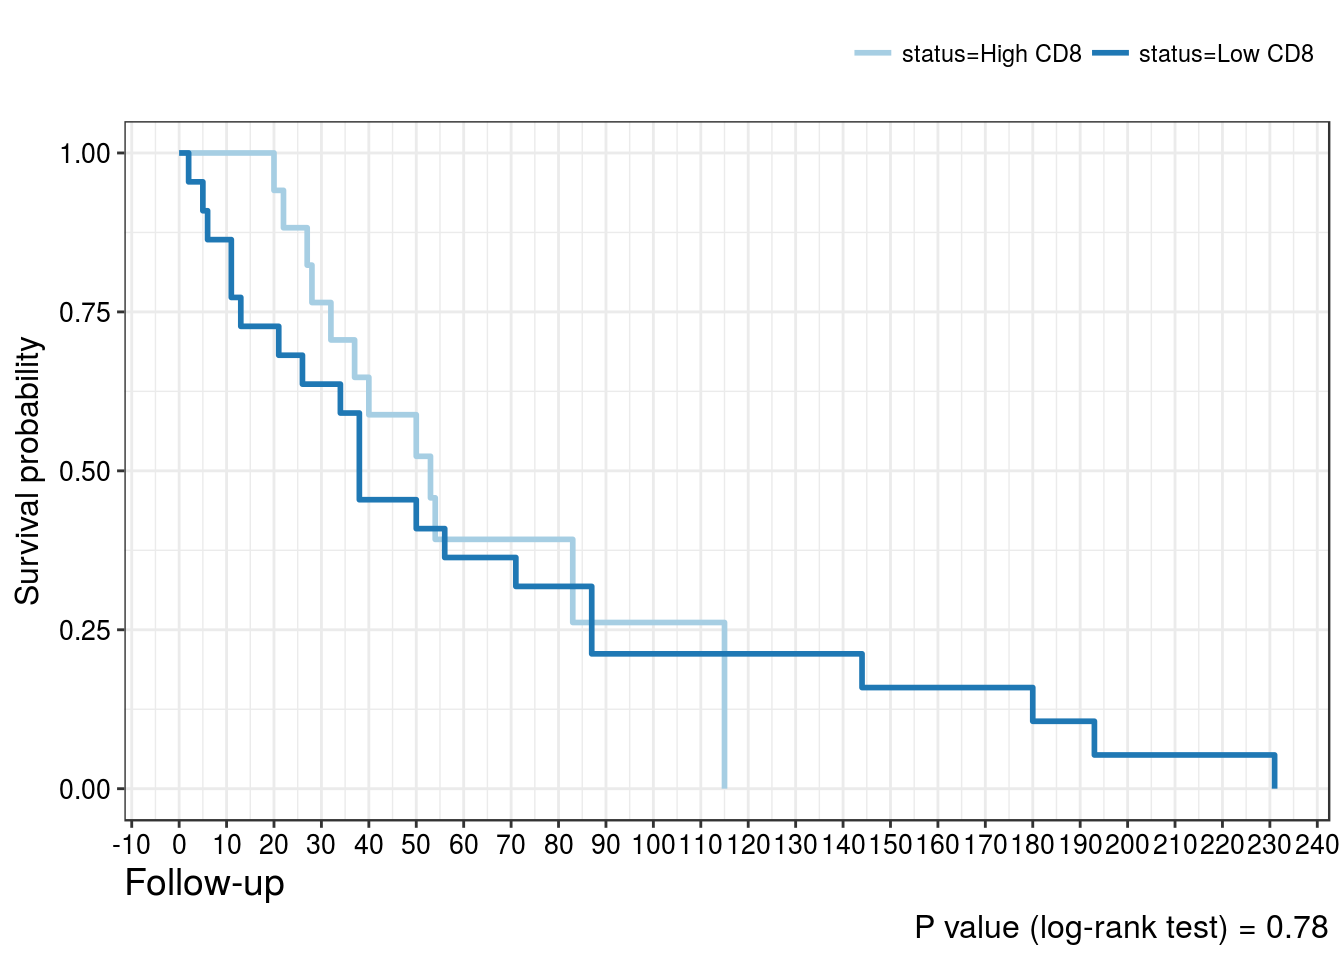
Overall mortality
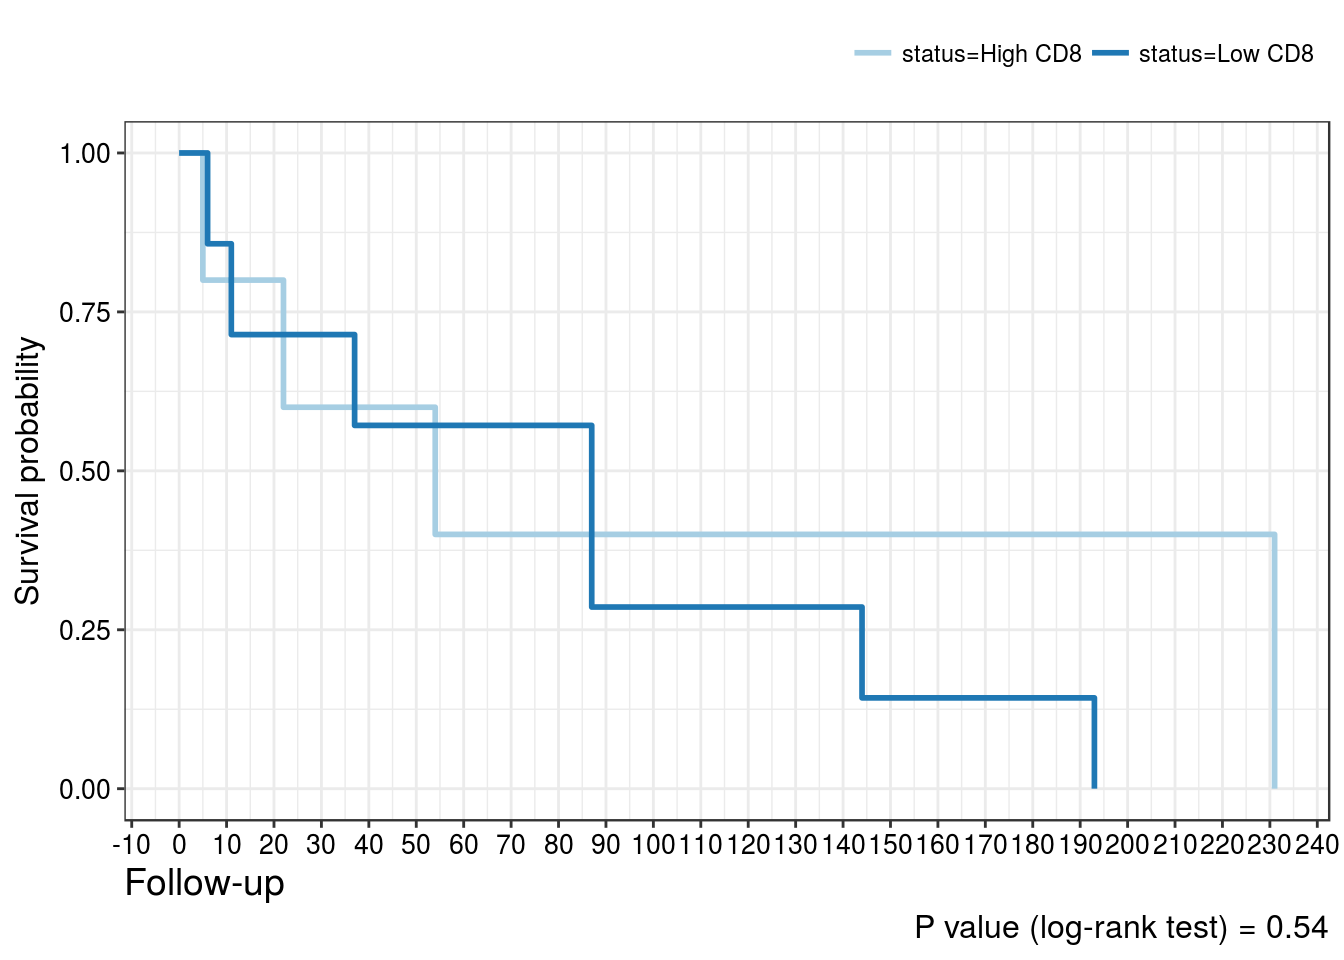
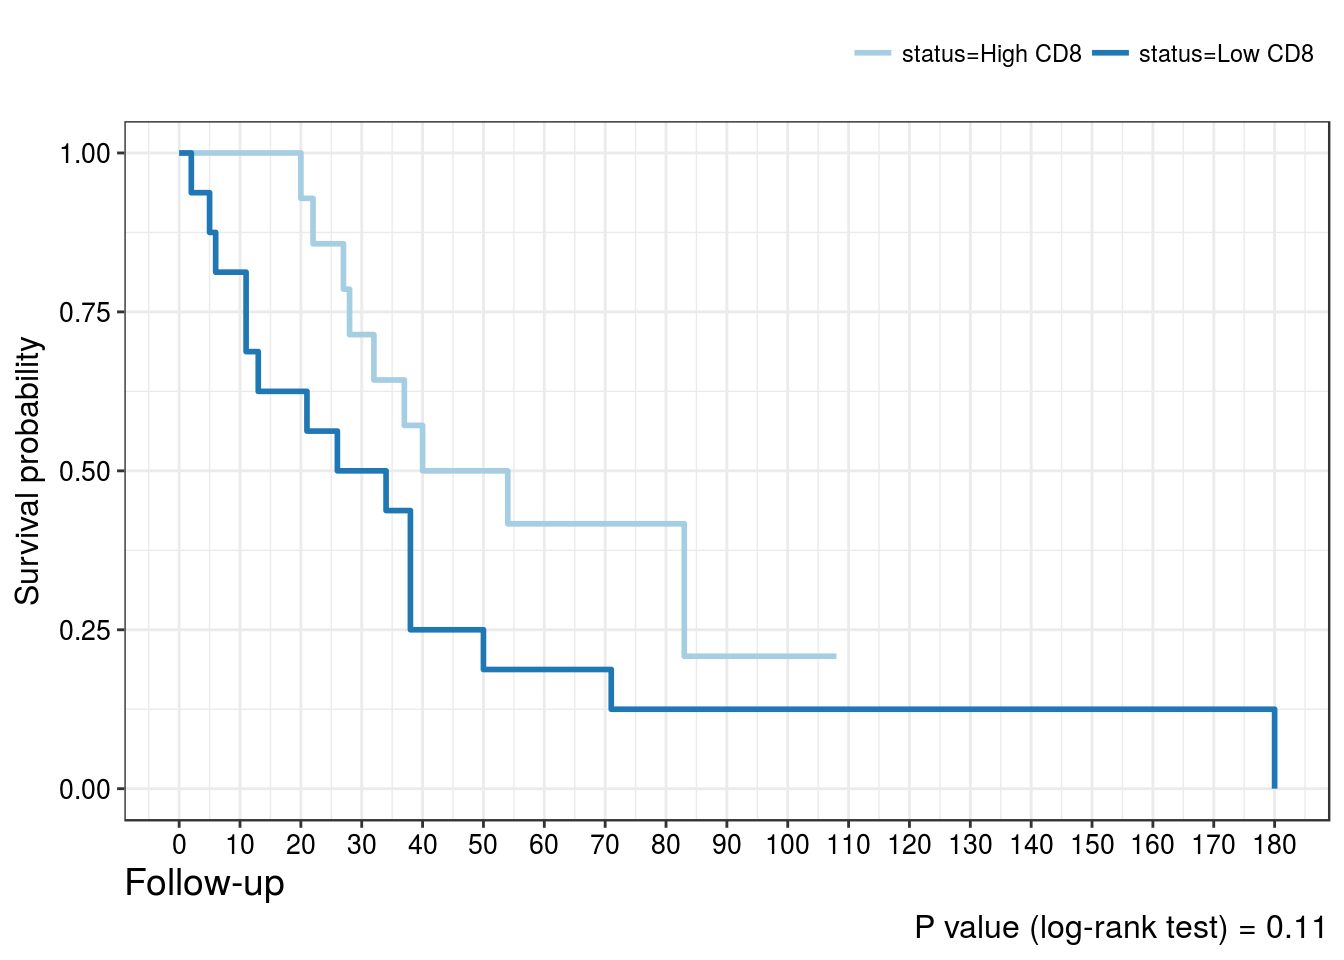
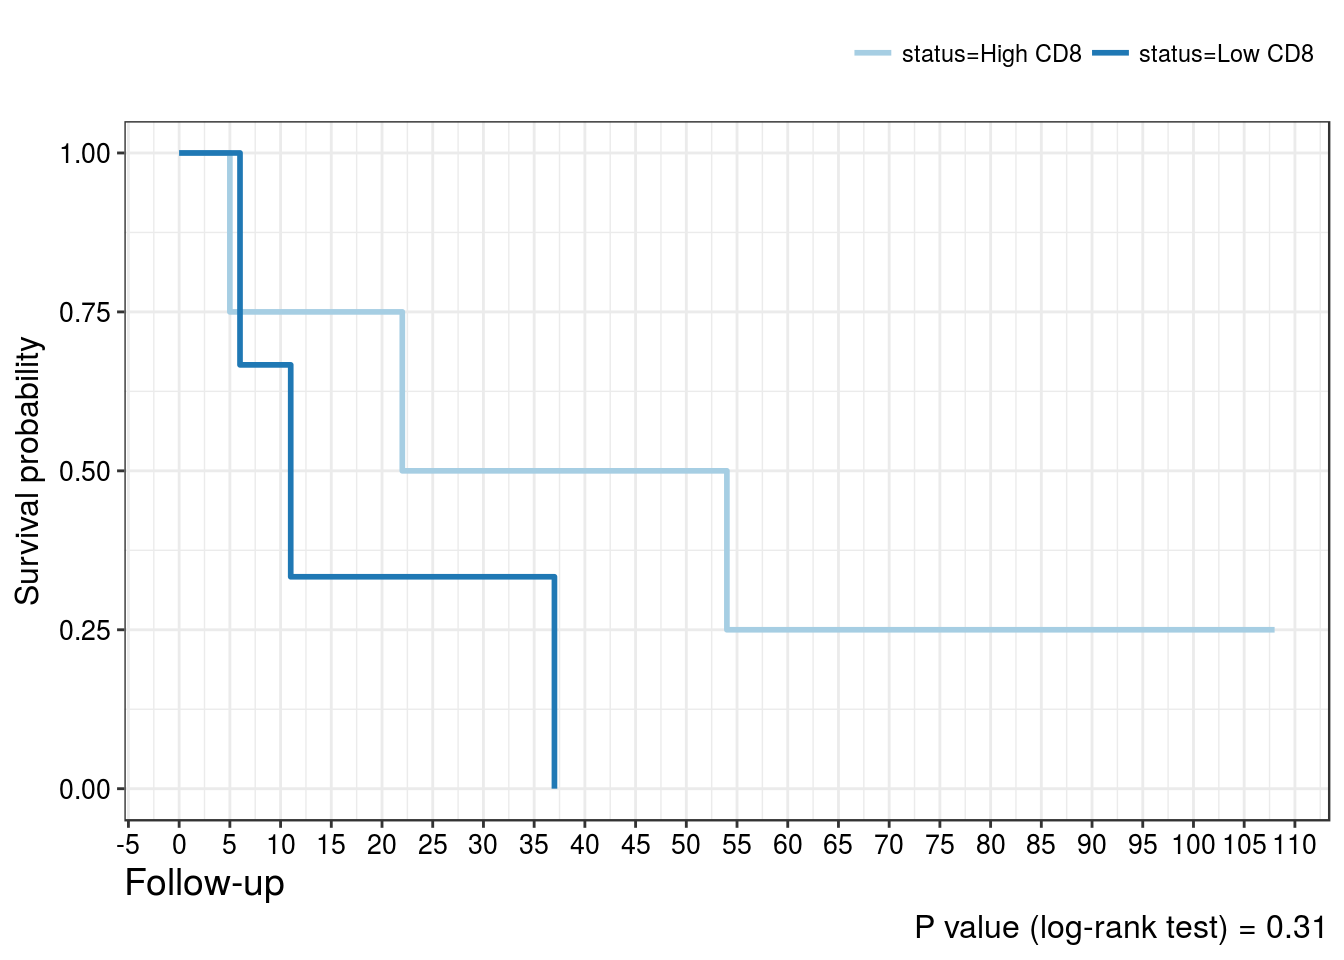
CD8 positivity in intratumoral lymphocytes
| ANOD + AWD (%) | DOC + DOD (%) | |
|---|---|---|
| Low CD8 | 2 (28.6) | 21 (63.6) |
| High CD8 | 5 (71.4) | 12 (36.4) |
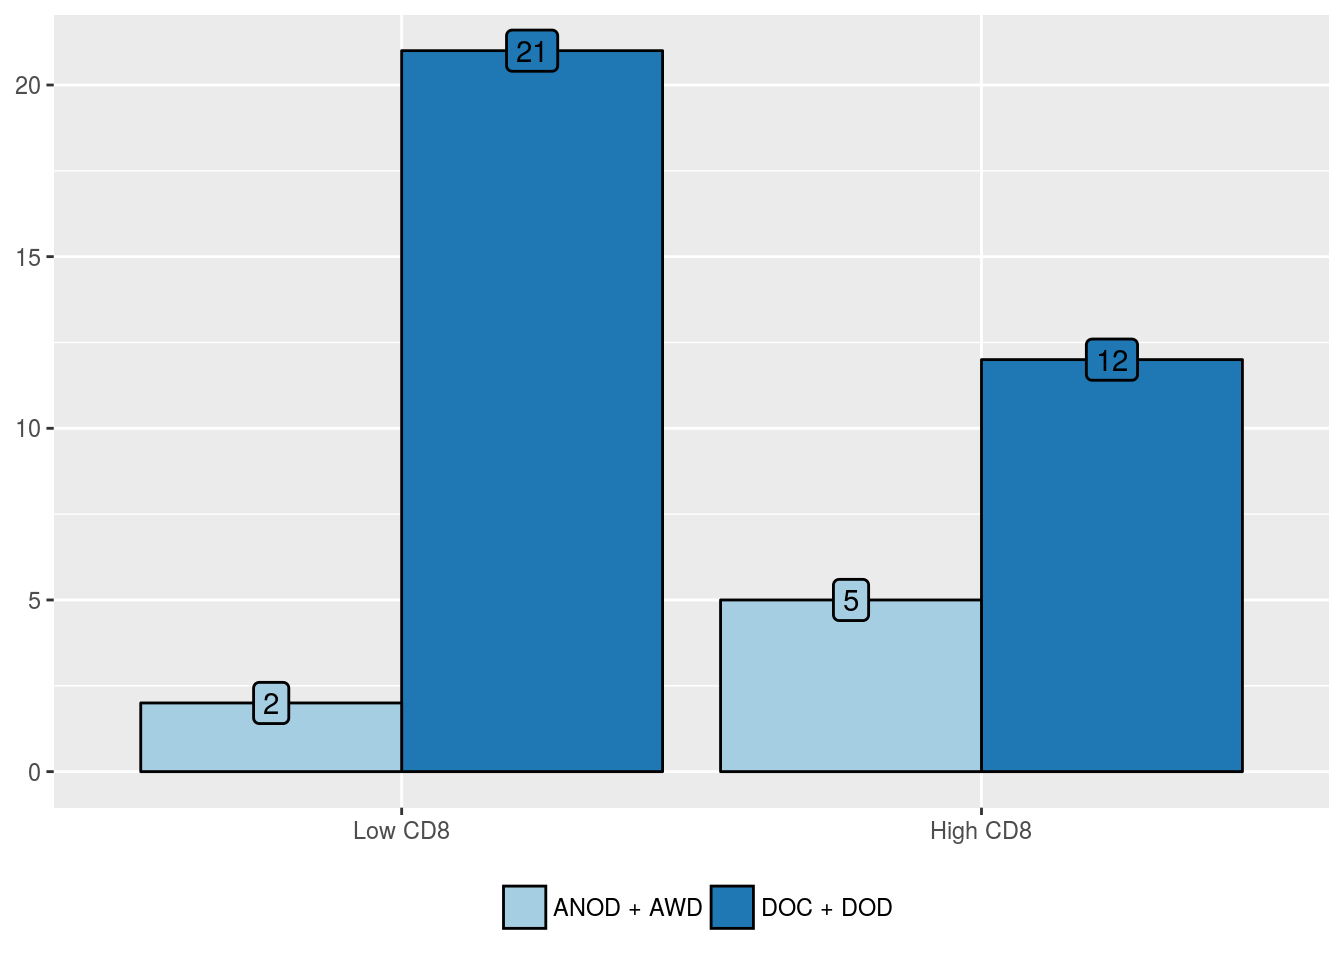
| Predictors | Odds Ratio (95% CI) | P value | Hazard Ratio (95% CI) | P value |
|---|---|---|---|---|
| High CD8 positivity in intratumoral lymphocytes | 0.23 (0.029, 1.24) | 0.11 | 0.89 (0.42, 1.88) | 0.75 |
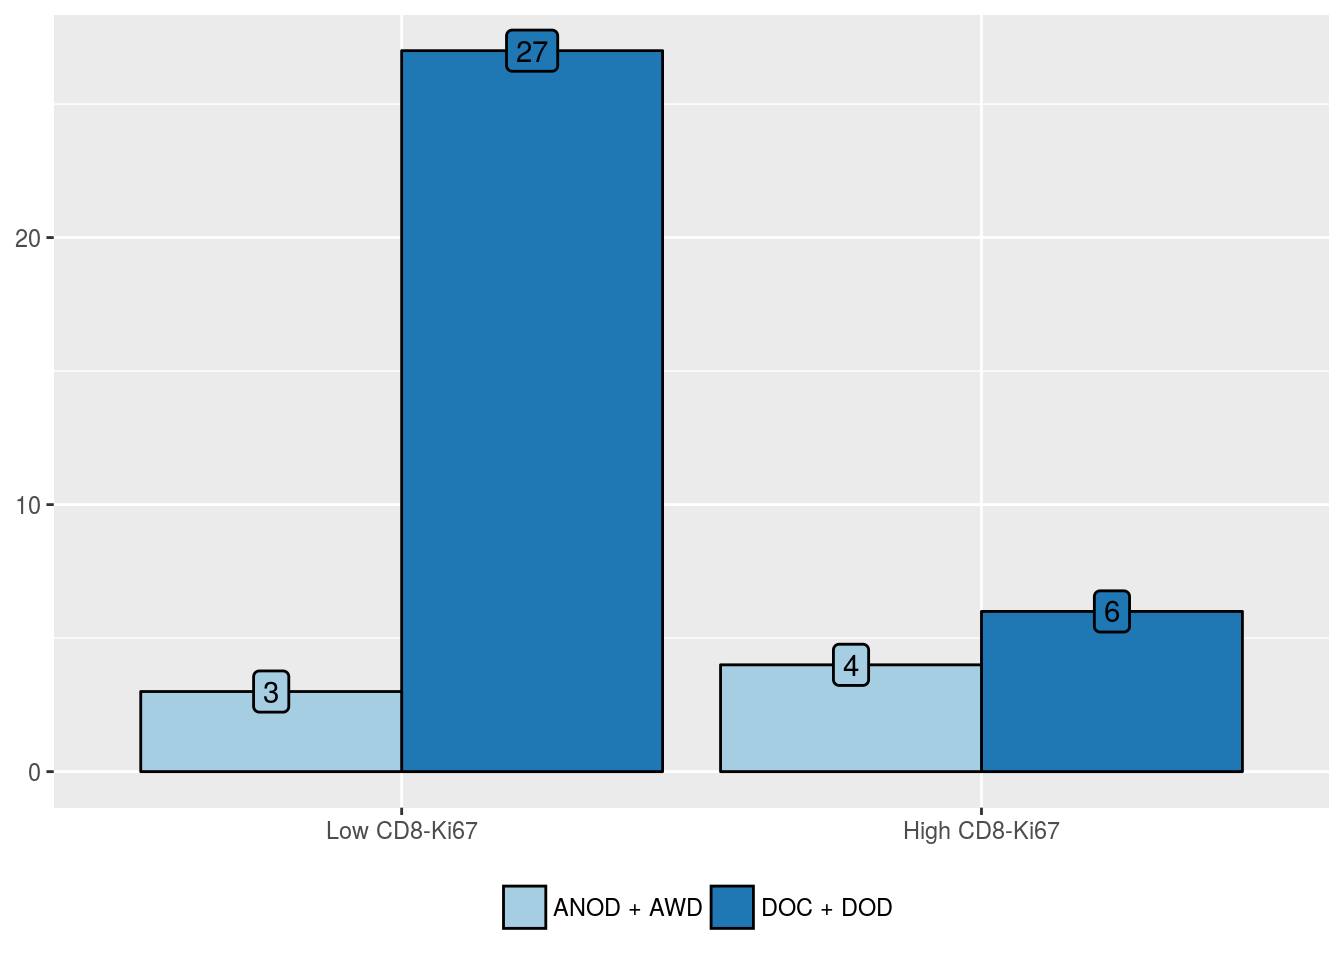
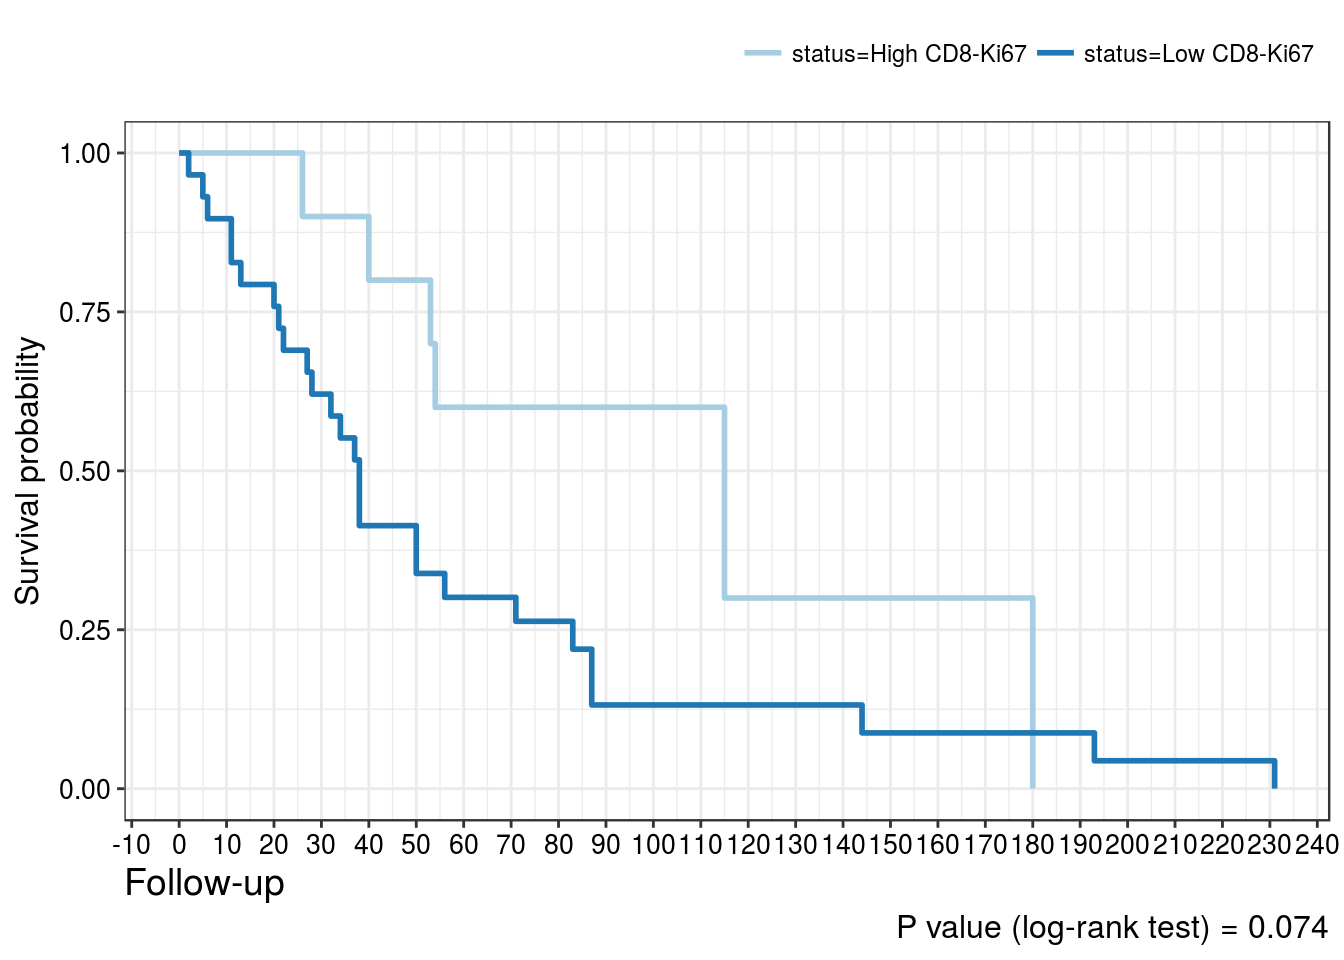
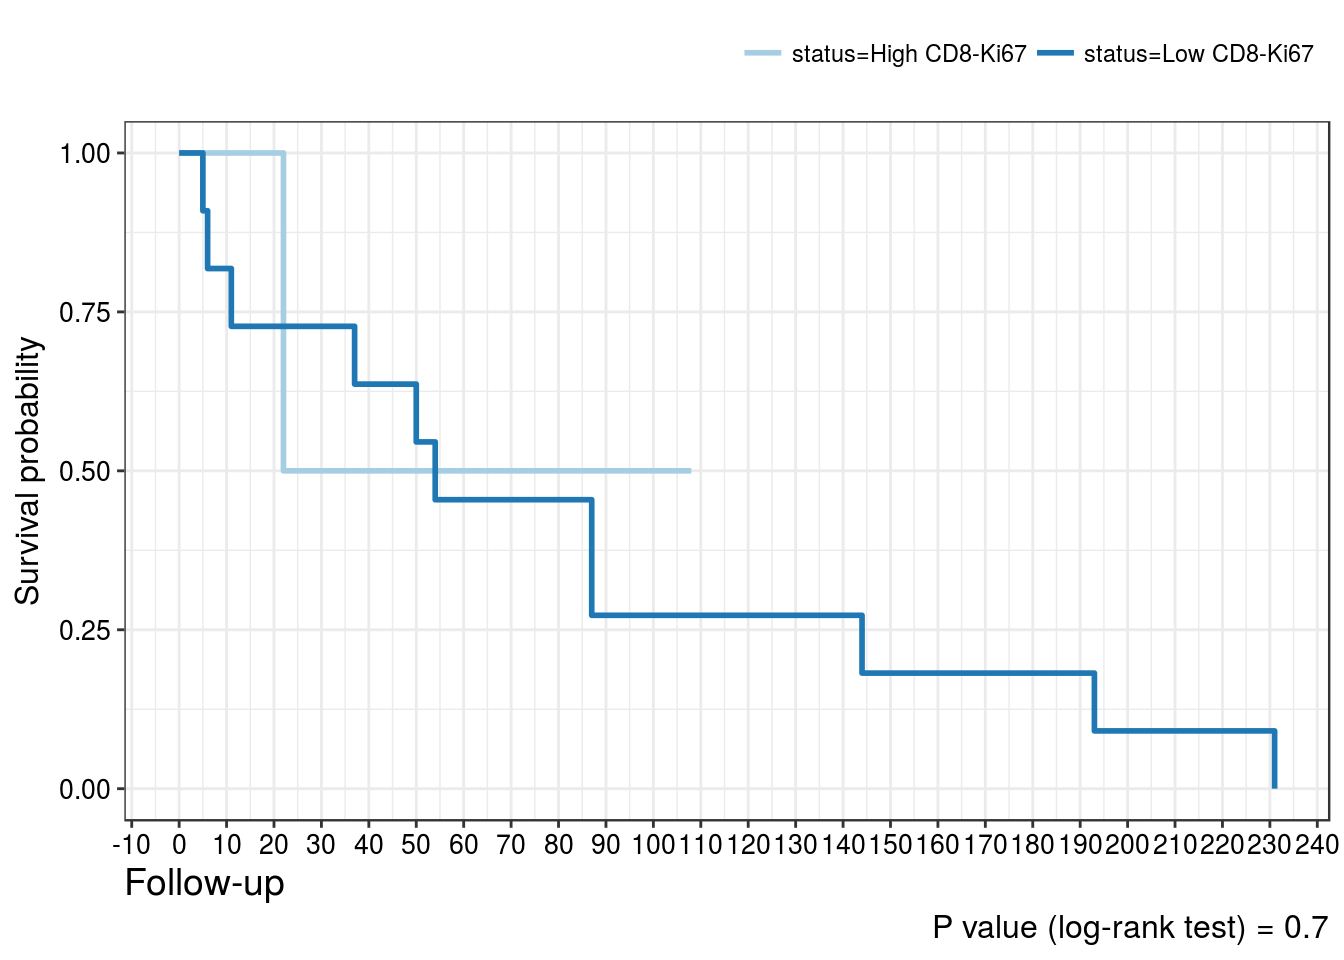
CD8-Ki67 positivity in intratumoral lymphocytes
| ANOD + AWD (%) | DOC + DOD (%) | |
|---|---|---|
| Low CD8-Ki67 | 3 (42.9) | 27 (81.8) |
| High CD8-Ki67 | 4 (57.1) | 6 (18.2) |
| Predictors | Odds Ratio (95% CI) | P value | Hazard Ratio (95% CI) | P value |
|---|---|---|---|---|
| High CD8-Ki67 positivity in intratumoral lymphocytes | 0.17 (0.026, 0.94) | 0.043 | 0.45 (0.18, 1.09) | 0.057 |
CD8 positivity in stromal lymphocytes
| ANOD + AWD (%) | DOC + DOD (%) | |
|---|---|---|
| Low CD8 | 0 (0) | 7 (63.6) |
| High CD8 | 1 (100) | 4 (36.4) |

| Predictors | Odds Ratio (95% CI) | P value | Hazard Ratio (95% CI) | P value |
|---|---|---|---|---|
| High CD8 positivity in stromal lymphocytes | 4.7e-09 (NA, Inf) | 1 | 0.64 (0.16, 2.50) | 0.51 |
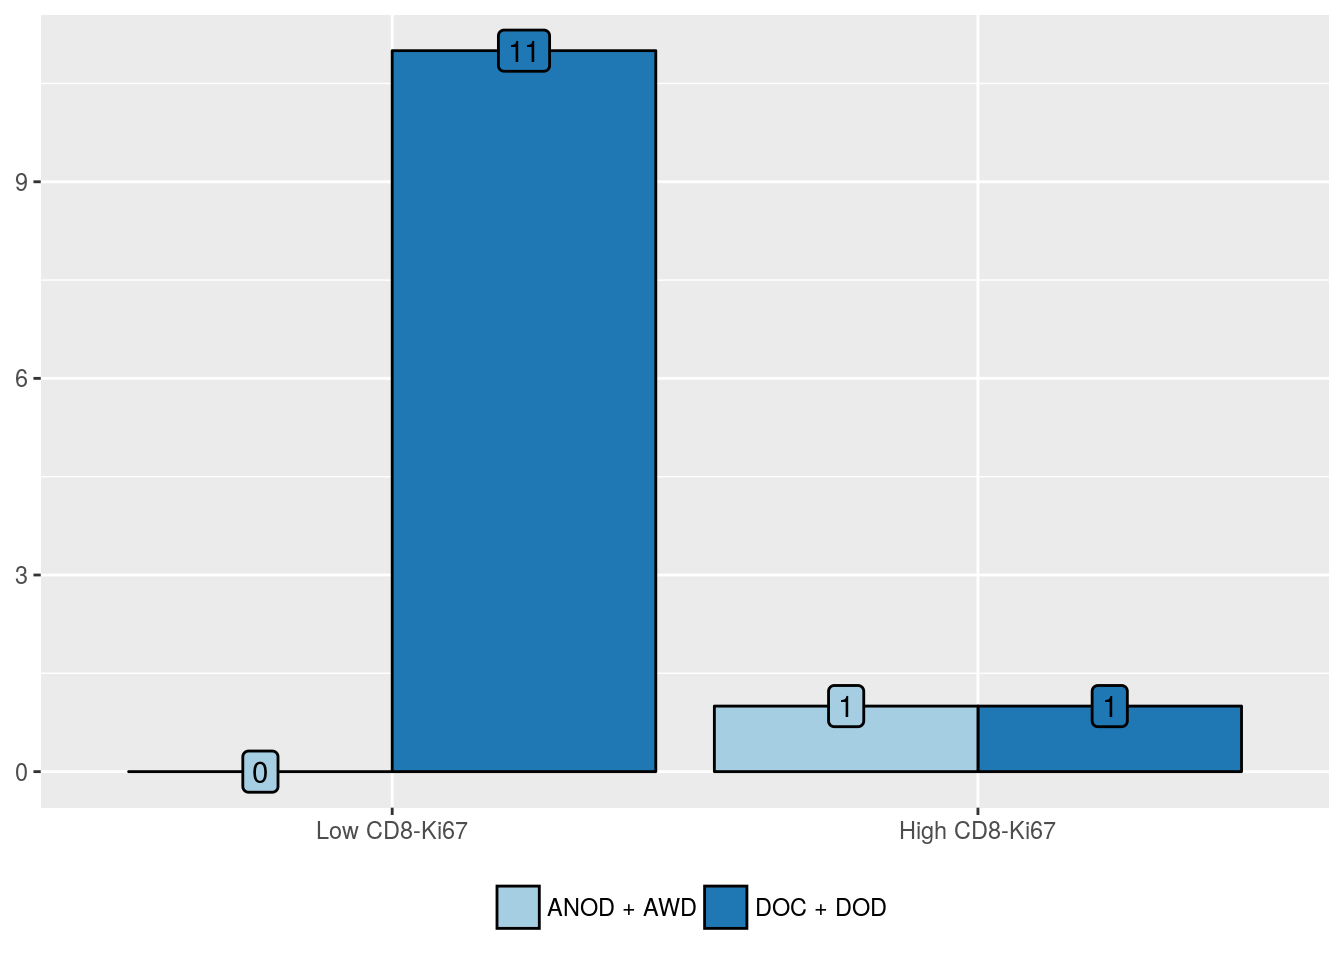
CD8-Ki67 positivity in stromal lymphocytes
| ANOD + AWD (%) | DOC + DOD (%) | |
|---|---|---|
| Low CD8-Ki67 | 0 (0) | 11 (91.7) |
| High CD8-Ki67 | 1 (100) | 1 (8.3) |
| Predictors | Odds Ratio (95% CI) | P value | Hazard Ratio (95% CI) | P value |
|---|---|---|---|---|
| High CD8-Ki67 positivity in stromal lymphocytes | 4.3e-10 (NA, Inf) | 1 | 0.65 (0.081, 5.23) | 0.67 |
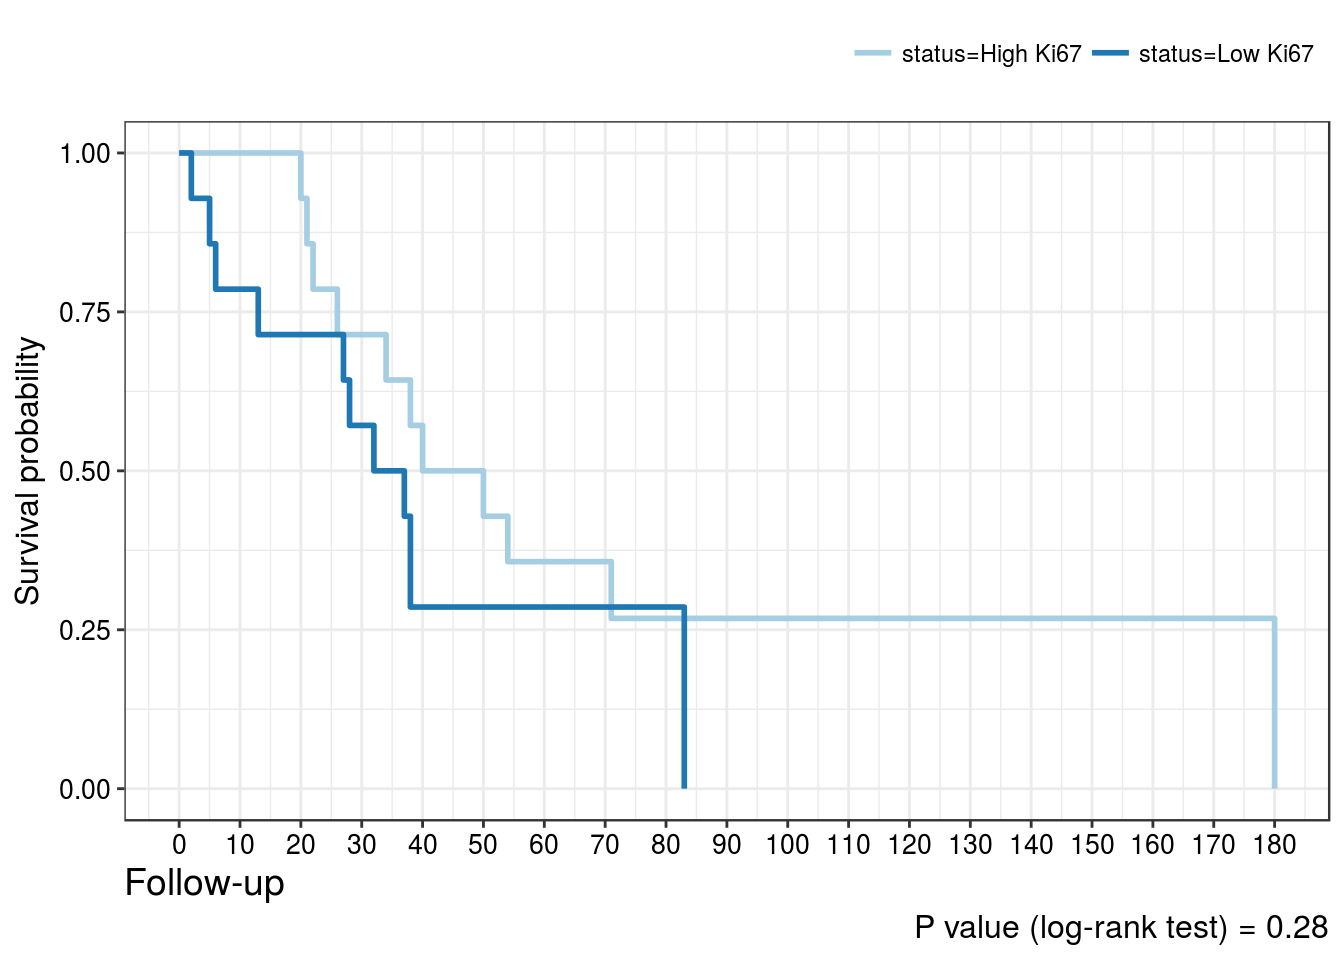
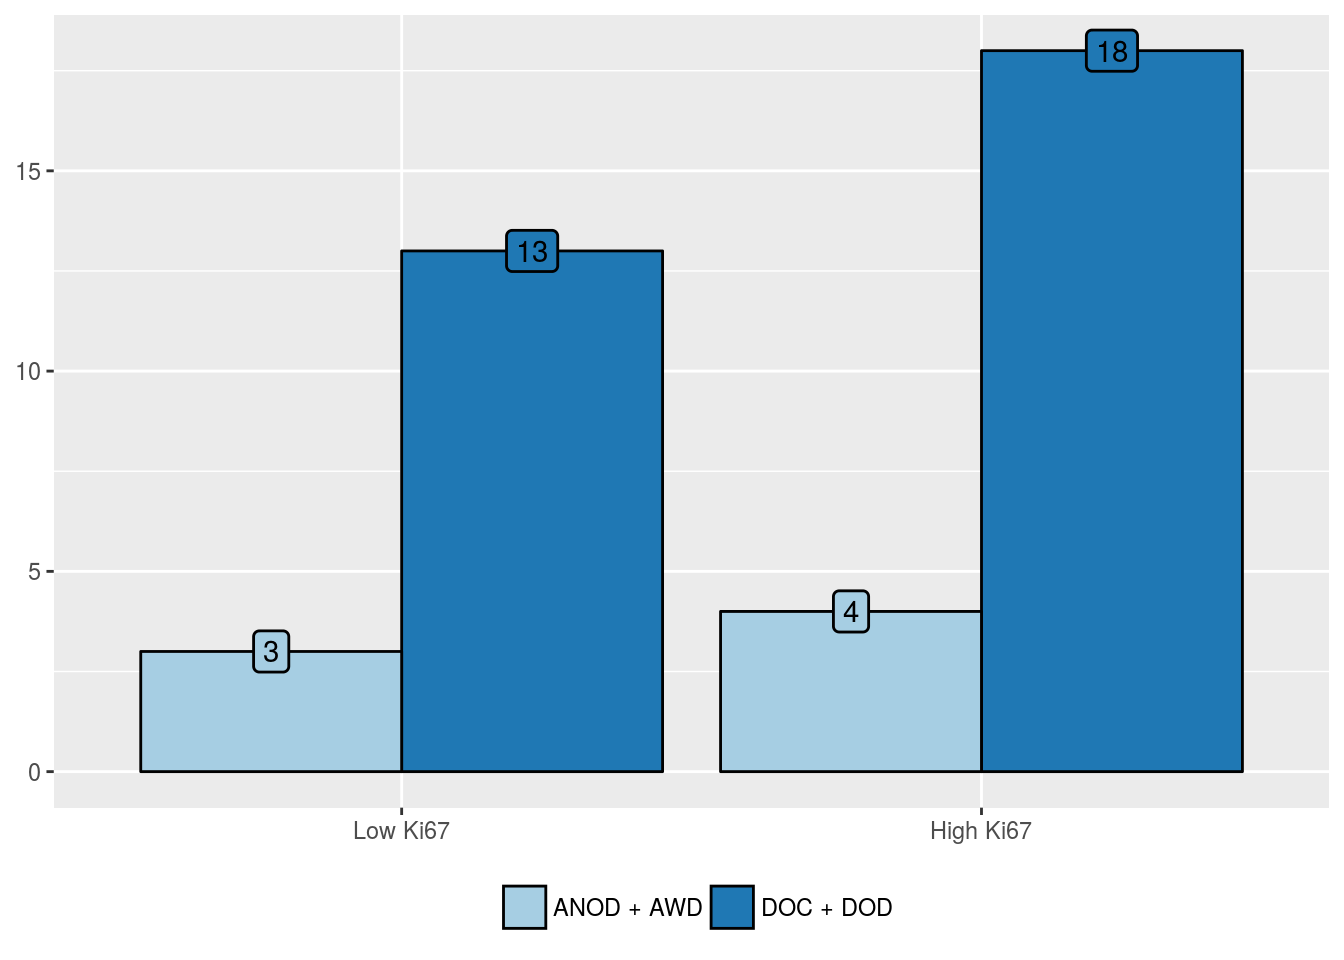
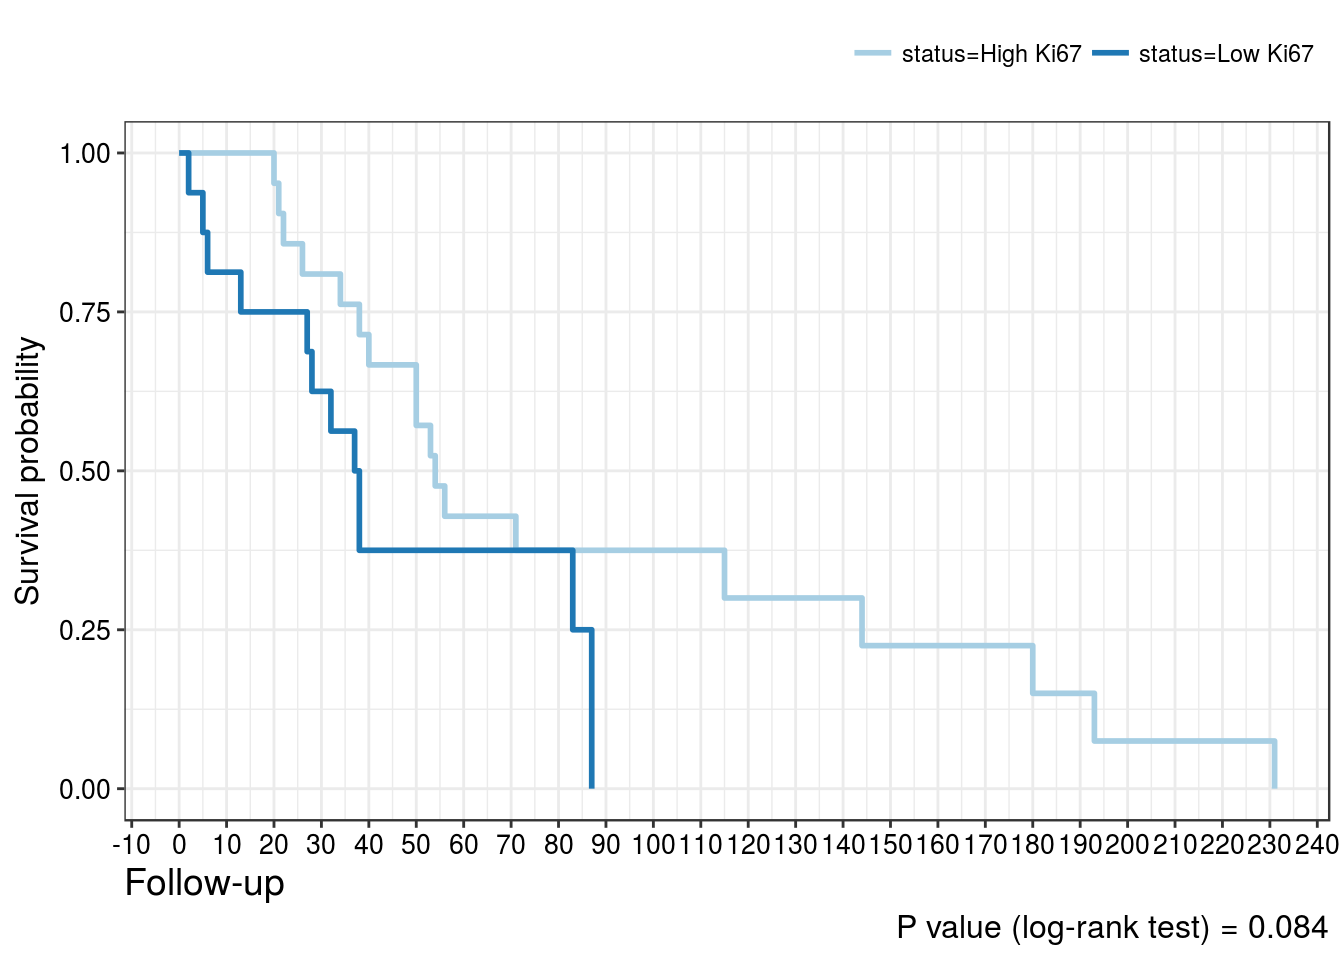
Ki67 positivity in intratumoral lymphocytes
| ANOD + AWD (%) | DOC + DOD (%) | |
|---|---|---|
| Low Ki67 | 3 (42.9) | 13 (41.9) |
| High Ki67 | 4 (57.1) | 18 (58.1) |
| Predictors | Odds Ratio (95% CI) | P value | Hazard Ratio (95% CI) | P value |
|---|---|---|---|---|
| High Ki67 positivity in intratumoral lymphocytes | 1.04 (0.18, 5.51) | 0.96 | 0.50 (0.23, 1.09) | 0.084 |
Cancer-related
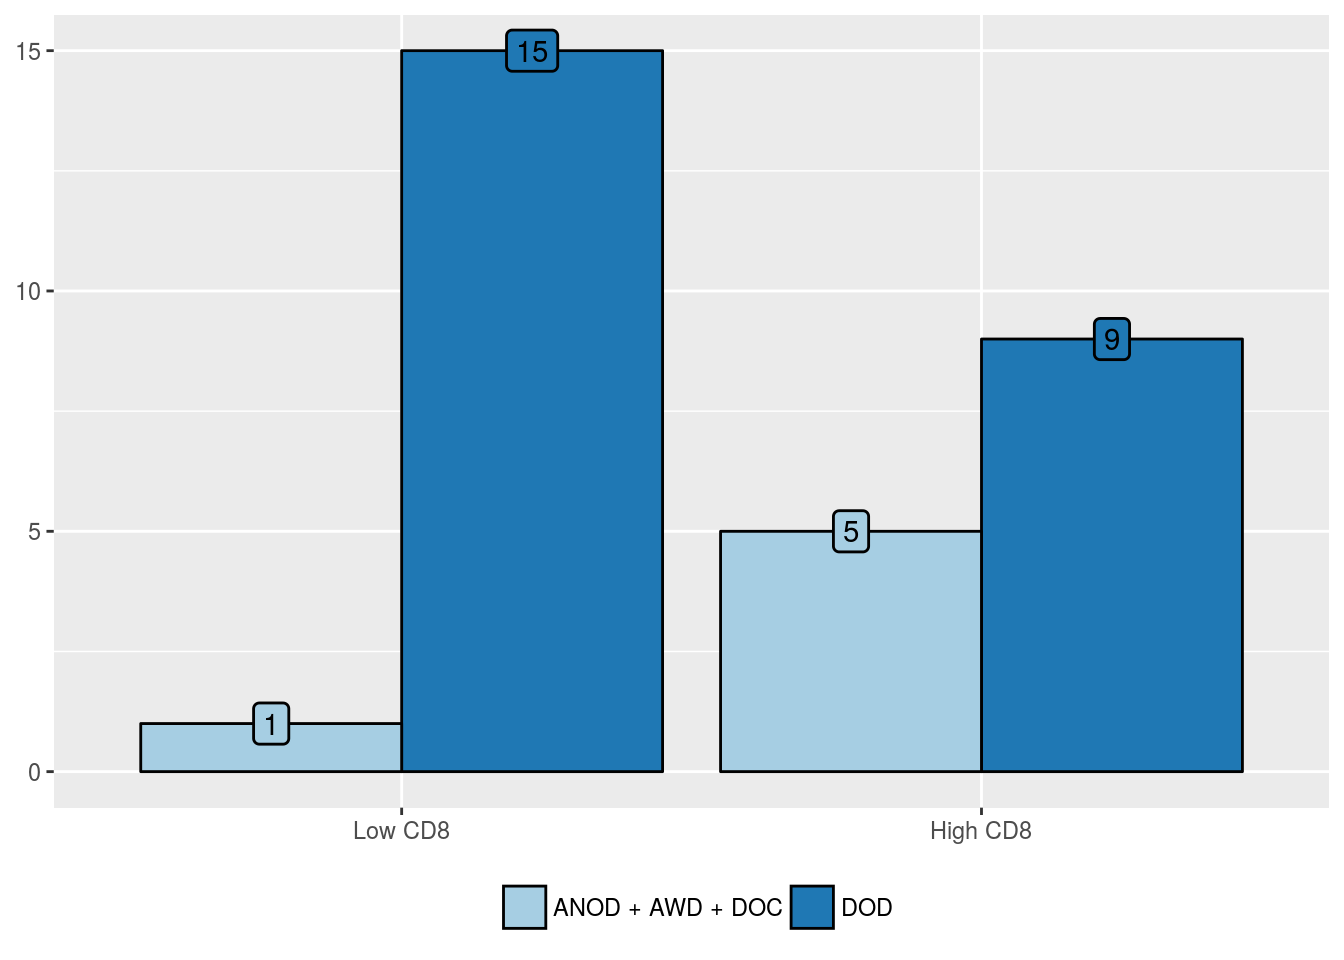
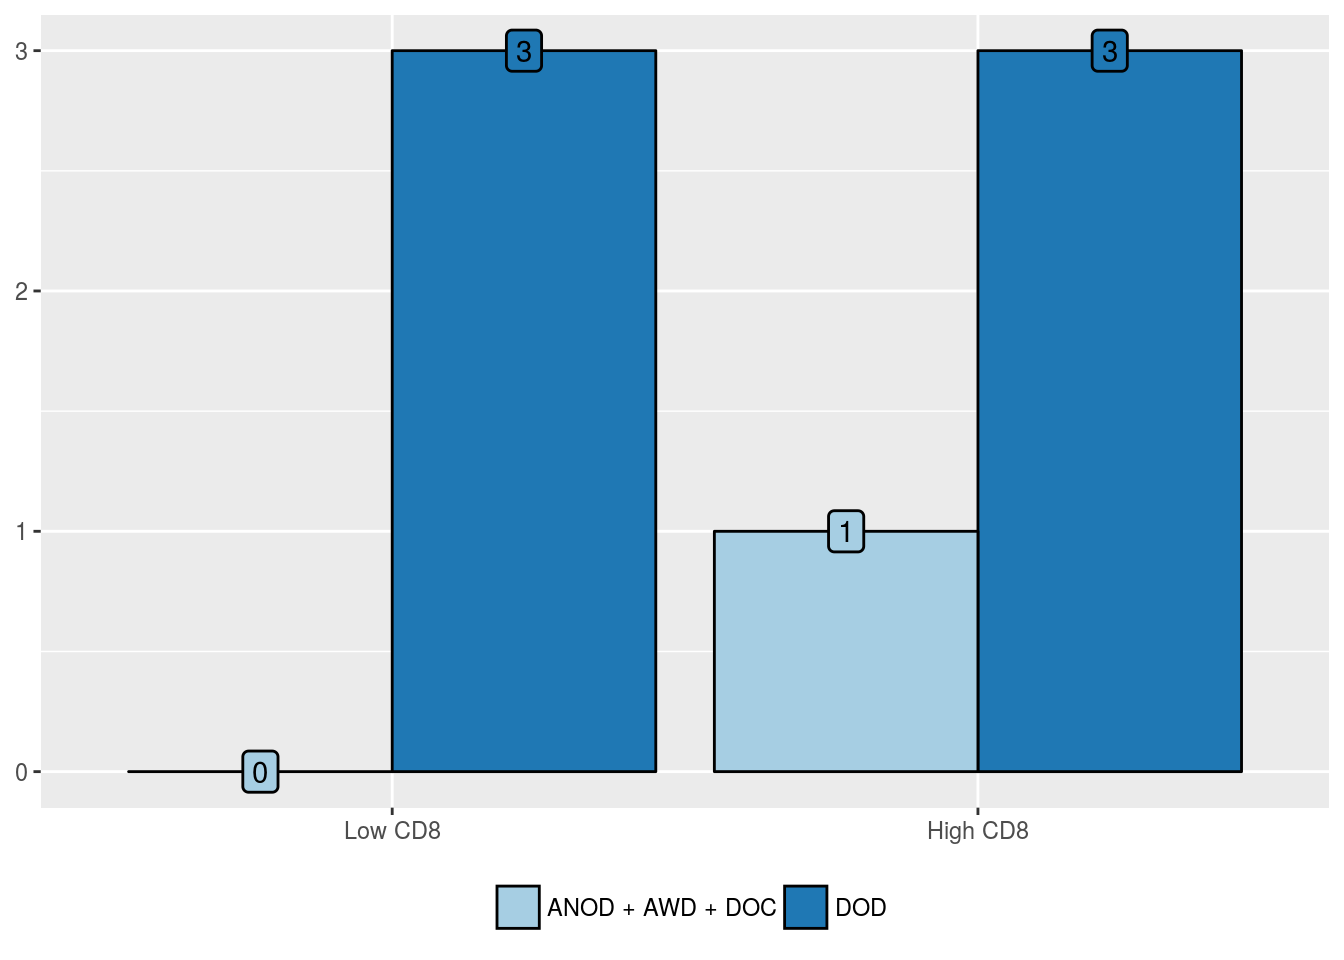
CD8 positivity in intratumoral lymphocytes
| ANOD + AWD + DOC (%) | DOD (%) | |
|---|---|---|
| Low CD8 | 1 (16.7) | 15 (62.5) |
| High CD8 | 5 (83.3) | 9 (37.5) |
| Predictors | Odds Ratio (95% CI) | P value | Hazard Ratio (95% CI) | P value |
|---|---|---|---|---|
| High CD8 positivity in intratumoral lymphocytes | 0.12 (0.0058, 0.90) | 0.071 | 0.50 (0.21, 1.15) | 0.098 |
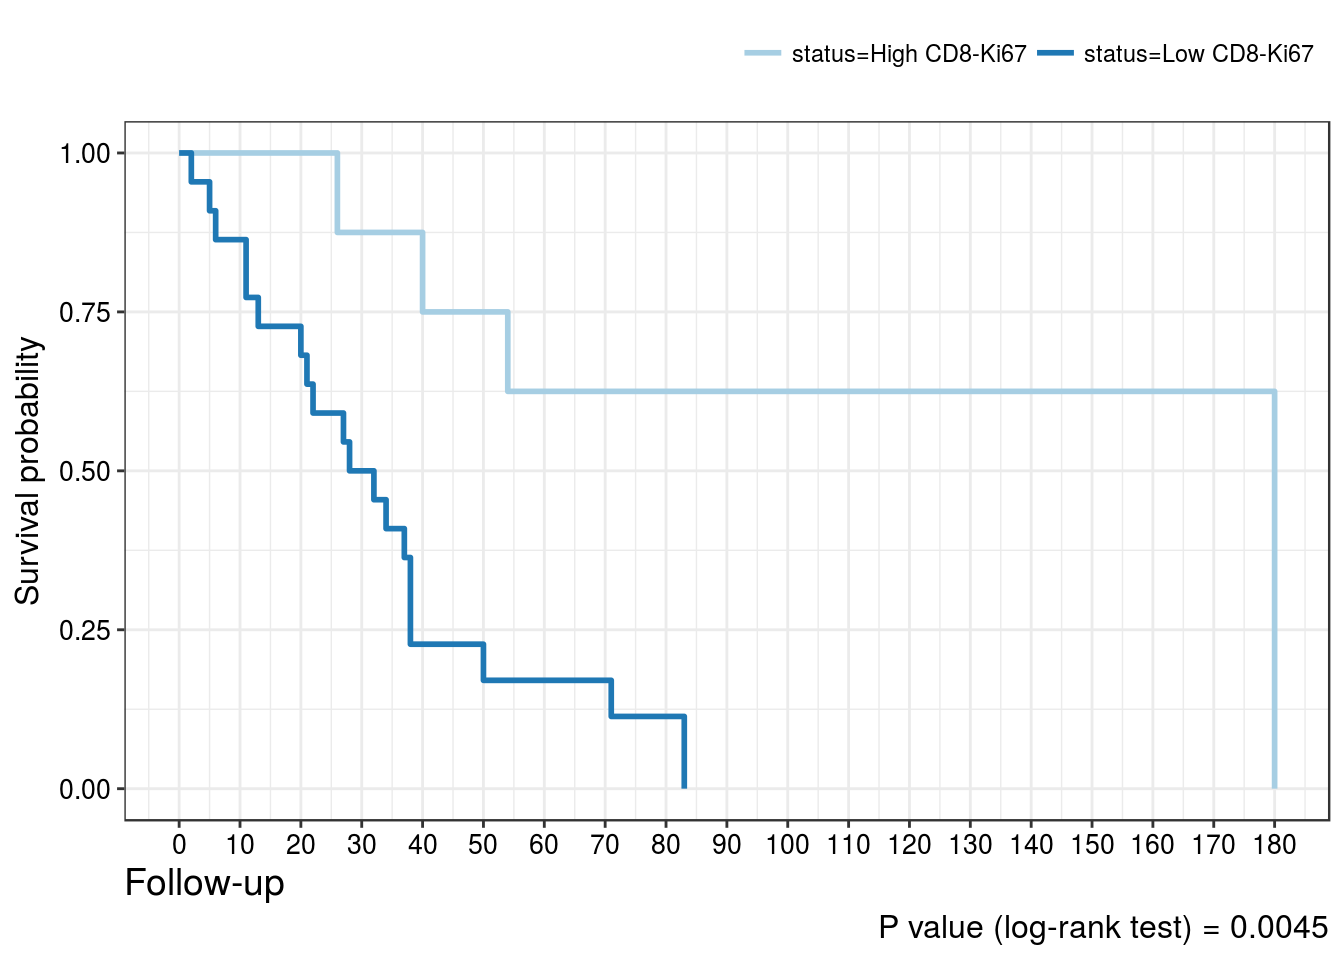
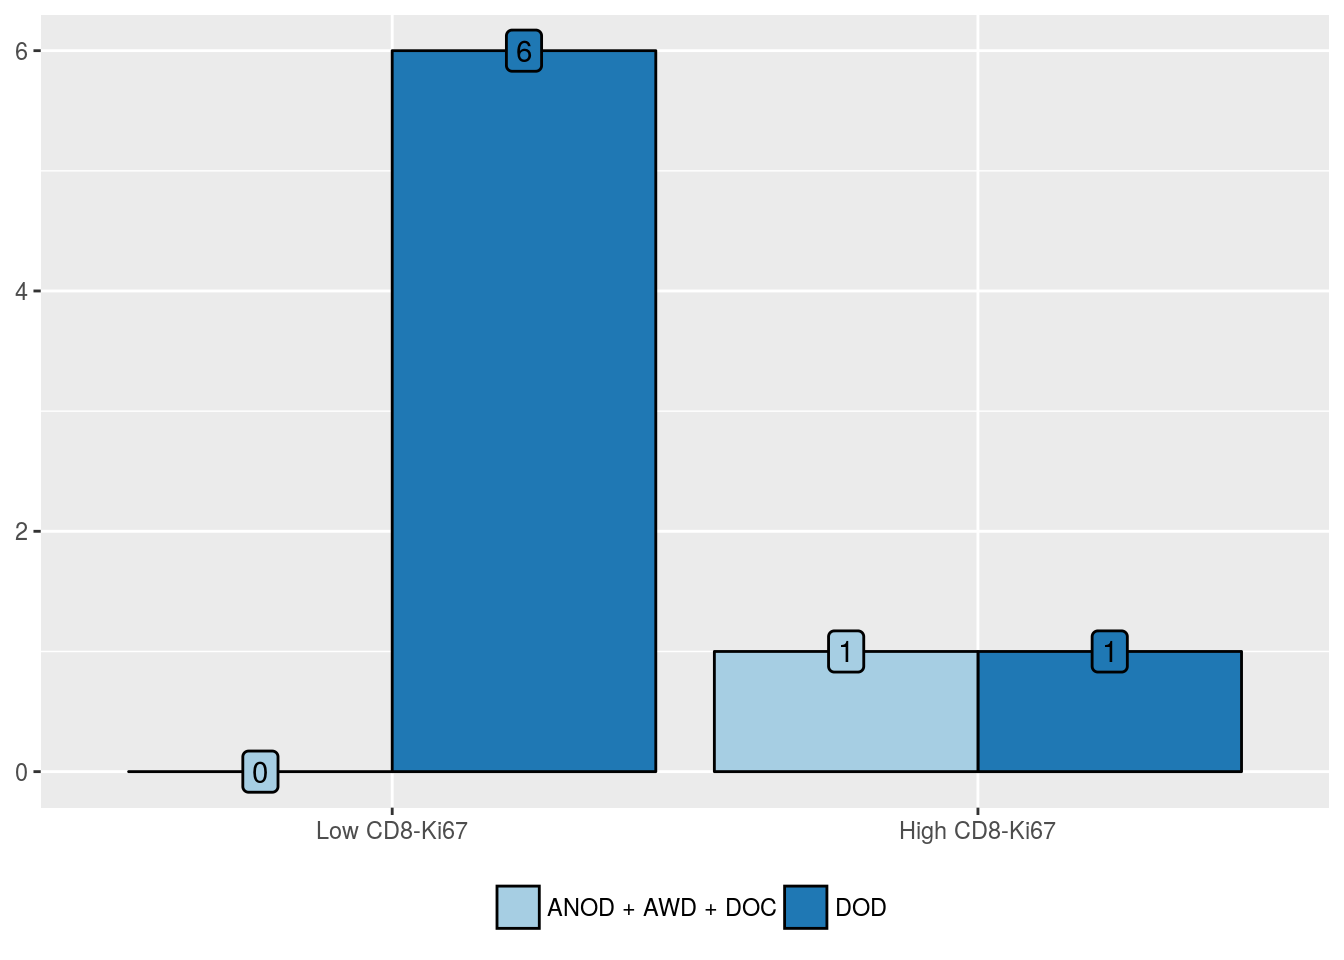
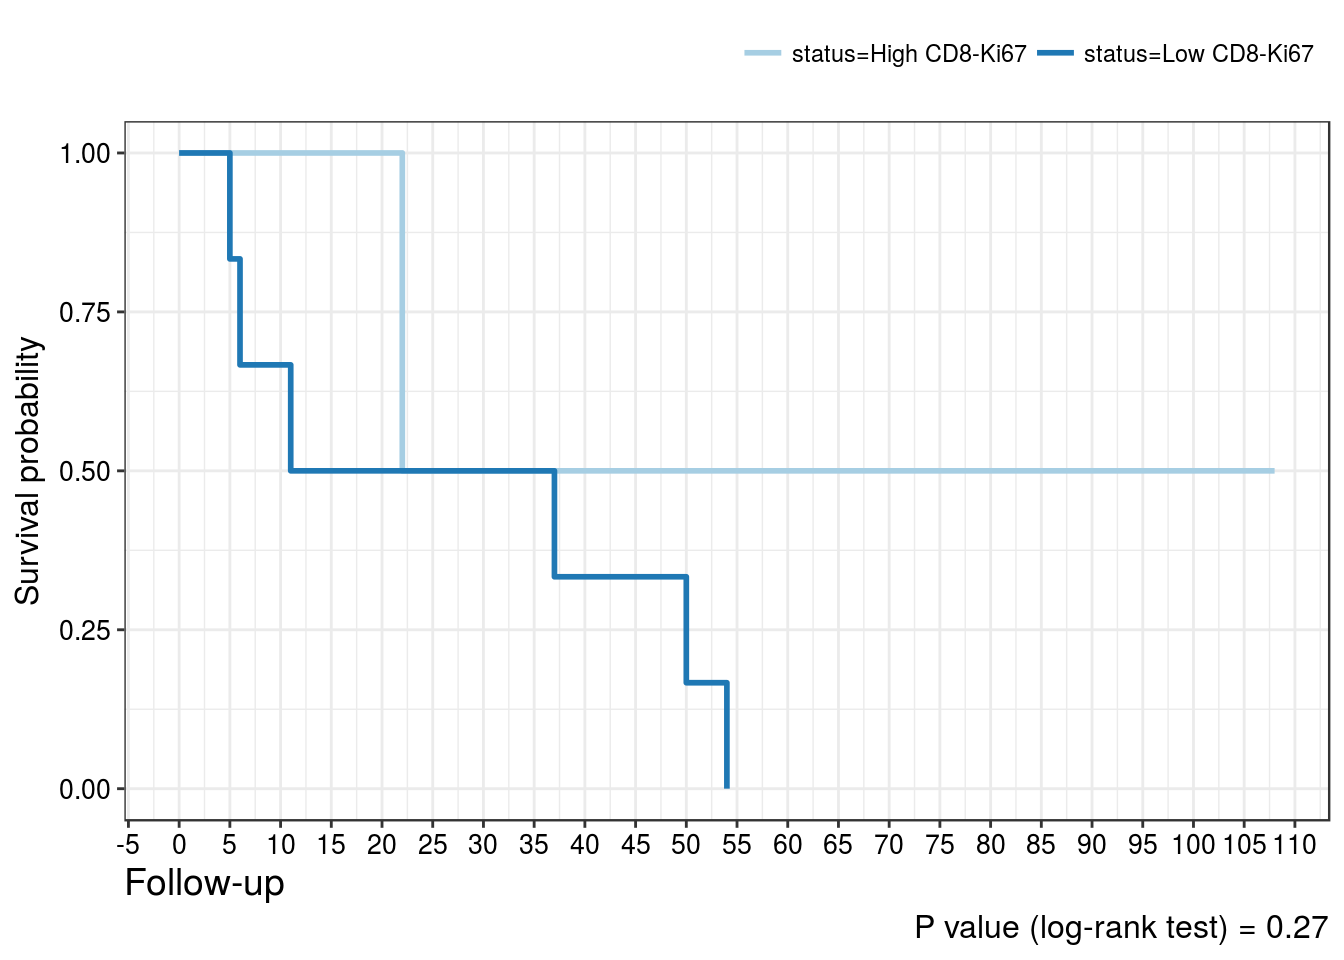
CD8-Ki67 positivity in intratumoral lymphocytes
| ANOD + AWD + DOC (%) | DOD (%) | |
|---|---|---|
| Low CD8-Ki67 | 2 (33.3) | 20 (83.3) |
| High CD8-Ki67 | 4 (66.7) | 4 (16.7) |
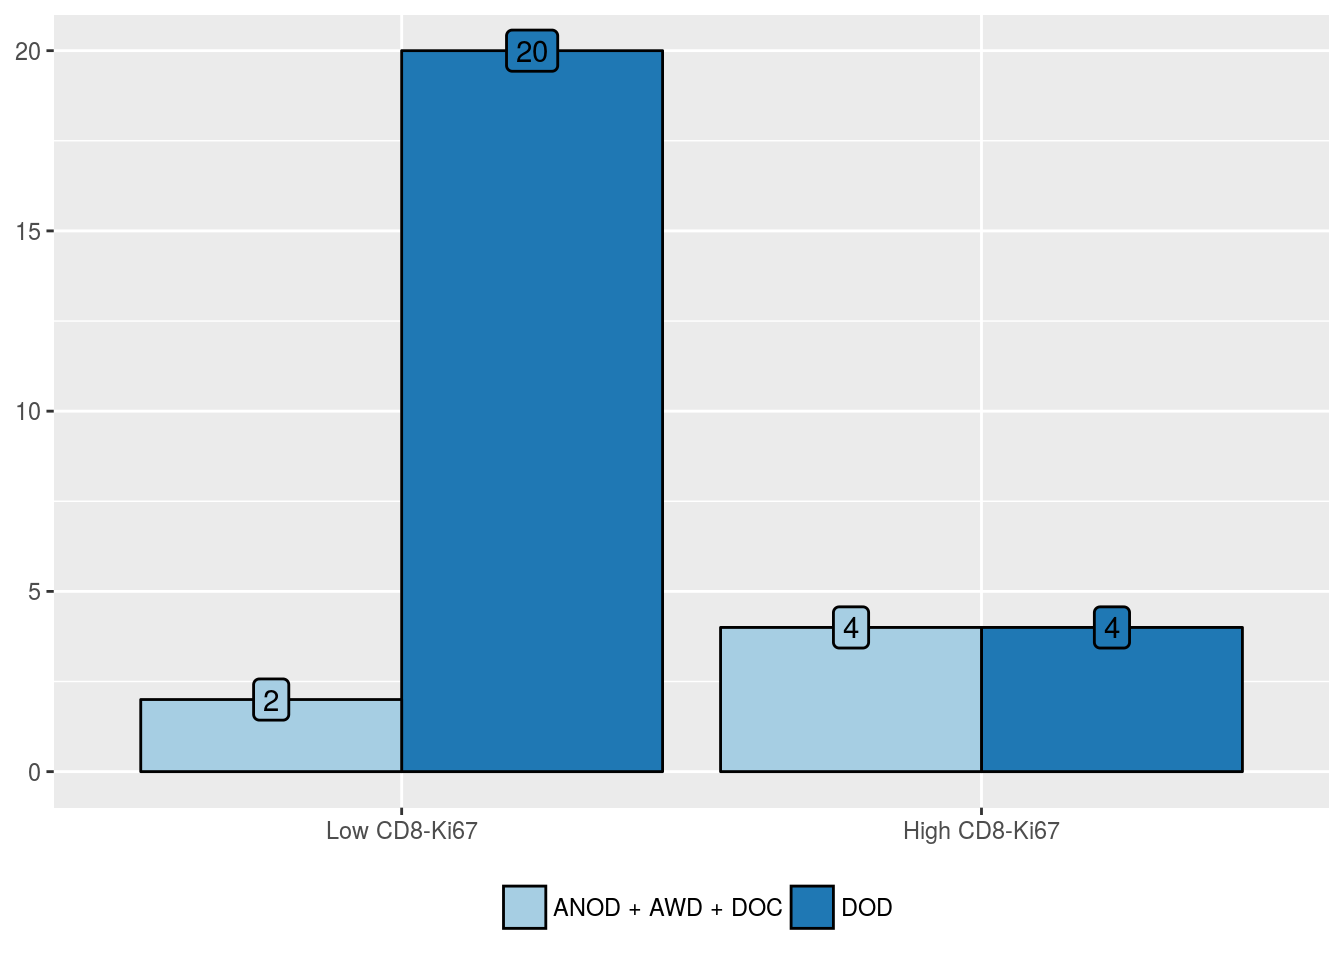
| Predictors | Odds Ratio (95% CI) | P value | Hazard Ratio (95% CI) | P value |
|---|---|---|---|---|
| High CD8-Ki67 positivity in intratumoral lymphocytes | 0.10 (0.011, 0.68) | 0.025 | 0.19 (0.057, 0.67) | 0.0021 |
CD8 positivity in stromal lymphocytes
| ANOD + AWD + DOC (%) | DOD (%) | |
|---|---|---|
| Low CD8 | 0 (0) | 3 (50) |
| High CD8 | 1 (100) | 3 (50) |
| Predictors | Odds Ratio (95% CI) | P value | Hazard Ratio (95% CI) | P value |
|---|---|---|---|---|
| High CD8 positivity in stromal lymphocytes | 9.5e-09 (NA, Inf) | 1 | 0.40 (0.065, 2.47) | 0.32 |
CD8-Ki67 positivity in stromal lymphocytes
| ANOD + AWD + DOC (%) | DOD (%) | |
|---|---|---|
| Low CD8-Ki67 | 0 (0) | 6 (85.7) |
| High CD8-Ki67 | 1 (100) | 1 (14.3) |
| Predictors | Odds Ratio (95% CI) | P value | Hazard Ratio (95% CI) | P value |
|---|---|---|---|---|
| High CD8-Ki67 positivity in stromal lymphocytes | 1.2e-09 (NA, Inf) | 1 | 0.32 (0.038, 2.71) | 0.24 |
Ki67 positivity in intratumoral lymphocytes
| ANOD + AWD + DOC (%) | DOD (%) | |
|---|---|---|
| Low Ki67 | 3 (50) | 11 (50) |
| High Ki67 | 3 (50) | 11 (50) |
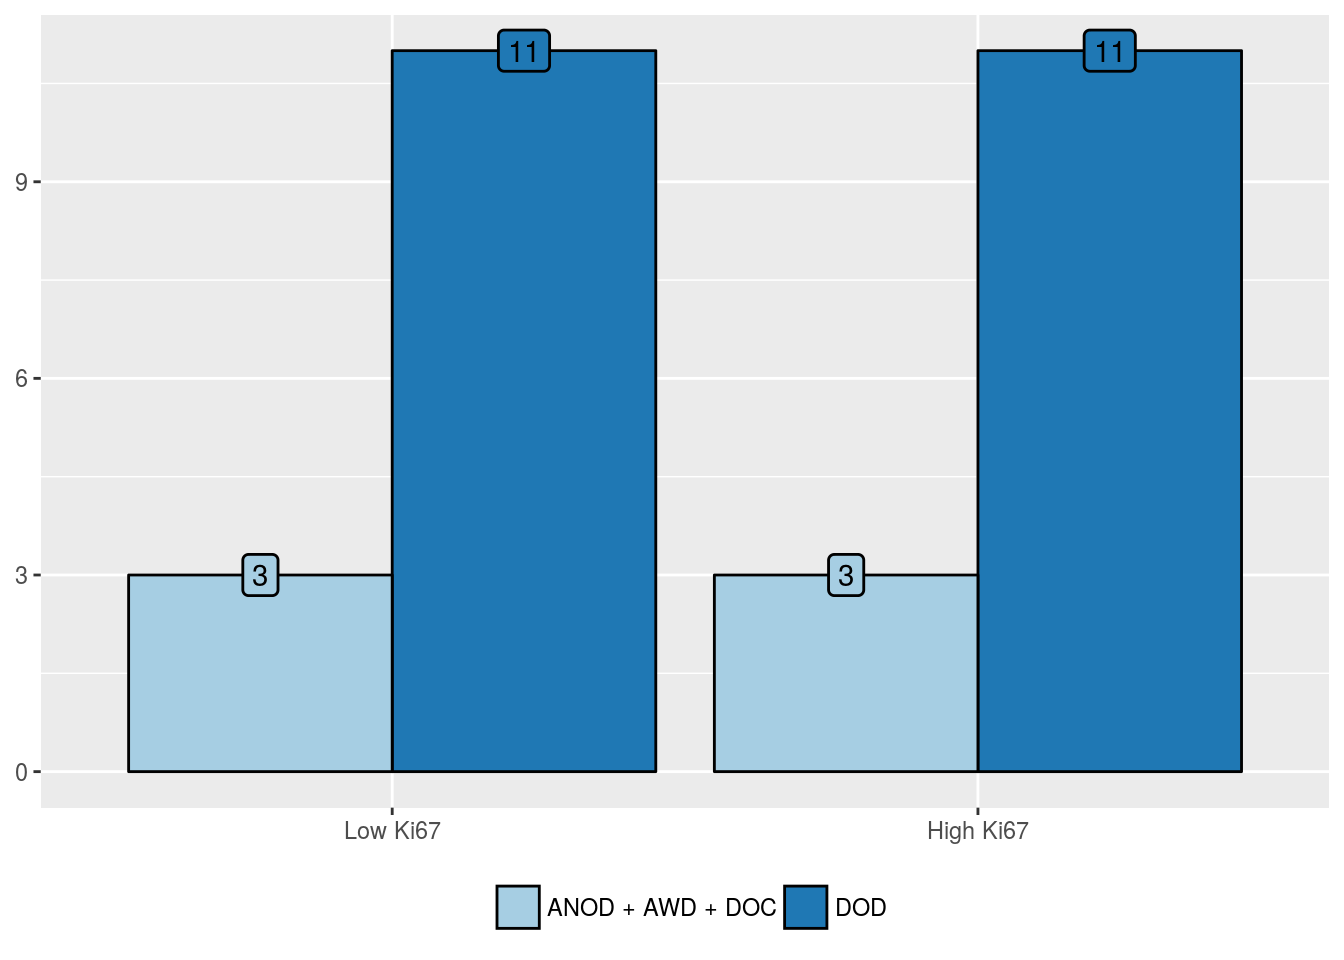
| Predictors | Odds Ratio (95% CI) | P value | Hazard Ratio (95% CI) | P value |
|---|---|---|---|---|
| High Ki67 positivity in intratumoral lymphocytes | 1.00 (0.15, 6.48) | 1 | 0.62 (0.26, 1.48) | 0.28 |