Cohort features by tissue types
Primary tumors vs. metastatic tumors
Clinical features
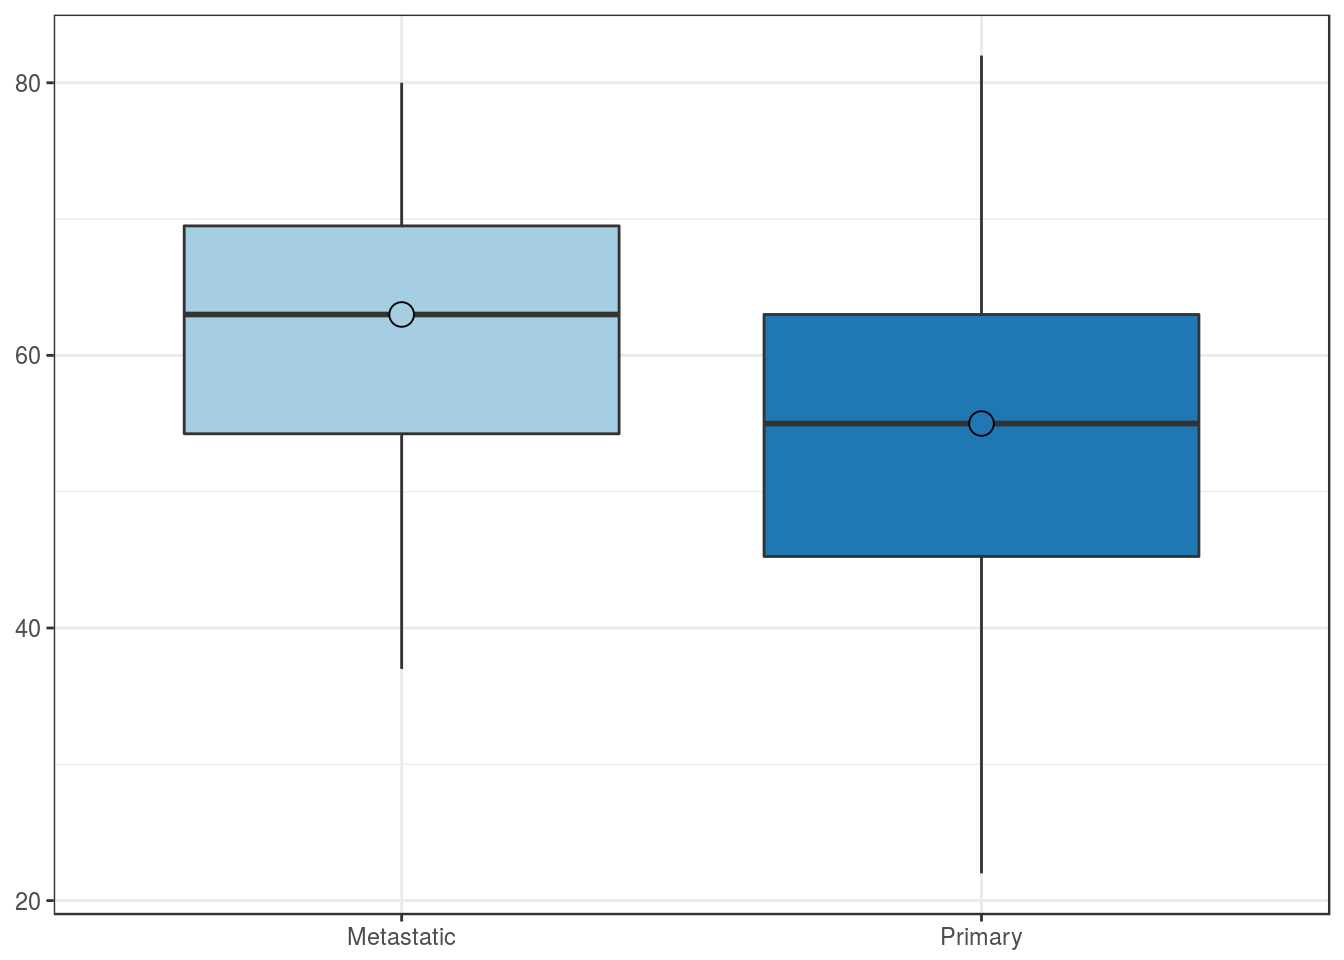
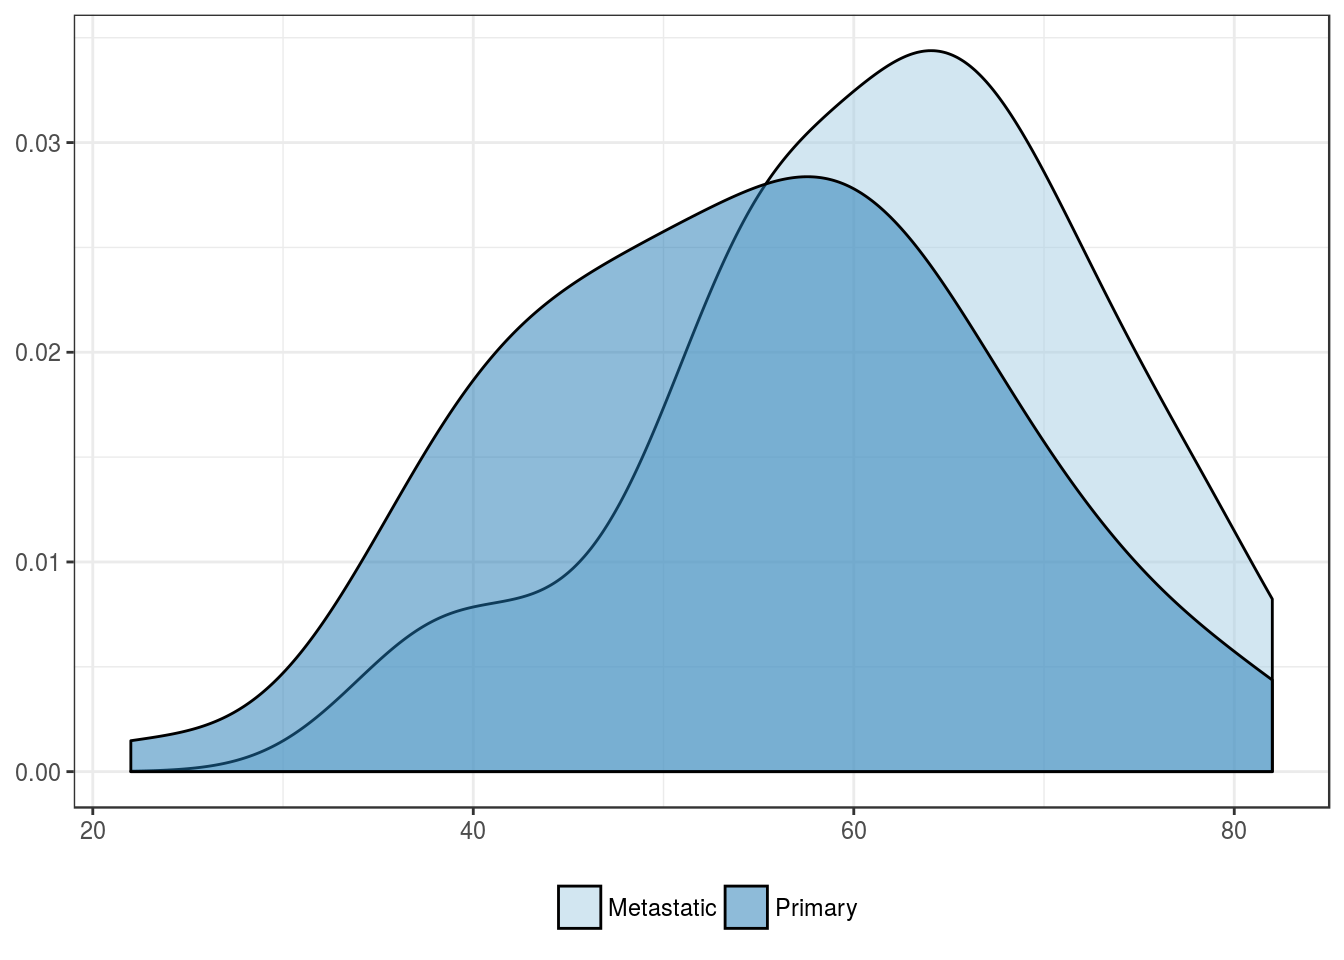
Patients’ age, in years
| Metastatic | Primary | |
|---|---|---|
| Mean | 61.5 | 54.7 |
| Standard deviation | 11.0 | 12.5 |
| Median | 63.0 | 55.0 |
| Interquartile range | 15.2 | 17.8 |
| Minimum | 37.0 | 22.0 |
| Maximum | 80.0 | 82.0 |
| Value | |
|---|---|
| U-statistic | 1952 |
| P statistic | 3.8e-03 |
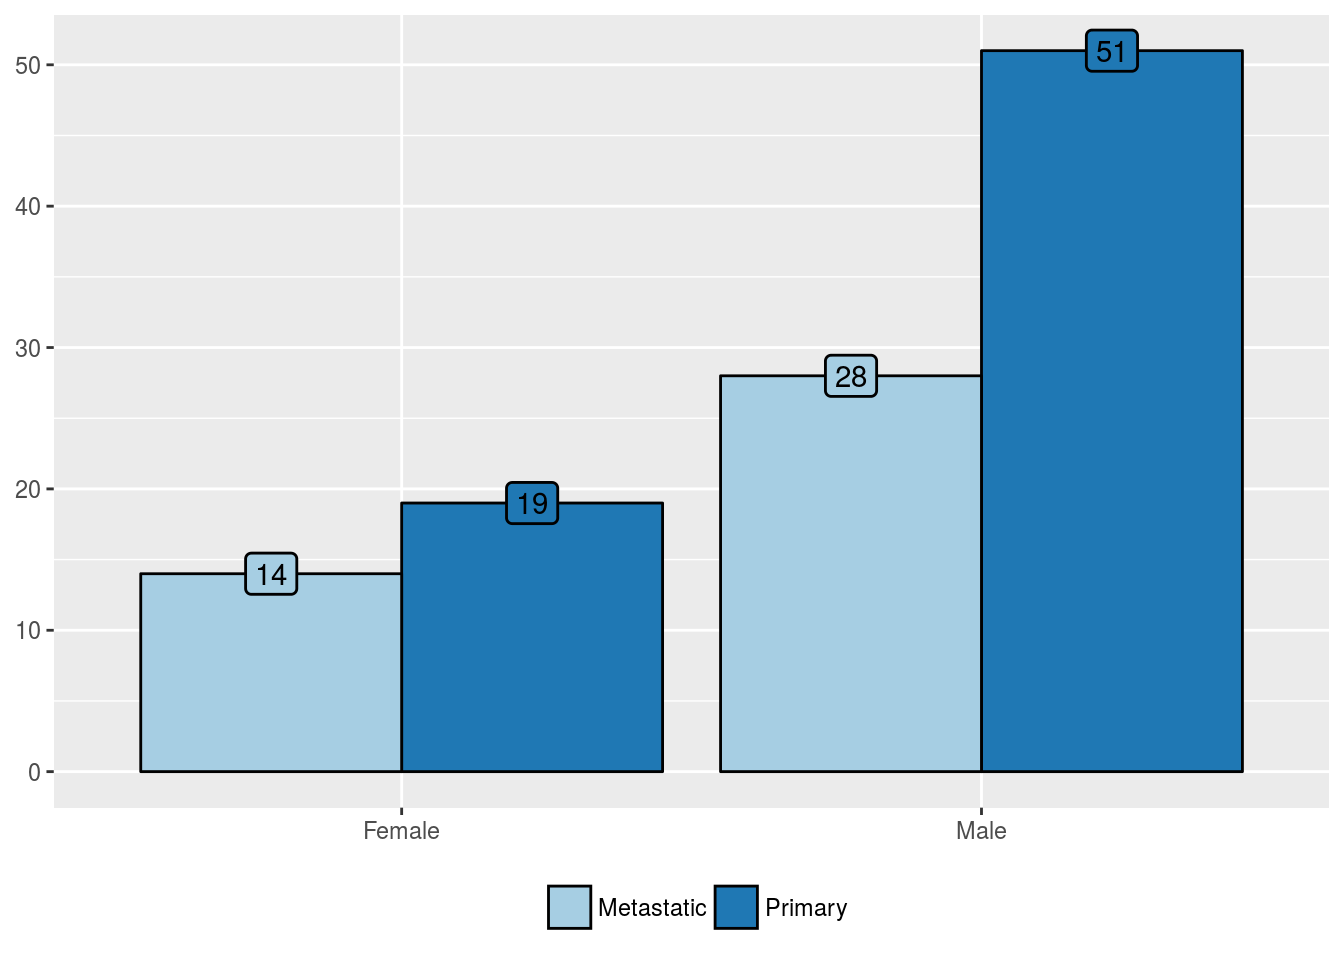
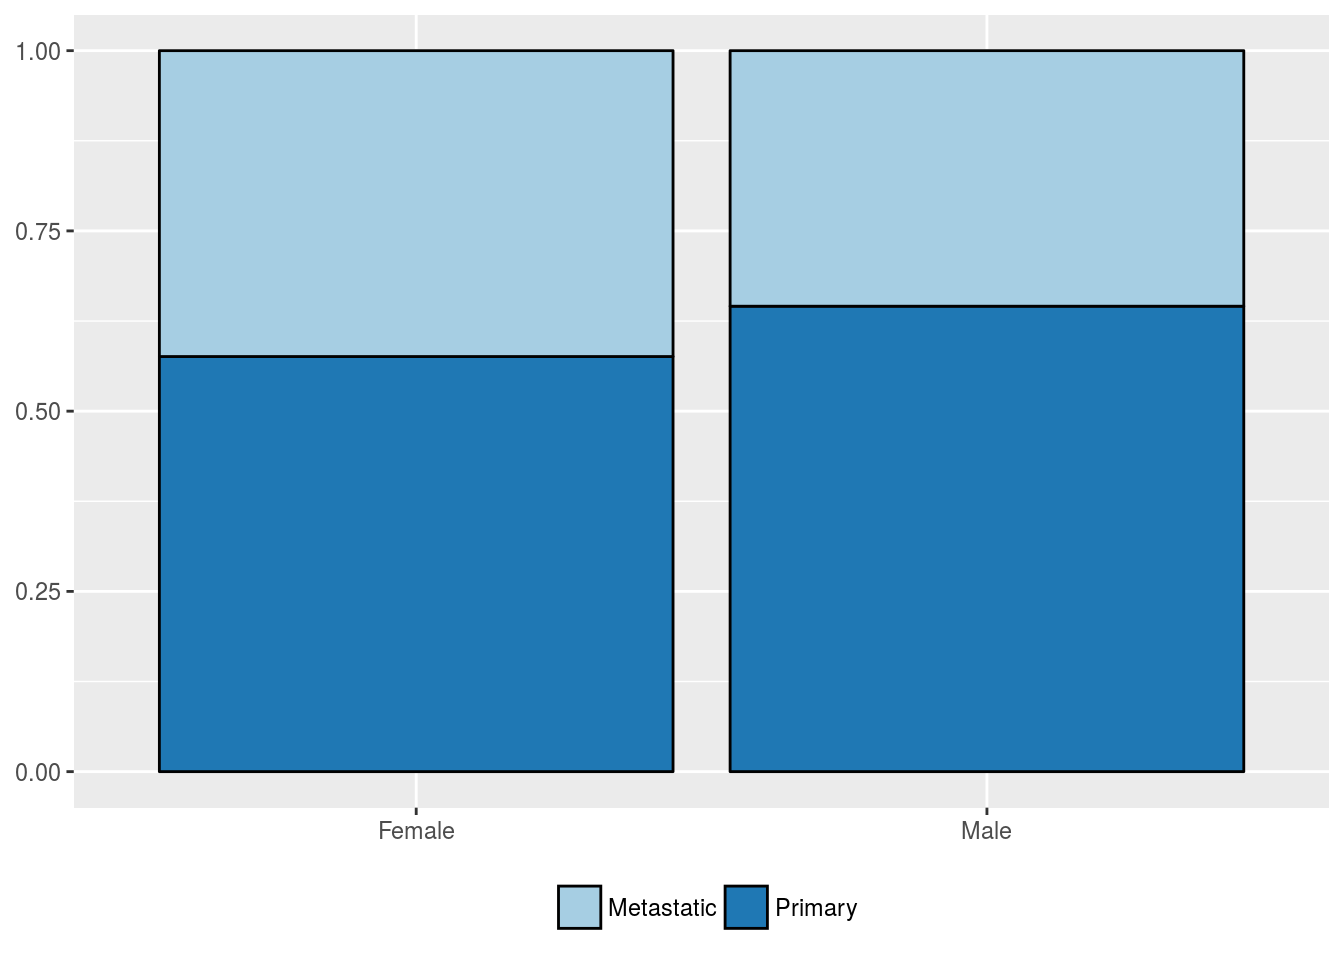
Patients’ sex
| Metastatic (%) | Primary (%) | |
|---|---|---|
| Female | 14 (33.3) | 19 (27.1) |
| Male | 28 (66.7) | 51 (72.9) |
| Value | |
|---|---|
| Statistic | 0.232 |
| Parameter | 1 |
| P statistic | 0.63 |
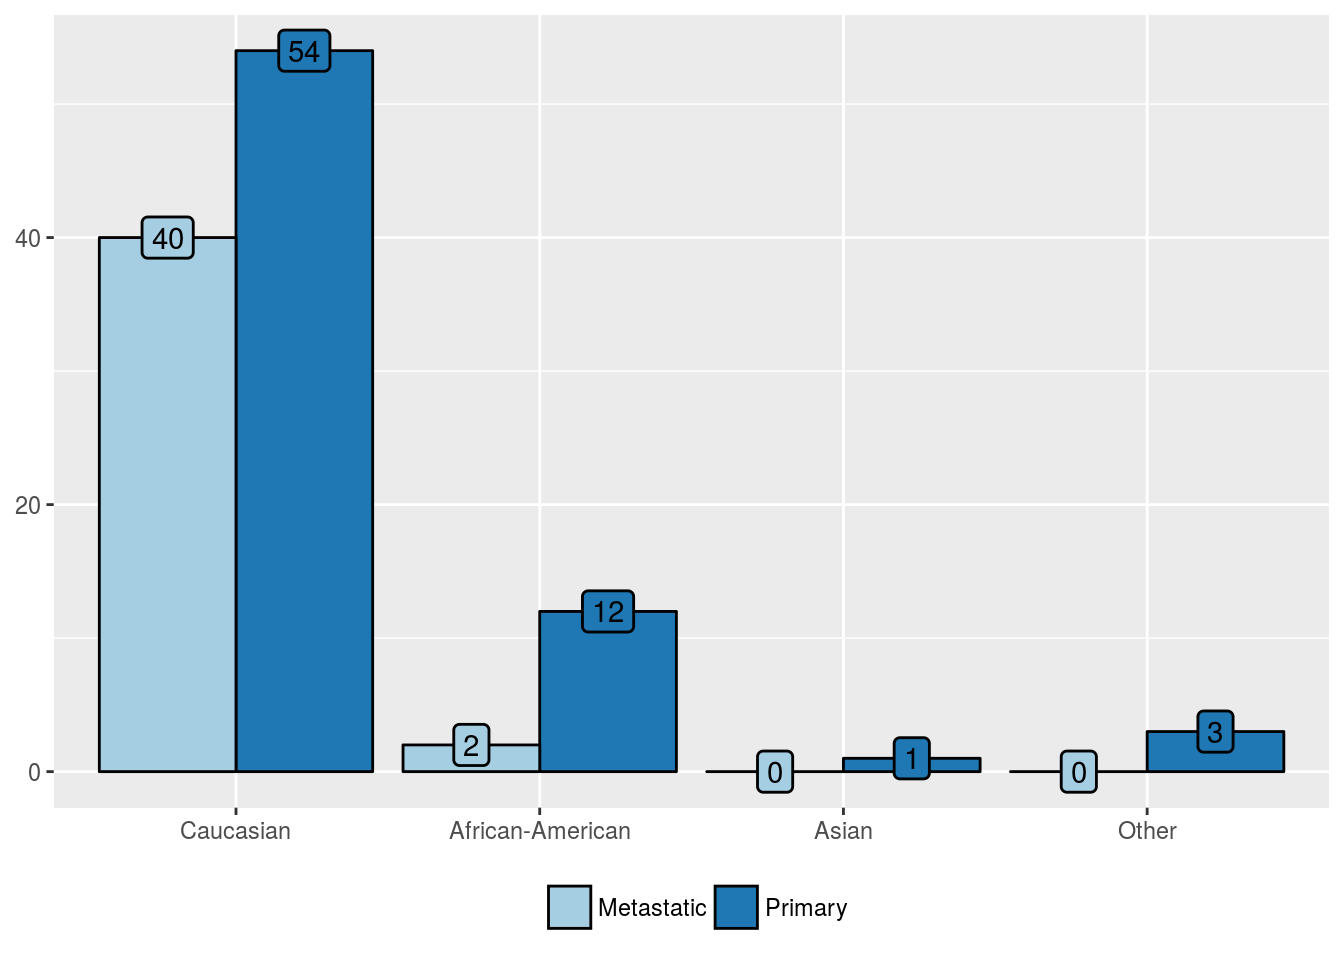
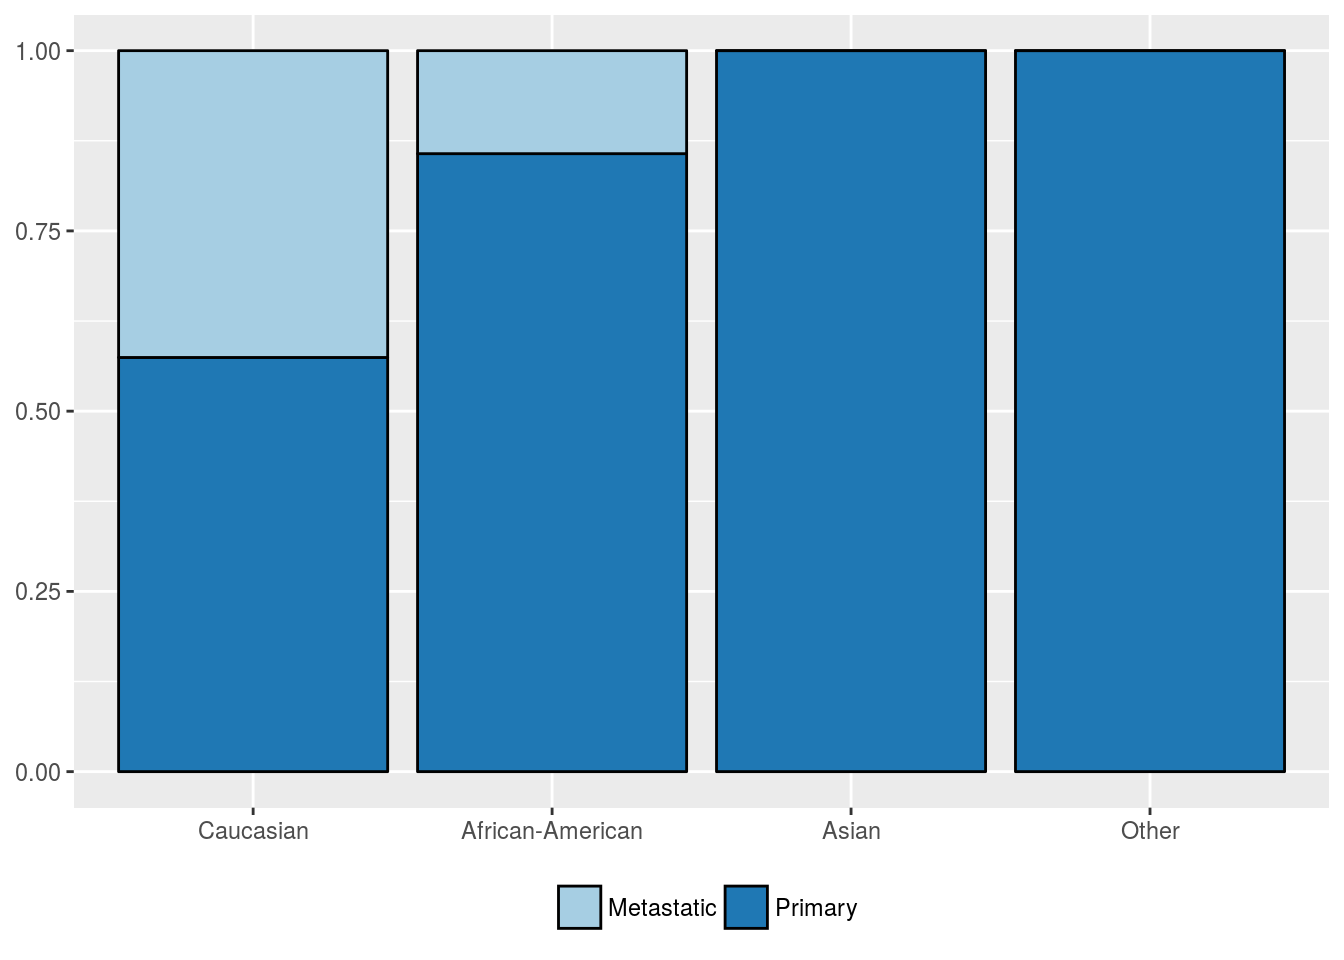
Patients’ race
| Metastatic (%) | Primary (%) | |
|---|---|---|
| Caucasian | 40 (95.2) | 54 (77.1) |
| African-American | 2 (4.8) | 12 (17.1) |
| Asian | 0 (0) | 1 (1.4) |
| Other | 0 (0) | 3 (4.3) |
| Value | |
|---|---|
| Statistic | 6.643 |
| Parameter | 3 |
| P statistic | 0.084 |
Outcome features
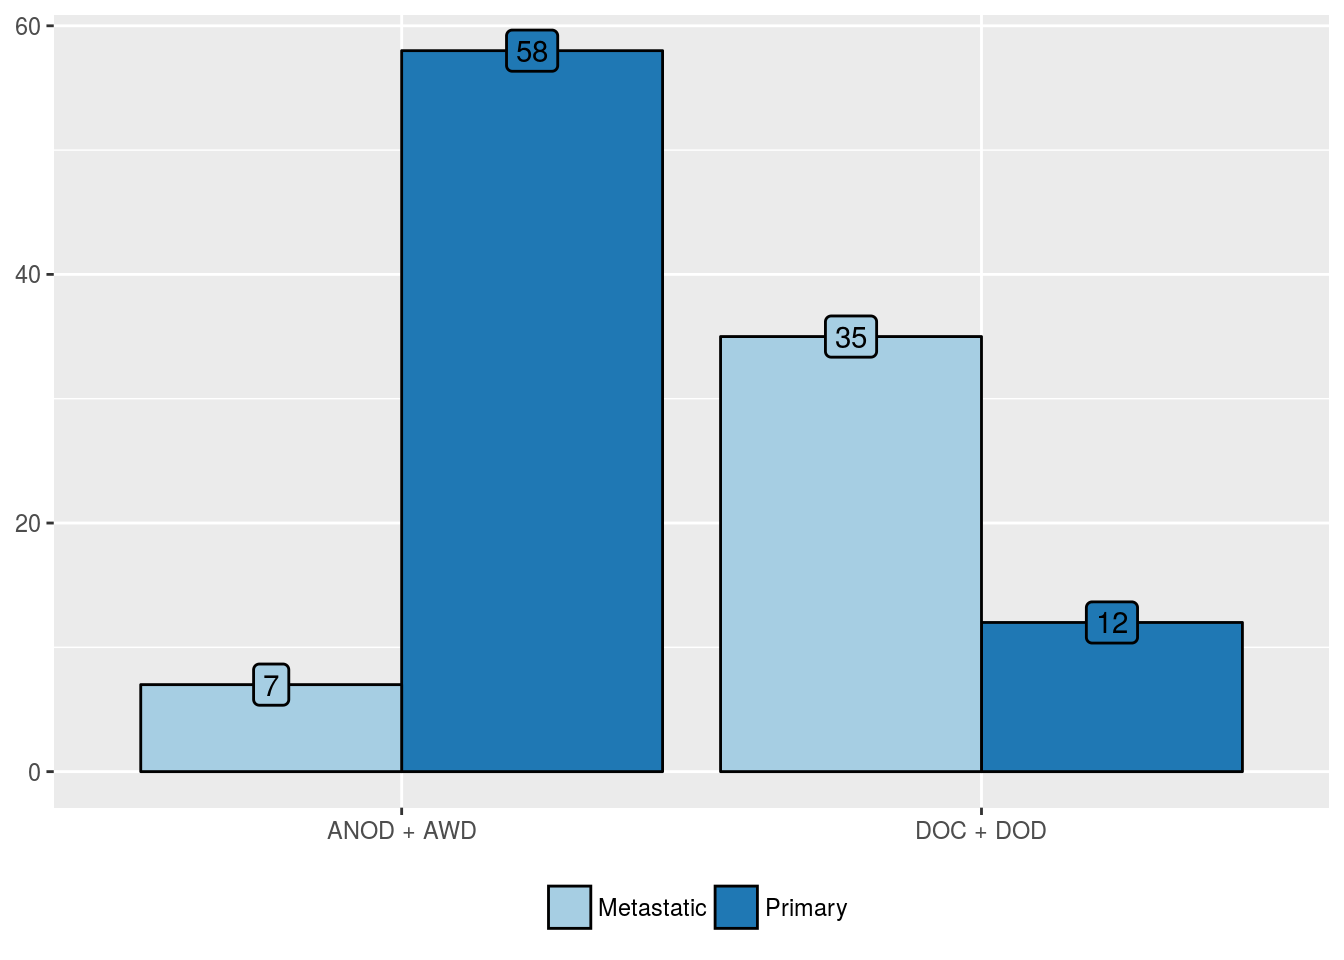
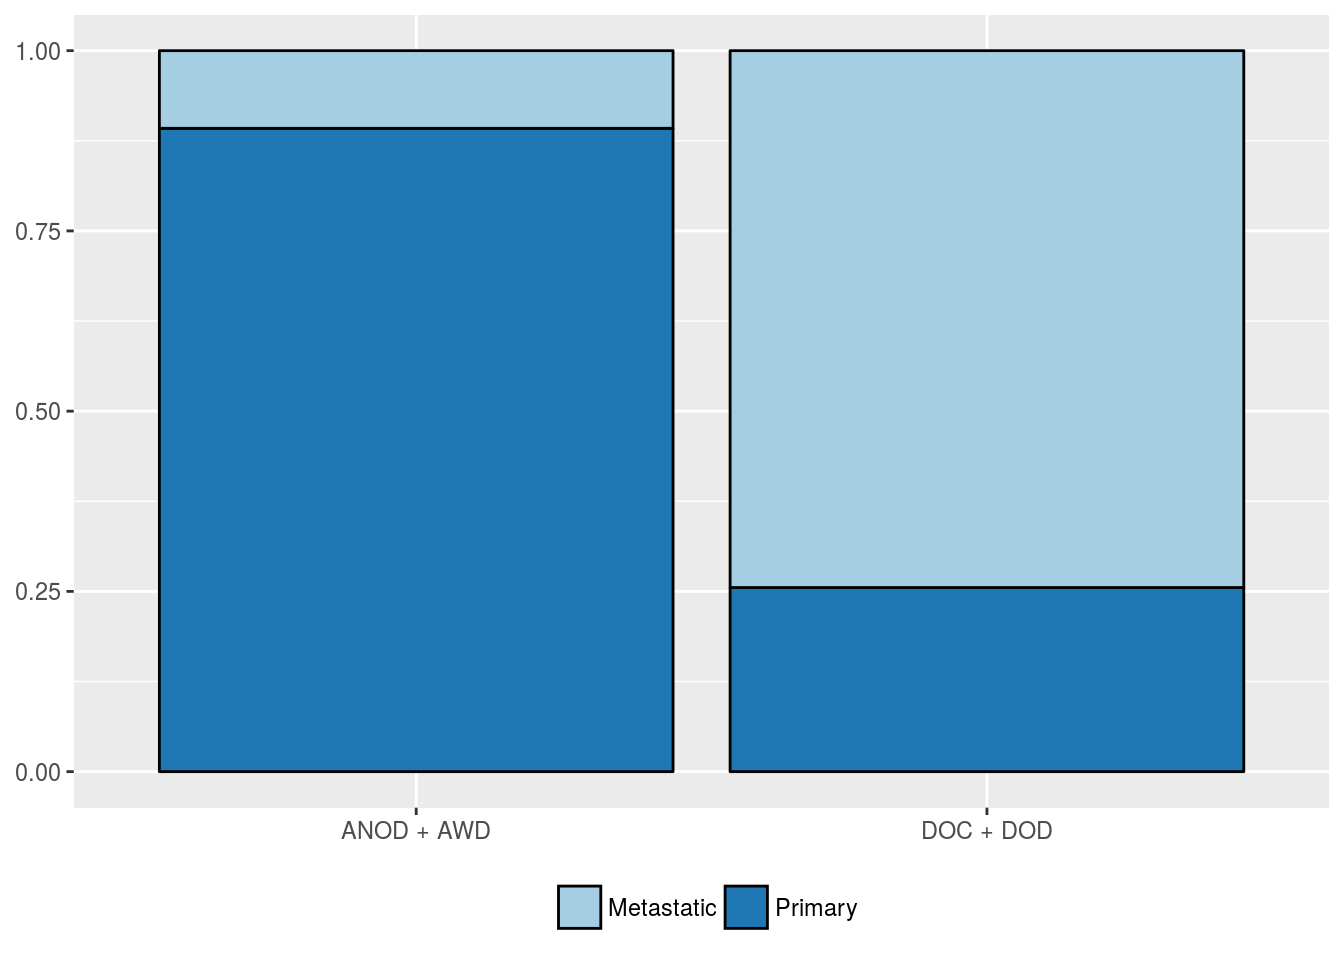
Overall mortality
| Metastatic (%) | Primary (%) | |
|---|---|---|
| ANOD + AWD | 7 (16.7) | 58 (82.9) |
| DOC + DOD | 35 (83.3) | 12 (17.1) |
| Value | |
|---|---|
| Statistic | 44.54 |
| Parameter | 1 |
| P statistic | 2.5e-11 |
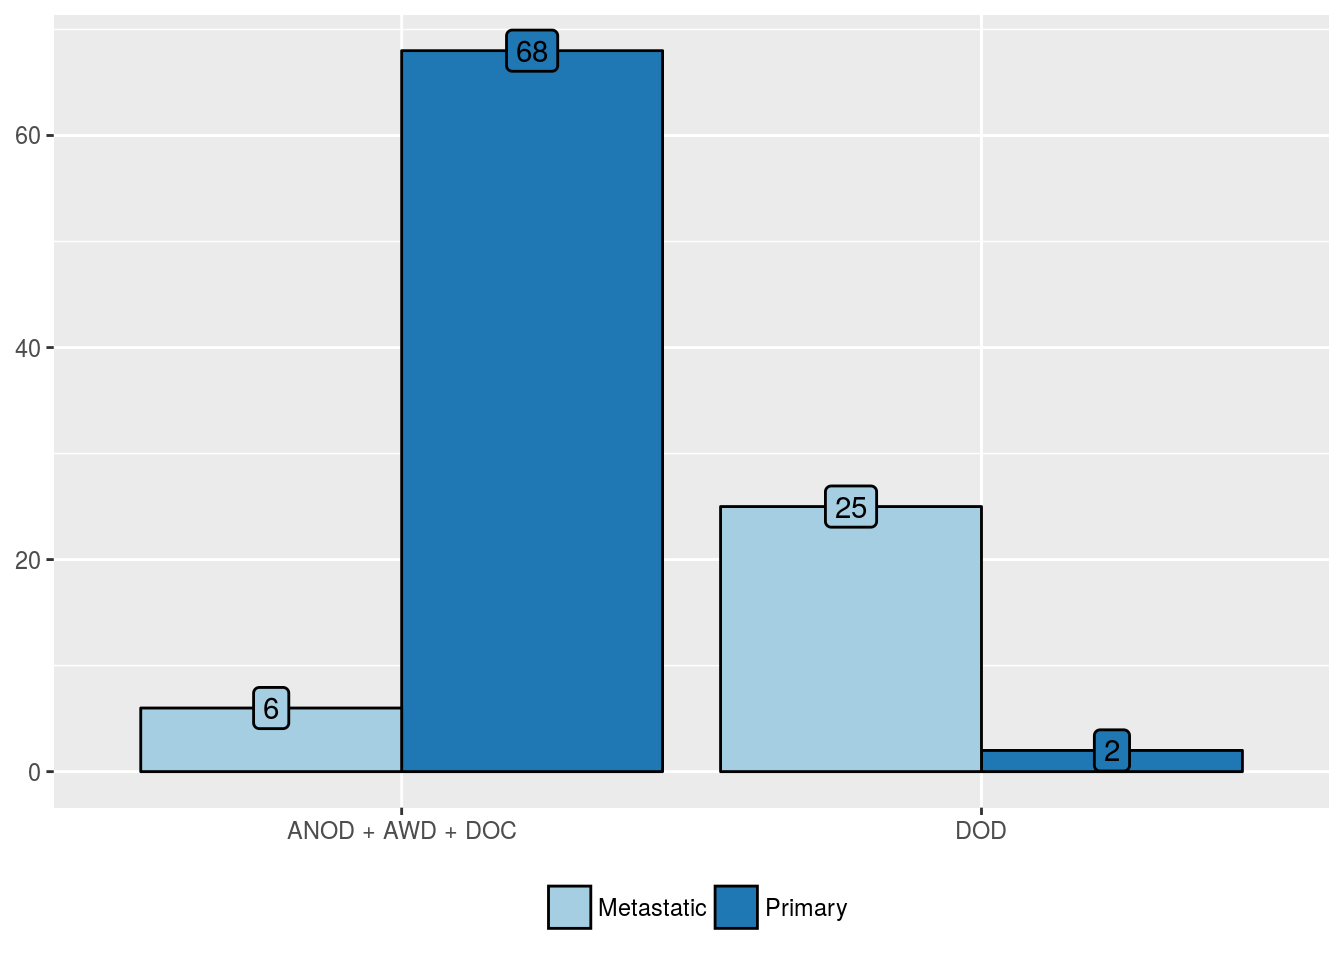
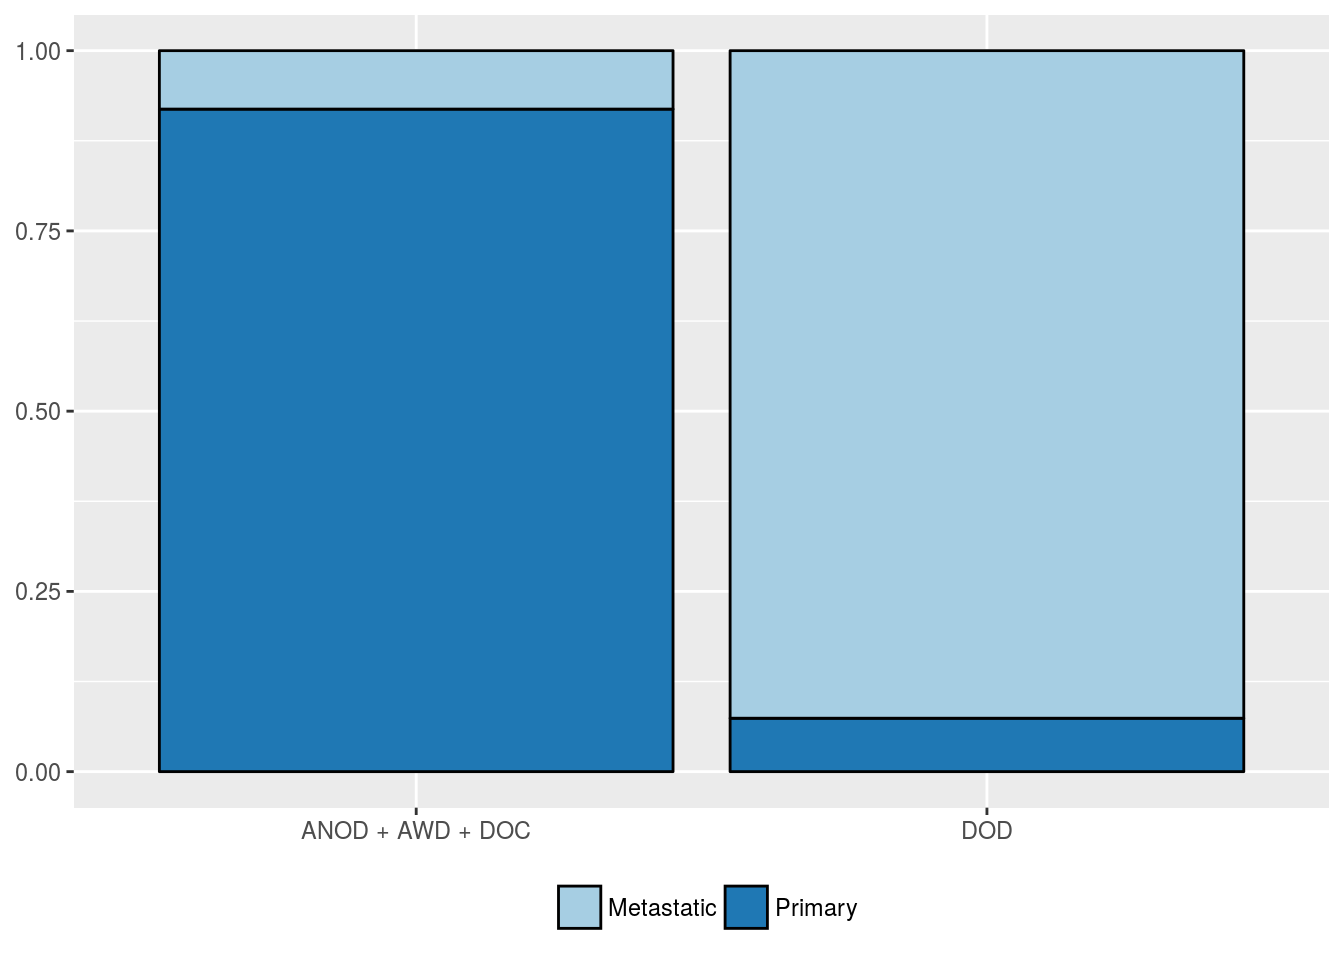
Cancer-related mortality
| Metastatic (%) | Primary (%) | |
|---|---|---|
| ANOD + AWD + DOC | 6 (19.4) | 68 (97.1) |
| DOD | 25 (80.6) | 2 (2.9) |
| Value | |
|---|---|
| Statistic | 62.46 |
| Parameter | 1 |
| P statistic | 2.7e-15 |