FOXP3 expression in primary tumors
FOXP3 positivity in intratumoral lymphocytes
Clinical features
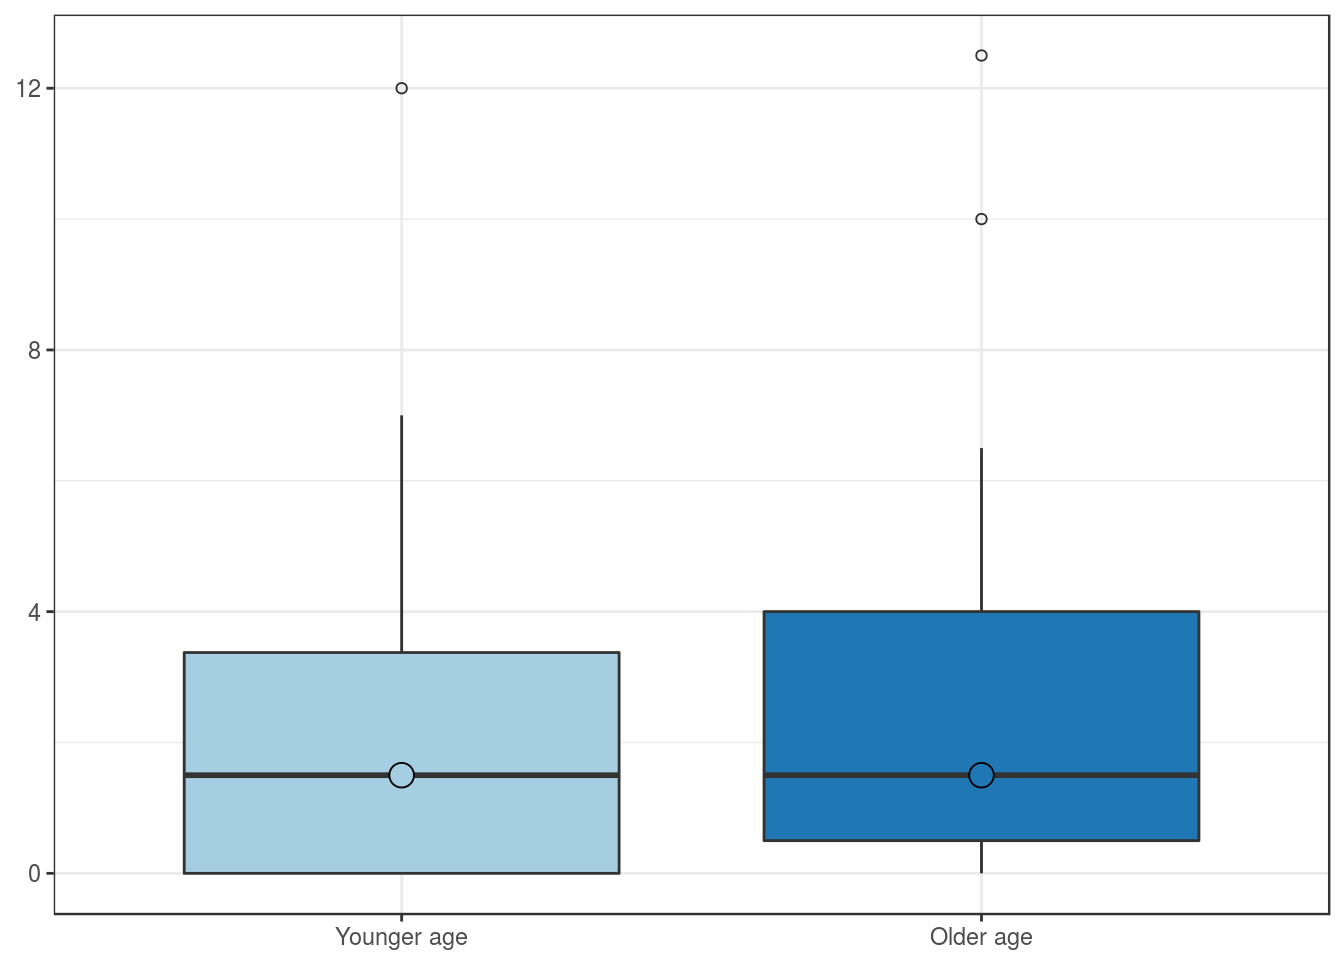
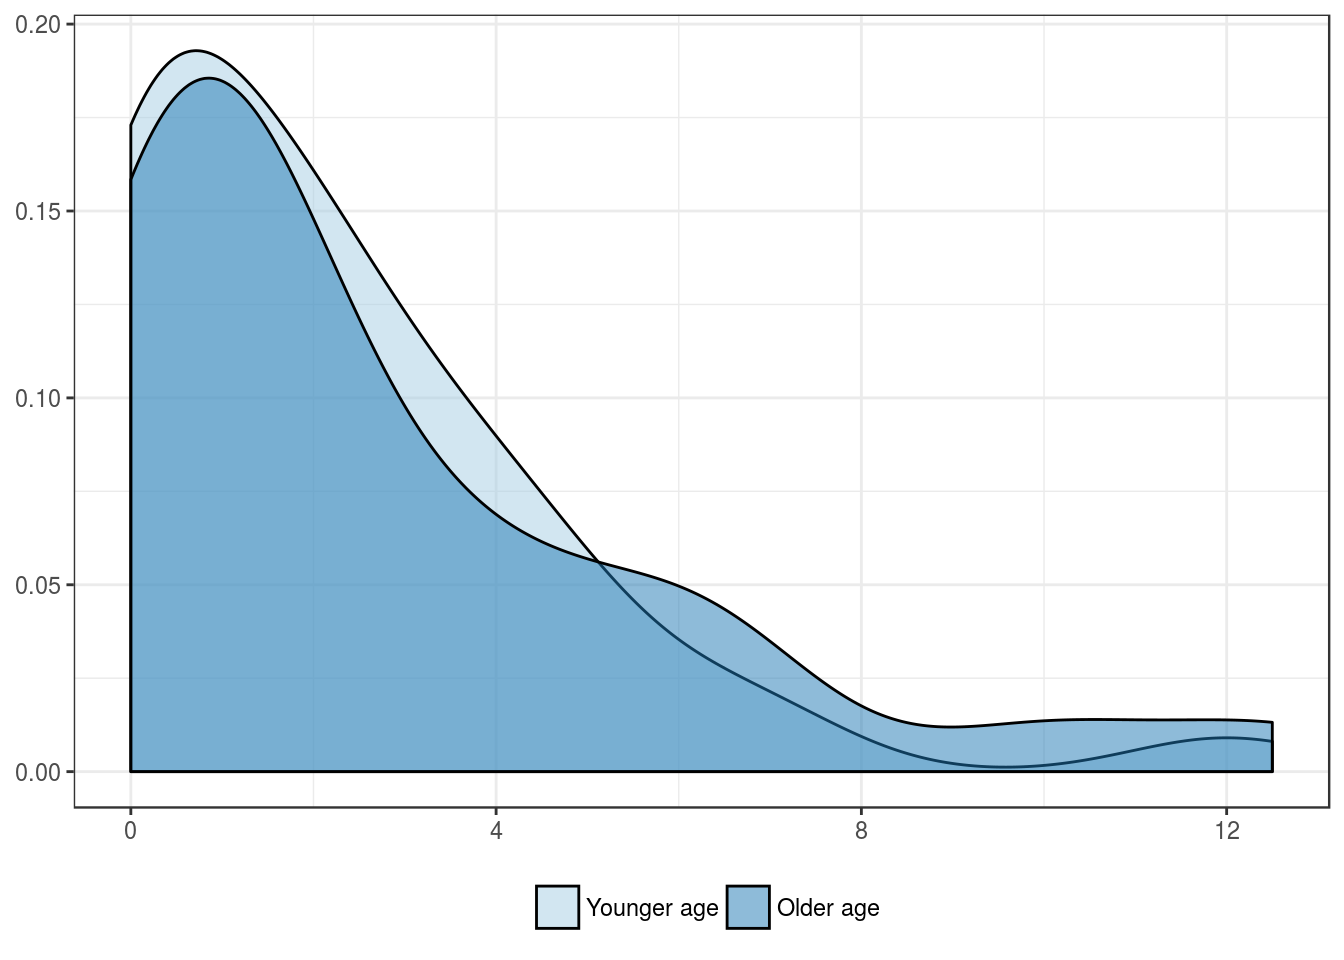
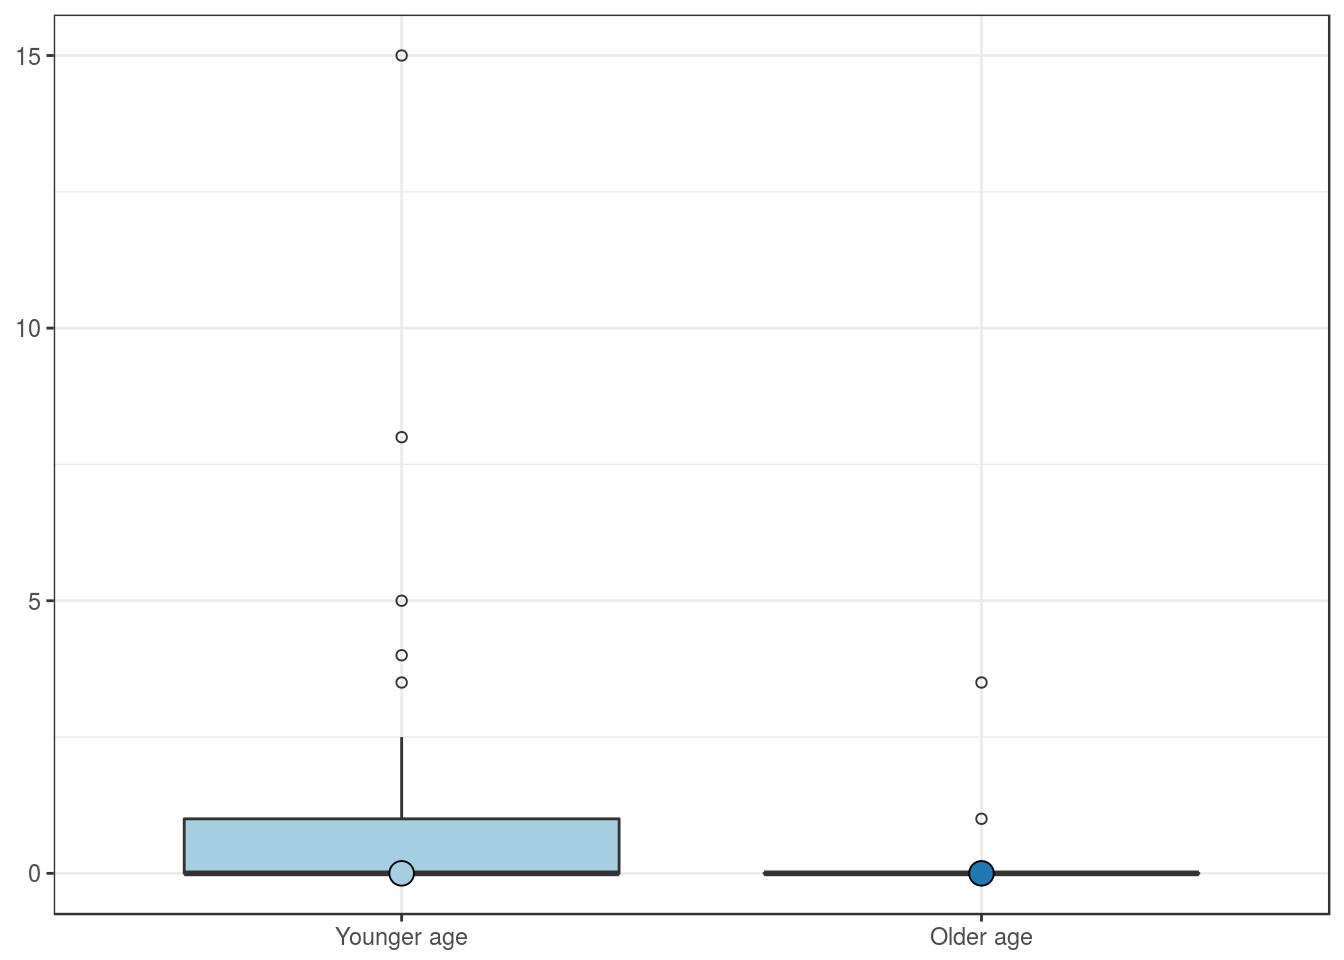
Patients’ age group, in years
| Younger age | Older age | |
|---|---|---|
| Mean | 2.1 | 2.7 |
| Standard deviation | 2.5 | 3.2 |
| Median | 1.5 | 1.5 |
| Interquartile range | 3.4 | 3.5 |
| Minimum | 0.0 | 0.0 |
| Maximum | 12.0 | 12.5 |
| Value | |
|---|---|
| U-statistic | 547 |
| P statistic | 6.2e-01 |
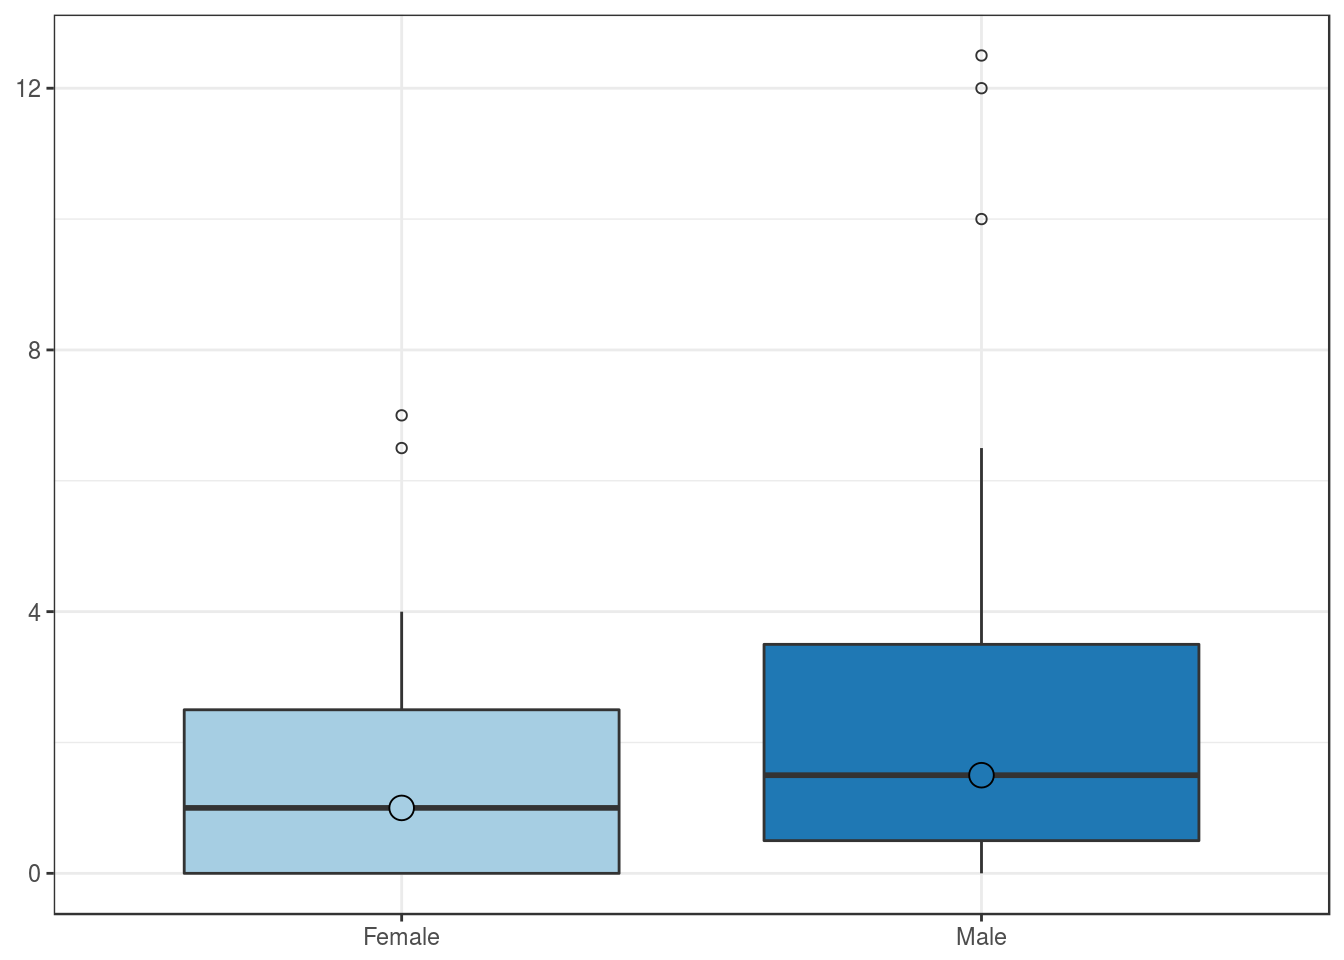
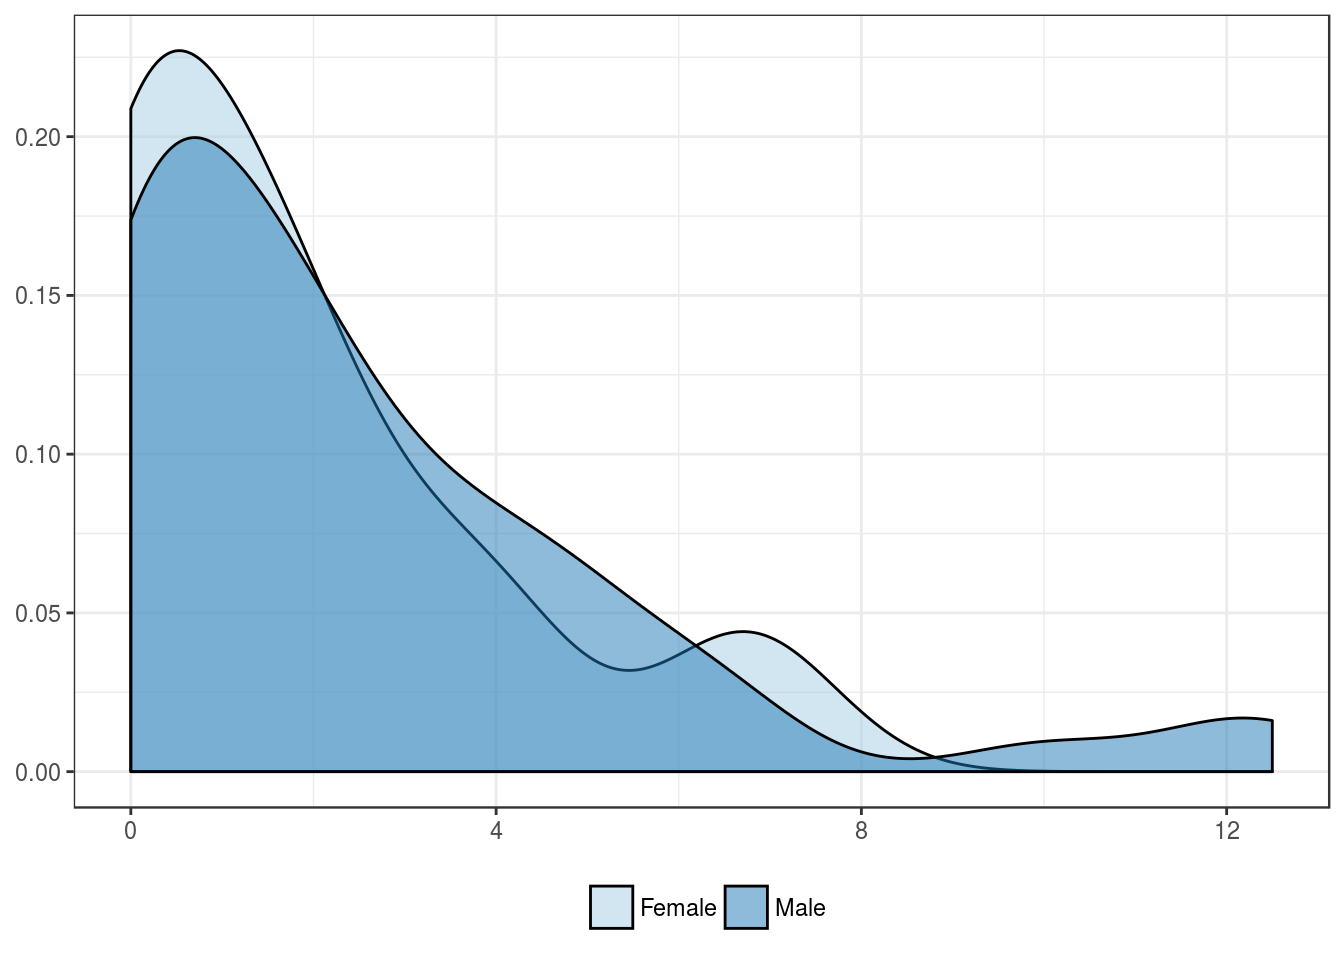
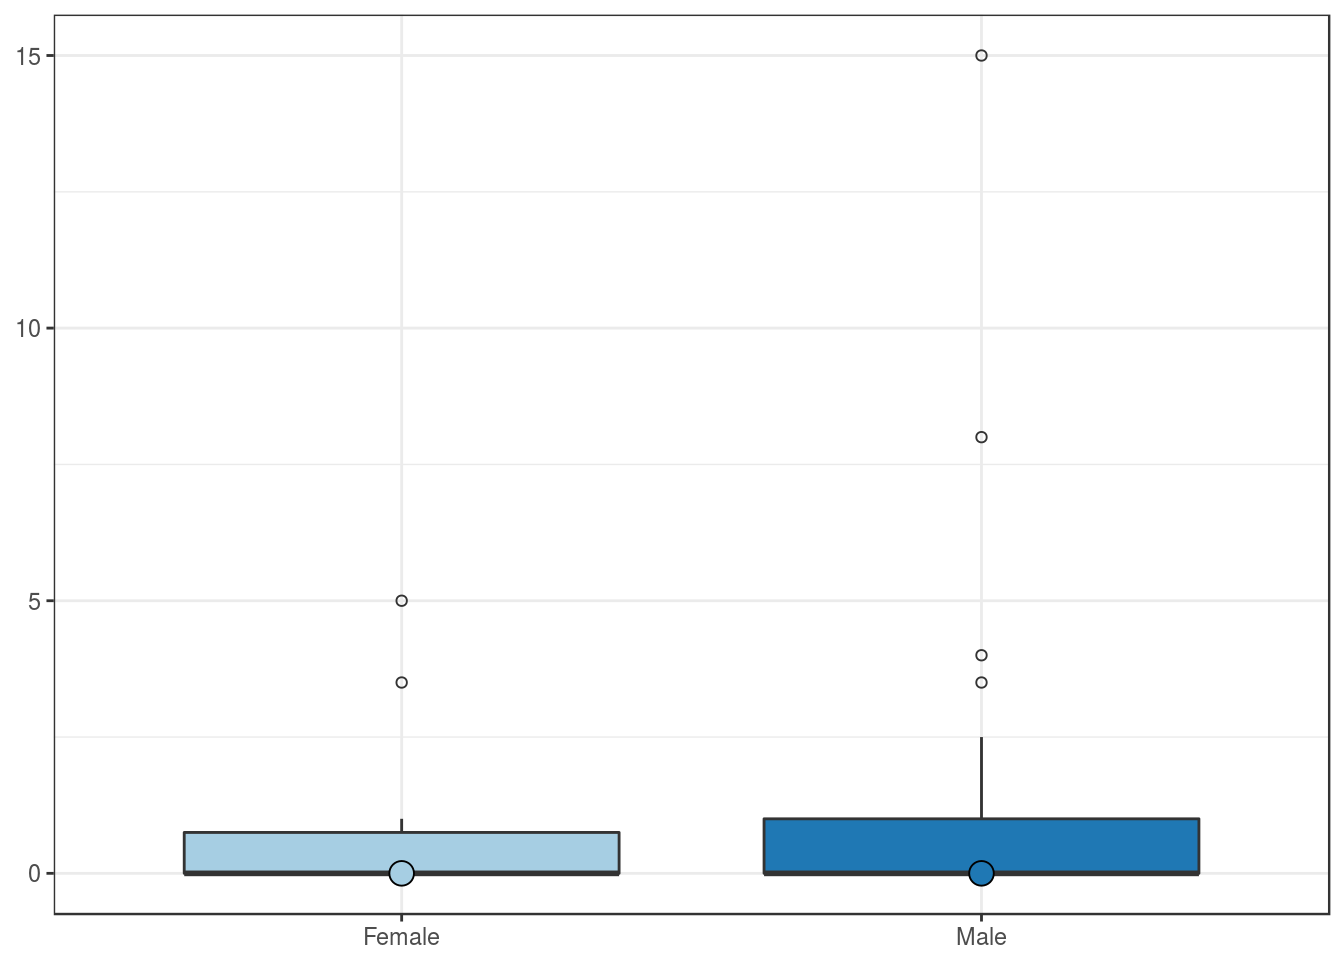
Patients’ sex
| Female | Male | |
|---|---|---|
| Mean | 1.8 | 2.5 |
| Standard deviation | 2.2 | 2.9 |
| Median | 1.0 | 1.5 |
| Interquartile range | 2.5 | 3.0 |
| Minimum | 0.0 | 0.0 |
| Maximum | 7.0 | 12.5 |
| Value | |
|---|---|
| U-statistic | 416 |
| P statistic | 3.7e-01 |
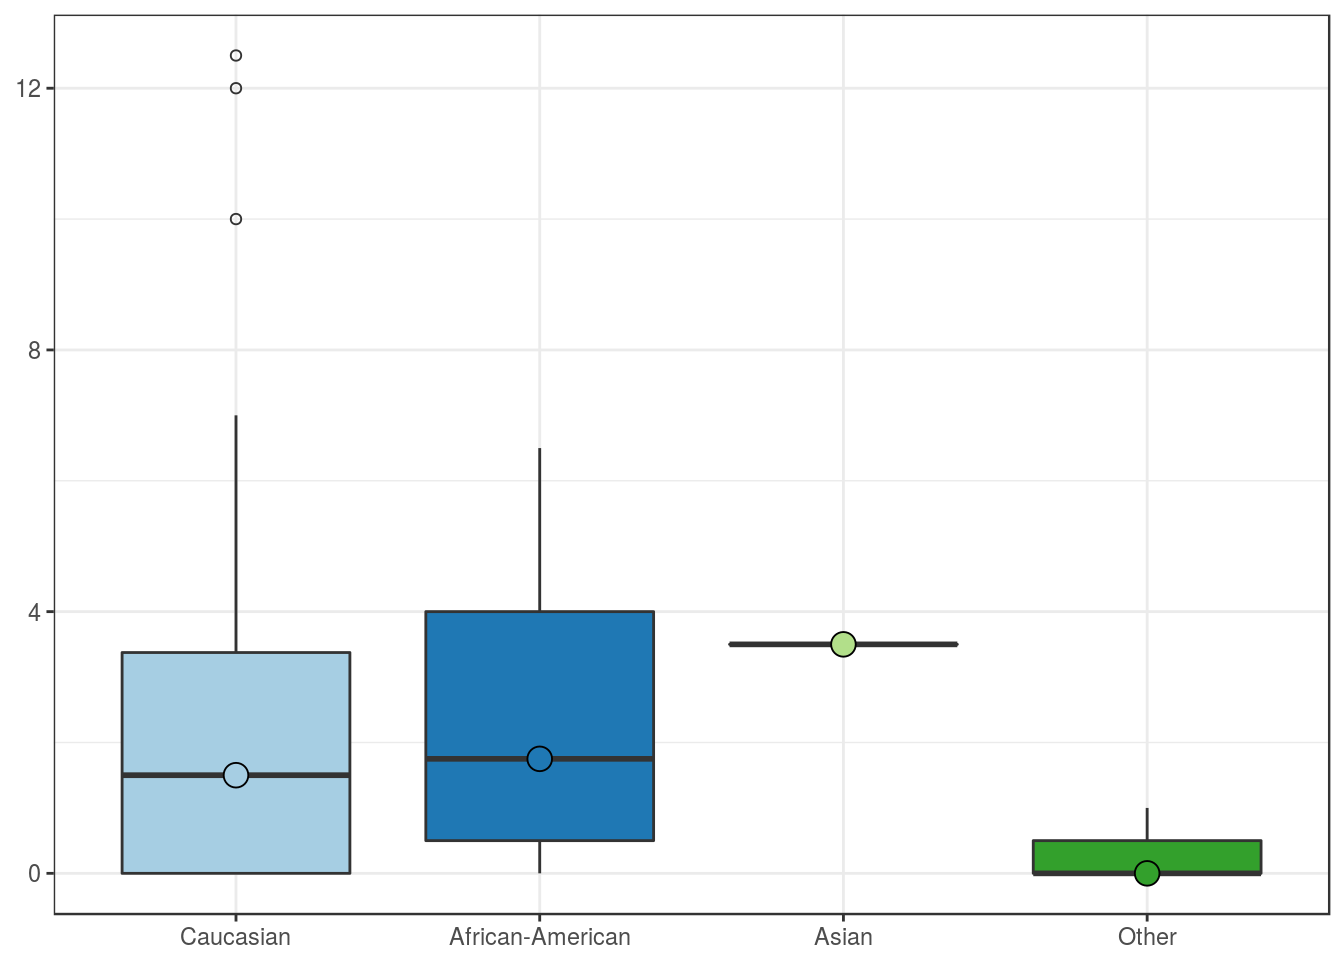
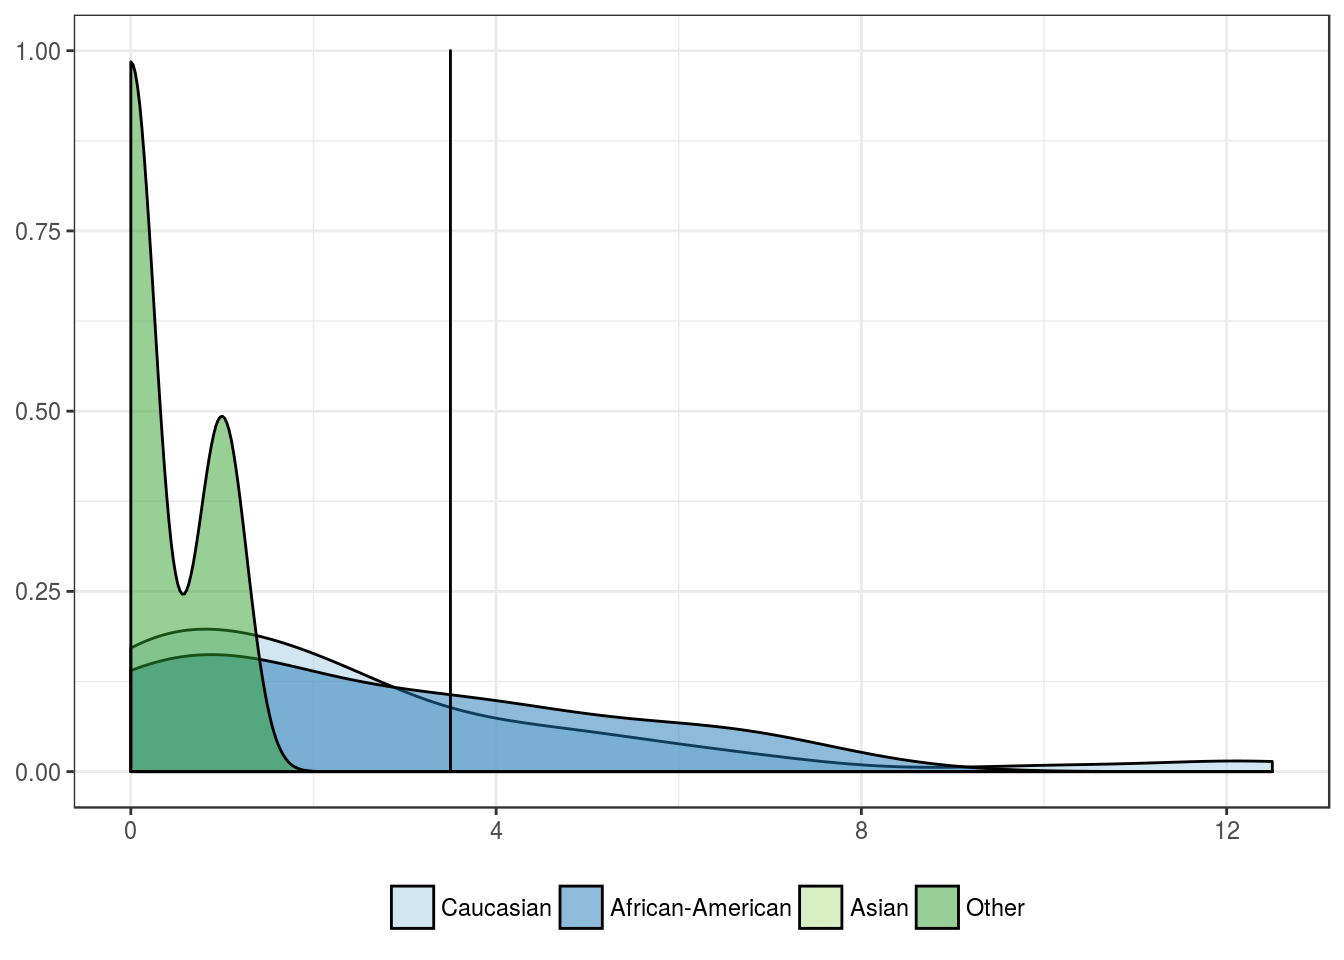
Patients’ race
| Caucasian | African-American | Asian | Other | |
|---|---|---|---|---|
| Mean | 2.4 | 2.5 | 3.5 | 0.3 |
| Standard deviation | 2.9 | 2.4 | NA | 0.6 |
| Median | 1.5 | 1.8 | 3.5 | 0.0 |
| Interquartile range | 3.4 | 3.5 | 0.0 | 0.5 |
| Minimum | 0.0 | 0.0 | 3.5 | 0.0 |
| Maximum | 12.5 | 6.5 | 3.5 | 1.0 |
| Value | |
|---|---|
| Statistic | 3.812 |
| Parameter | 3 |
| P statistic | 0.28 |
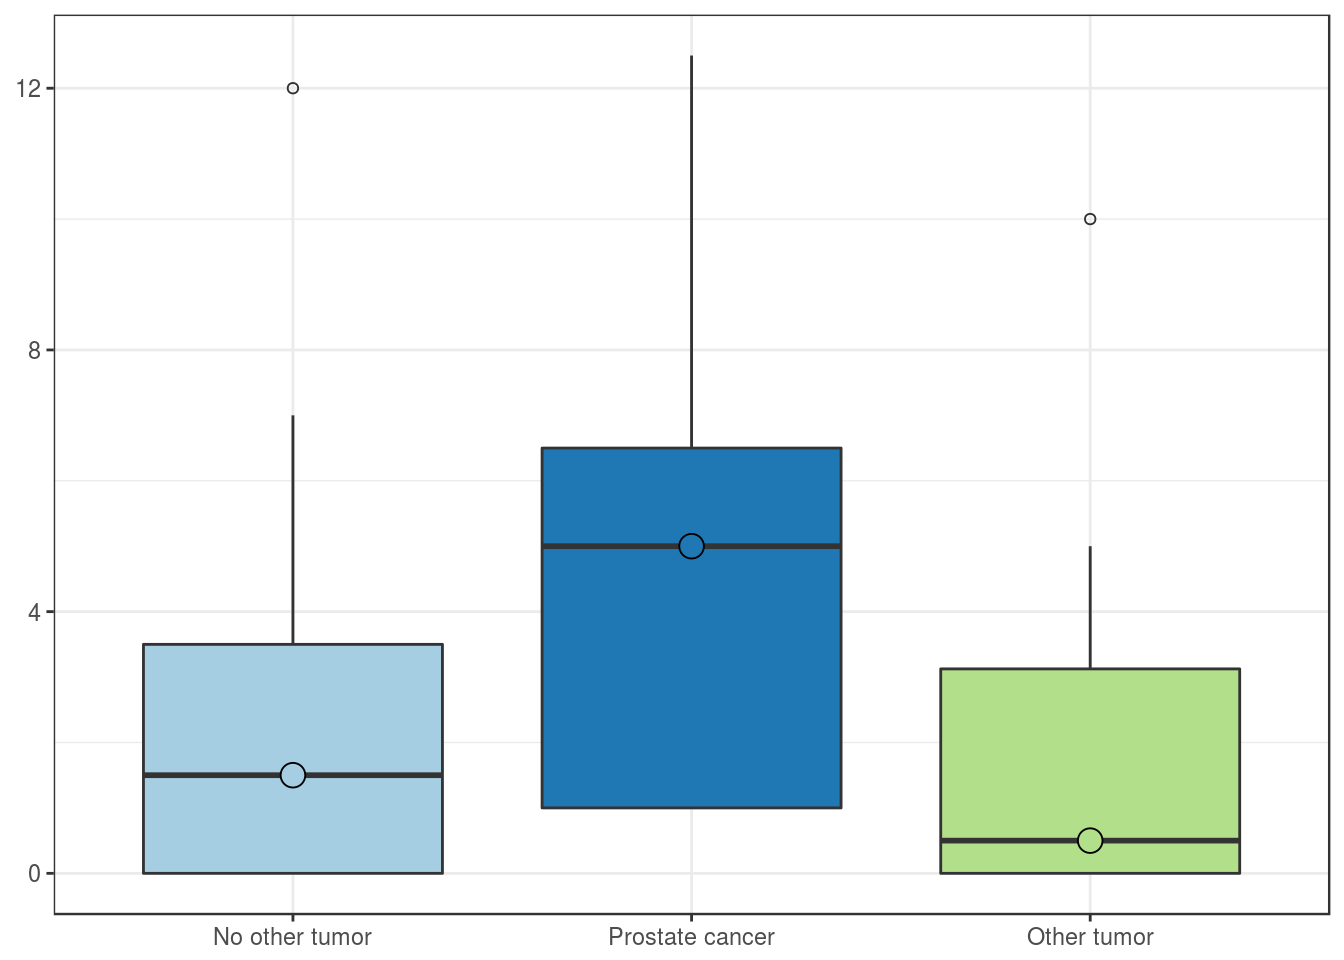
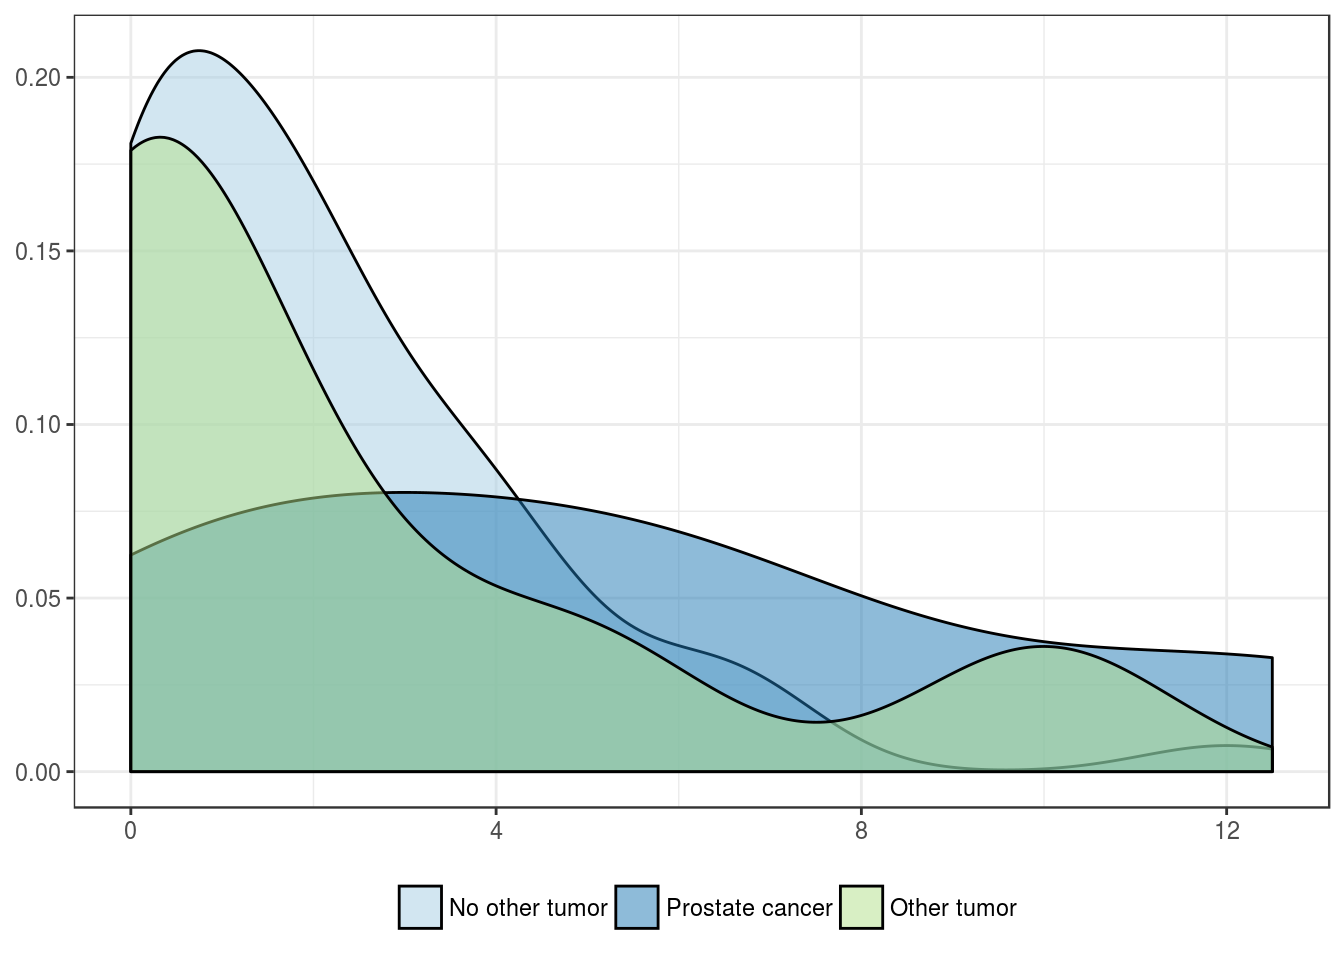
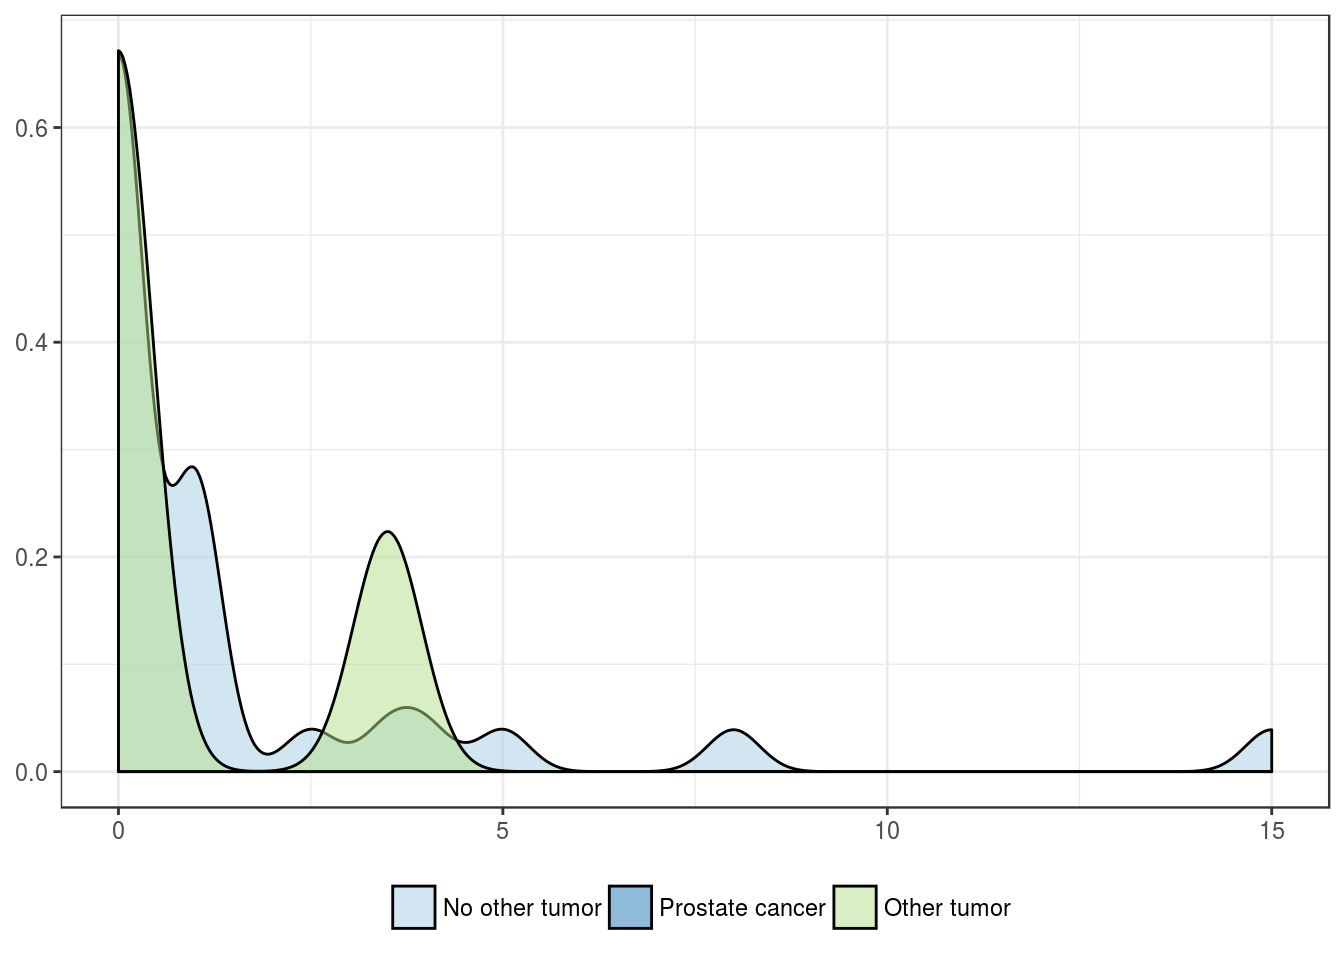
History of other malignancies
| No other tumor | Prostate cancer | Other tumor | |
|---|---|---|---|
| Mean | 2.1 | 5.2 | 2.3 |
| Standard deviation | 2.3 | 4.8 | 3.6 |
| Median | 1.5 | 5.0 | 0.5 |
| Interquartile range | 3.5 | 5.5 | 3.1 |
| Minimum | 0.0 | 1.0 | 0.0 |
| Maximum | 12.0 | 12.5 | 10.0 |
| Value | |
|---|---|
| Statistic | 3.292 |
| Parameter | 2 |
| P statistic | 0.19 |
Pathologic features
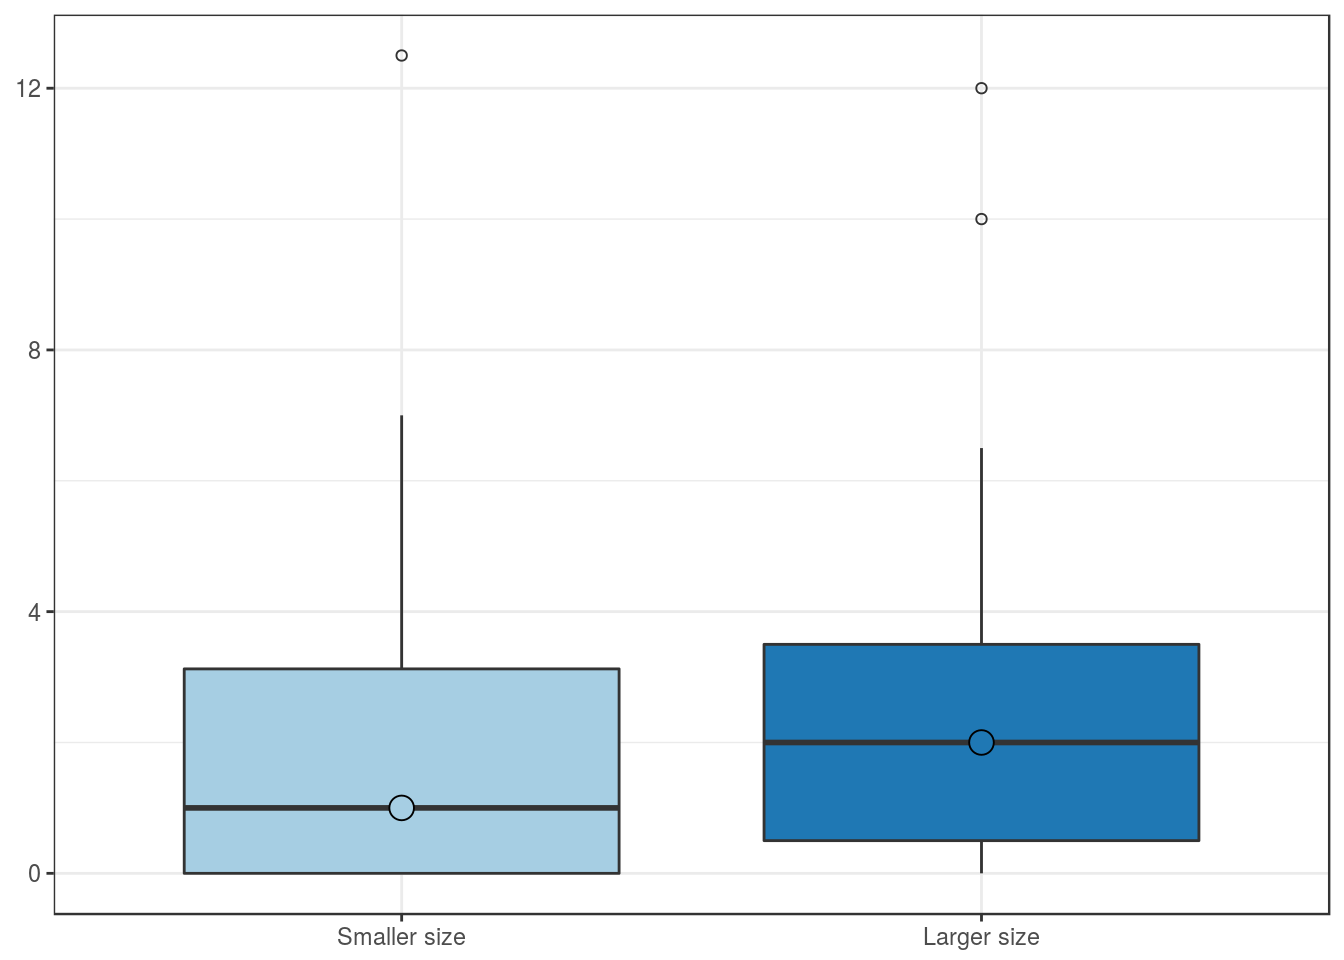
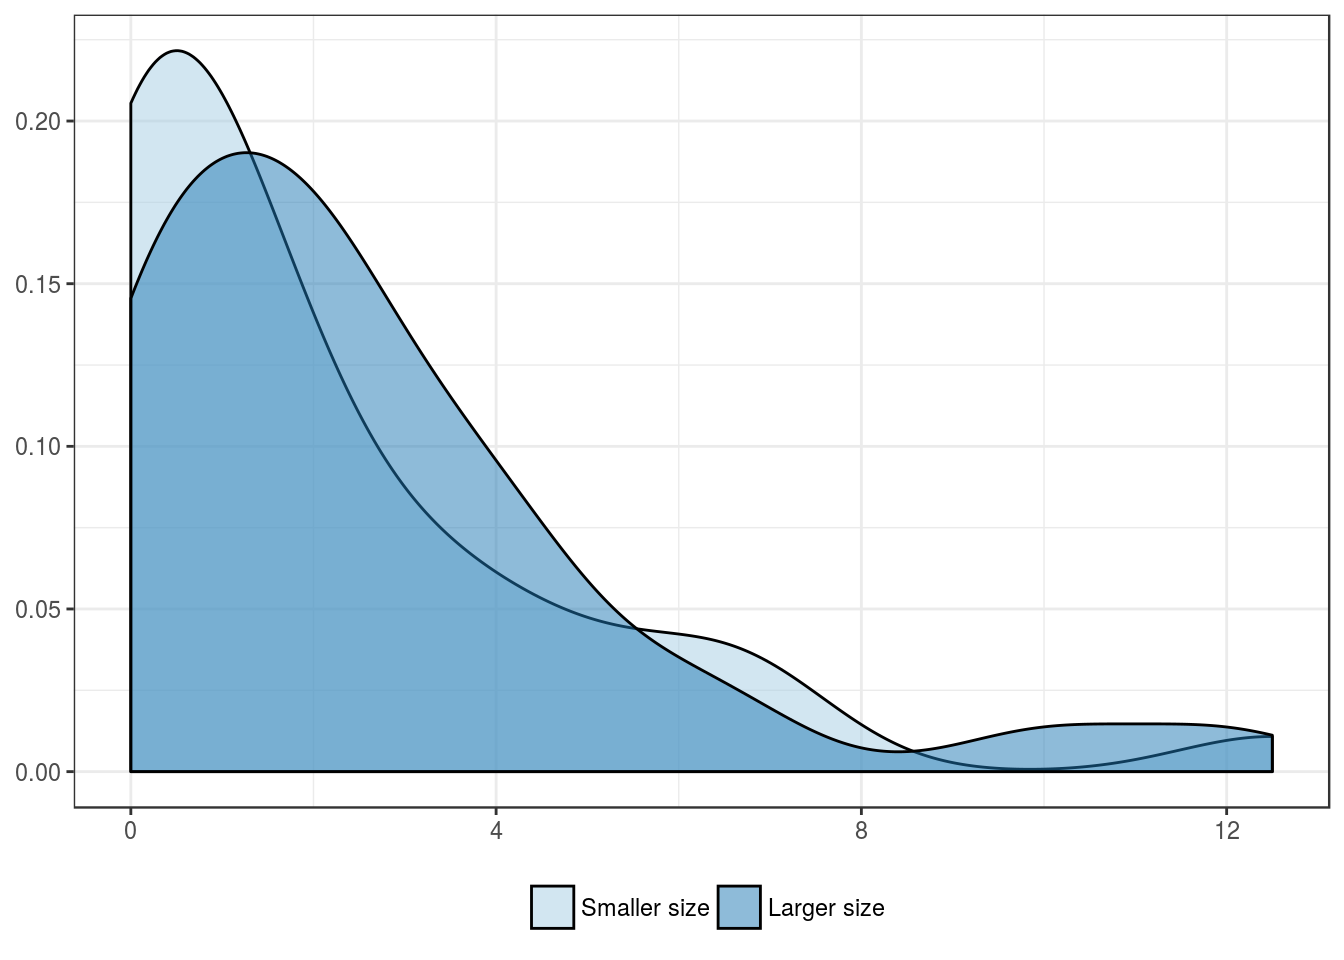
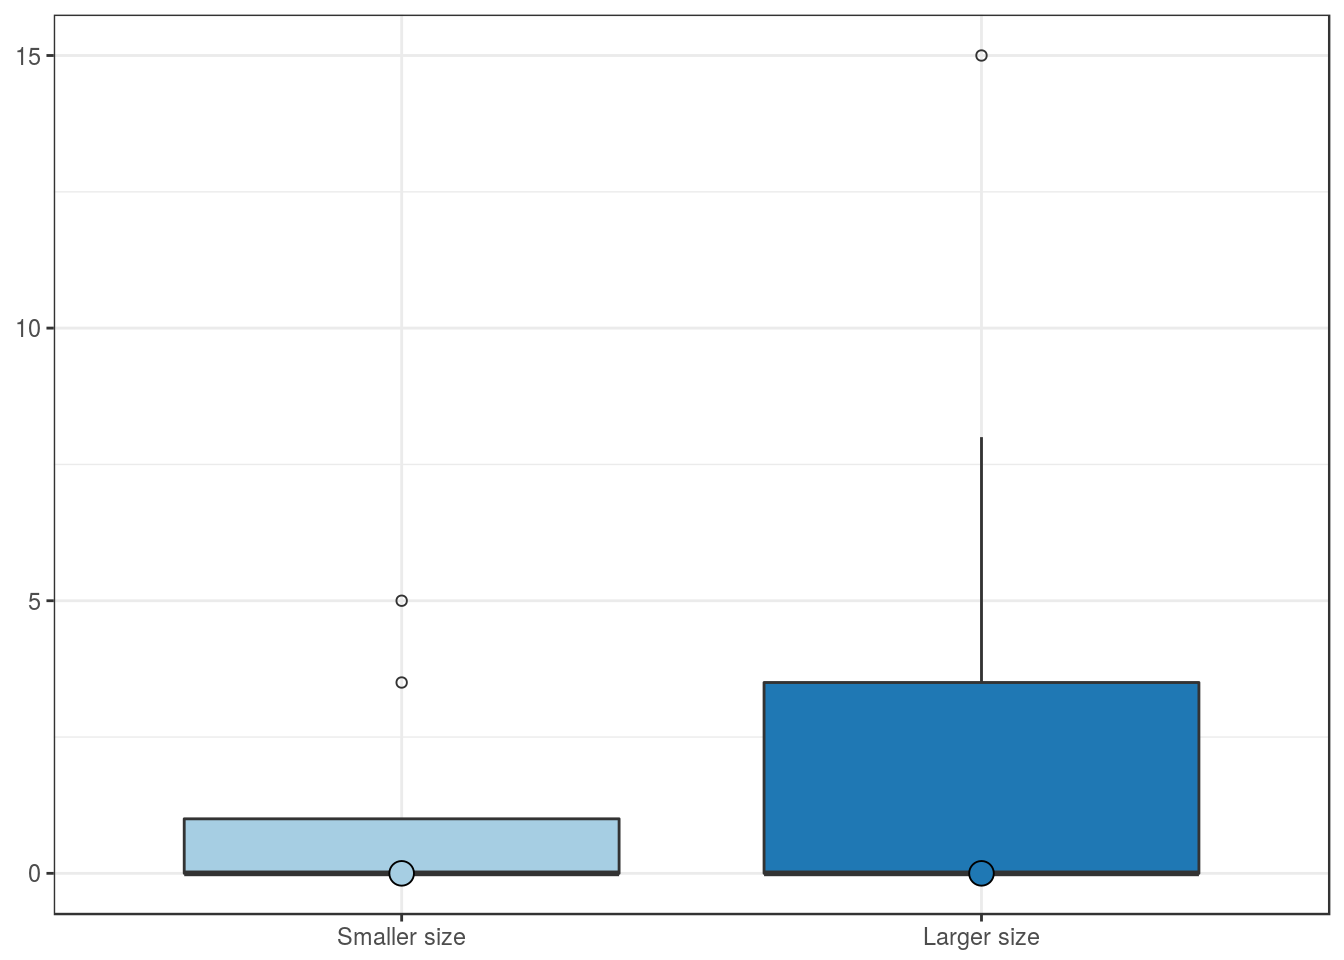
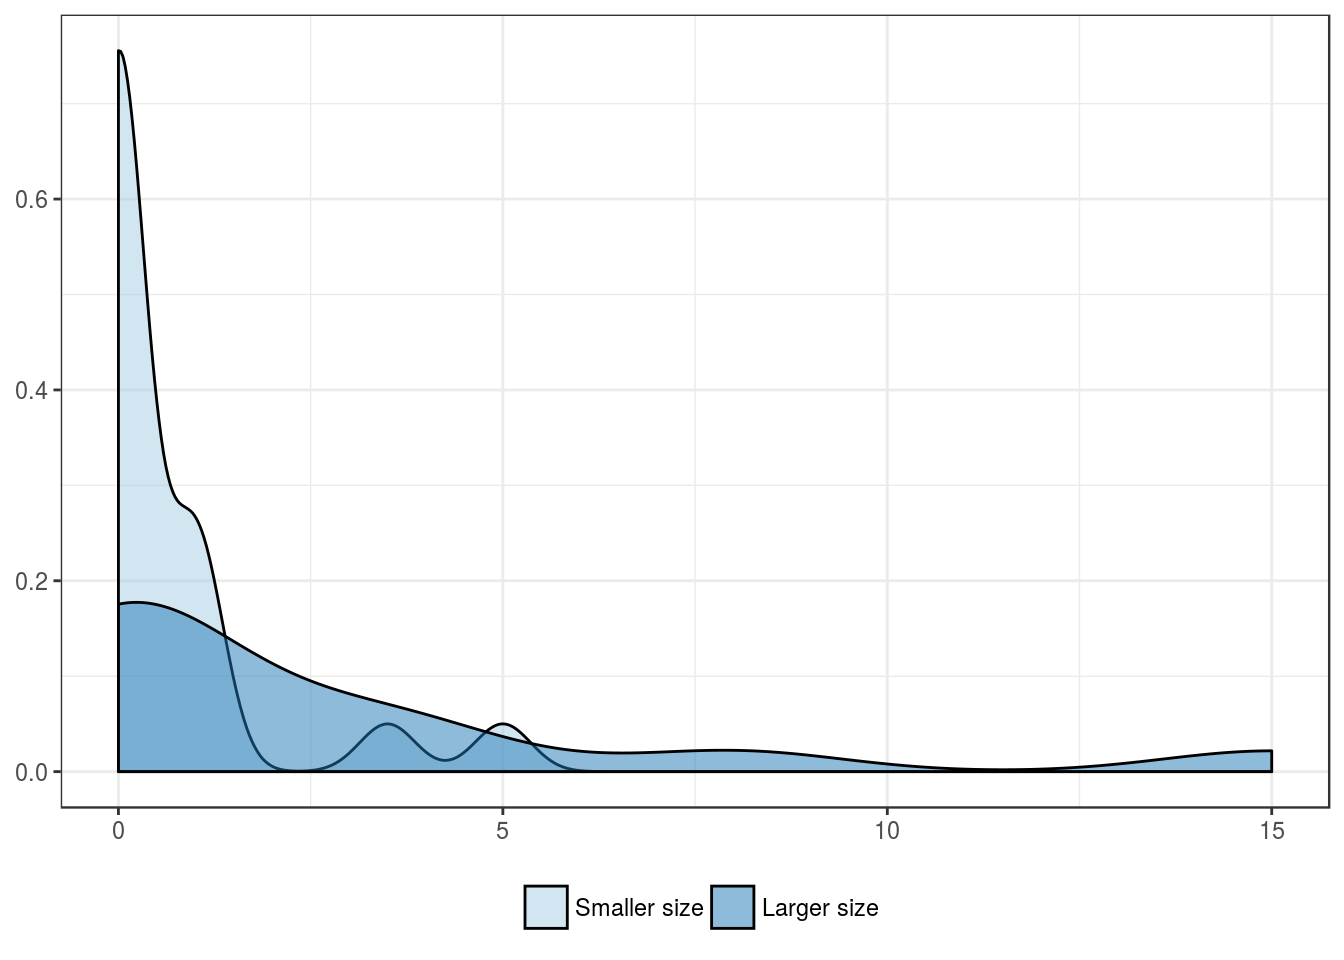
Tumor size group
| Smaller size | Larger size | |
|---|---|---|
| Mean | 2.1 | 2.6 |
| Standard deviation | 2.8 | 2.8 |
| Median | 1.0 | 2.0 |
| Interquartile range | 3.1 | 3.0 |
| Minimum | 0.0 | 0.0 |
| Maximum | 12.5 | 12.0 |
| Value | |
|---|---|
| U-statistic | 482 |
| P statistic | 1.8e-01 |
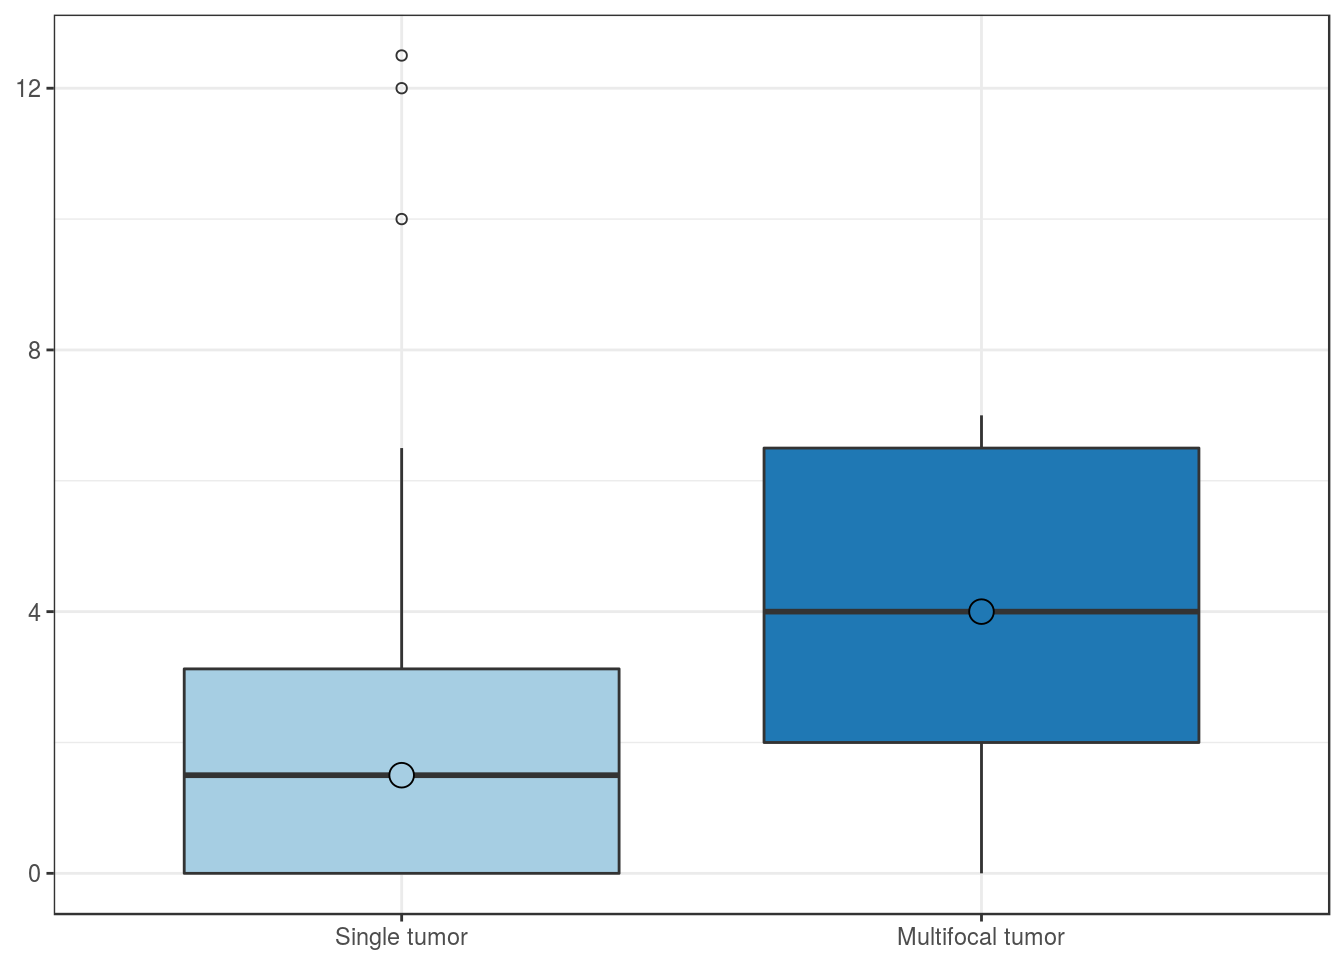
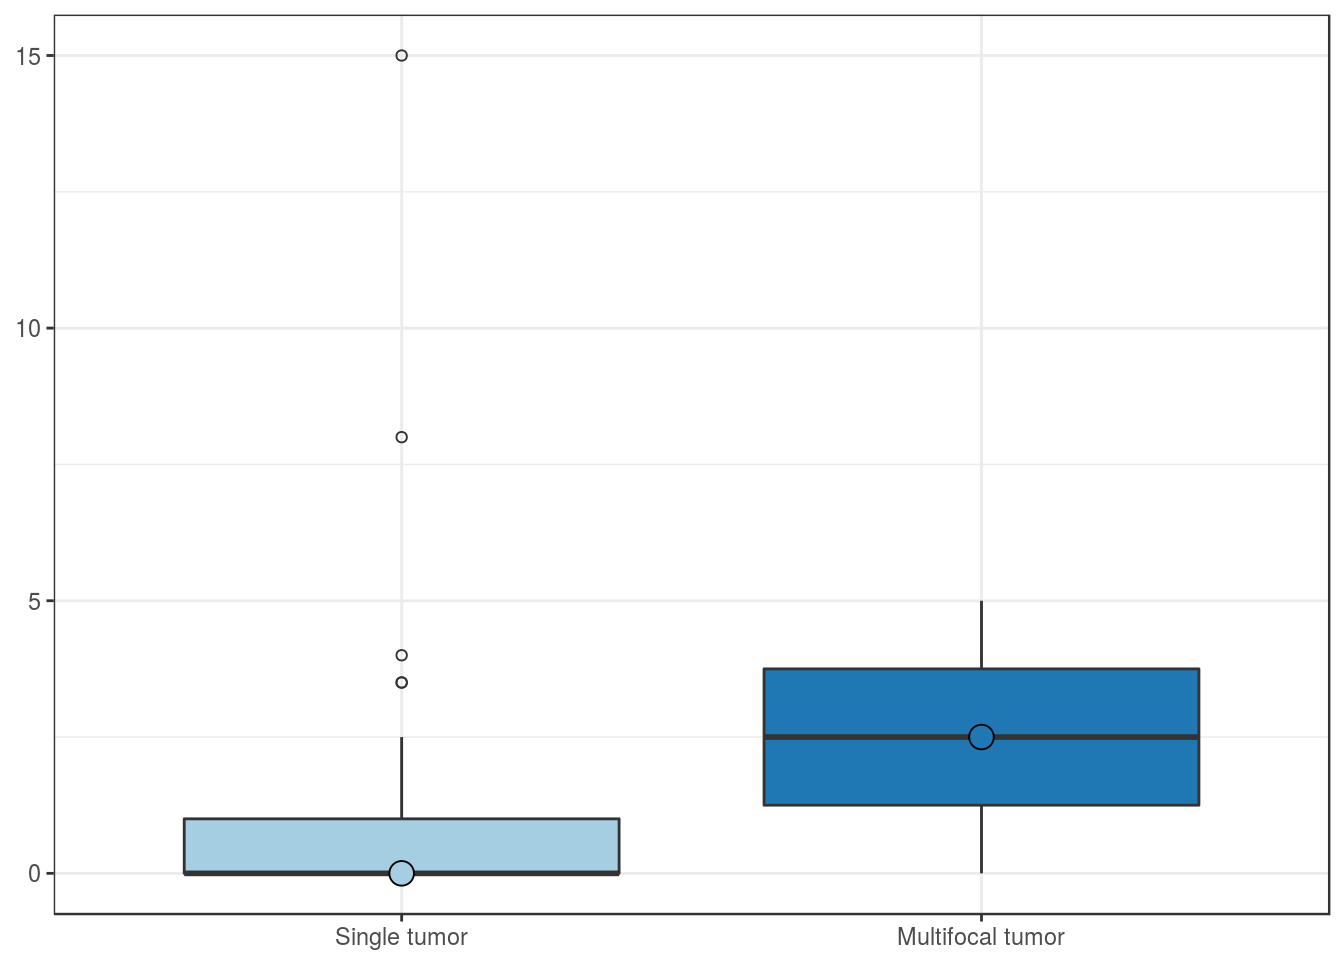
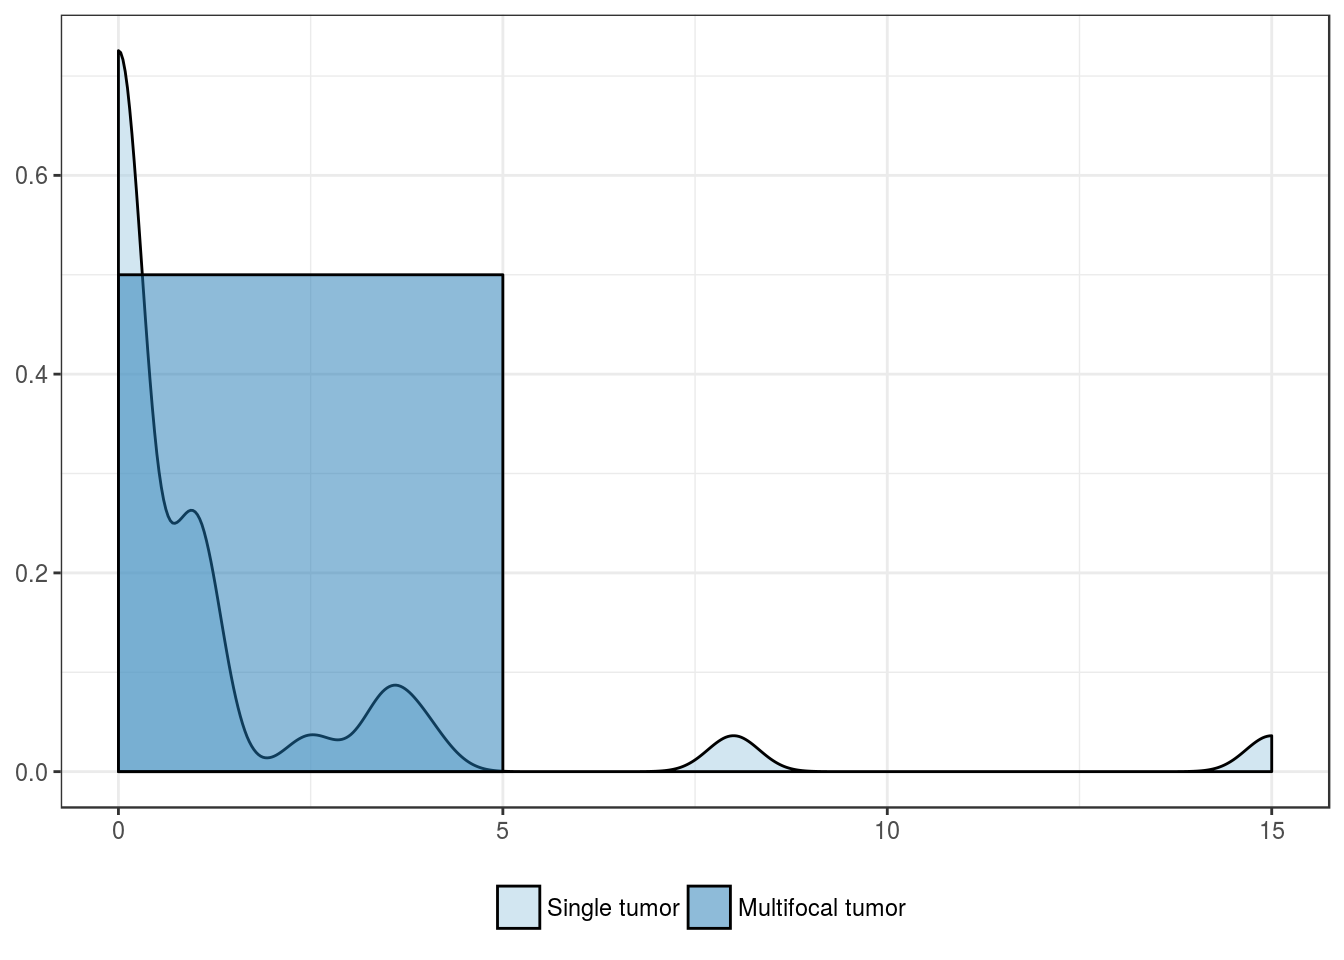
Multifocality
| Single tumor | Multifocal tumor | |
|---|---|---|
| Mean | 2.2 | 3.8 |
| Standard deviation | 2.8 | 2.6 |
| Median | 1.5 | 4.0 |
| Interquartile range | 3.1 | 4.5 |
| Minimum | 0.0 | 0.0 |
| Maximum | 12.5 | 7.0 |
| Value | |
|---|---|
| U-statistic | 155 |
| P statistic | 3.9e-02 |
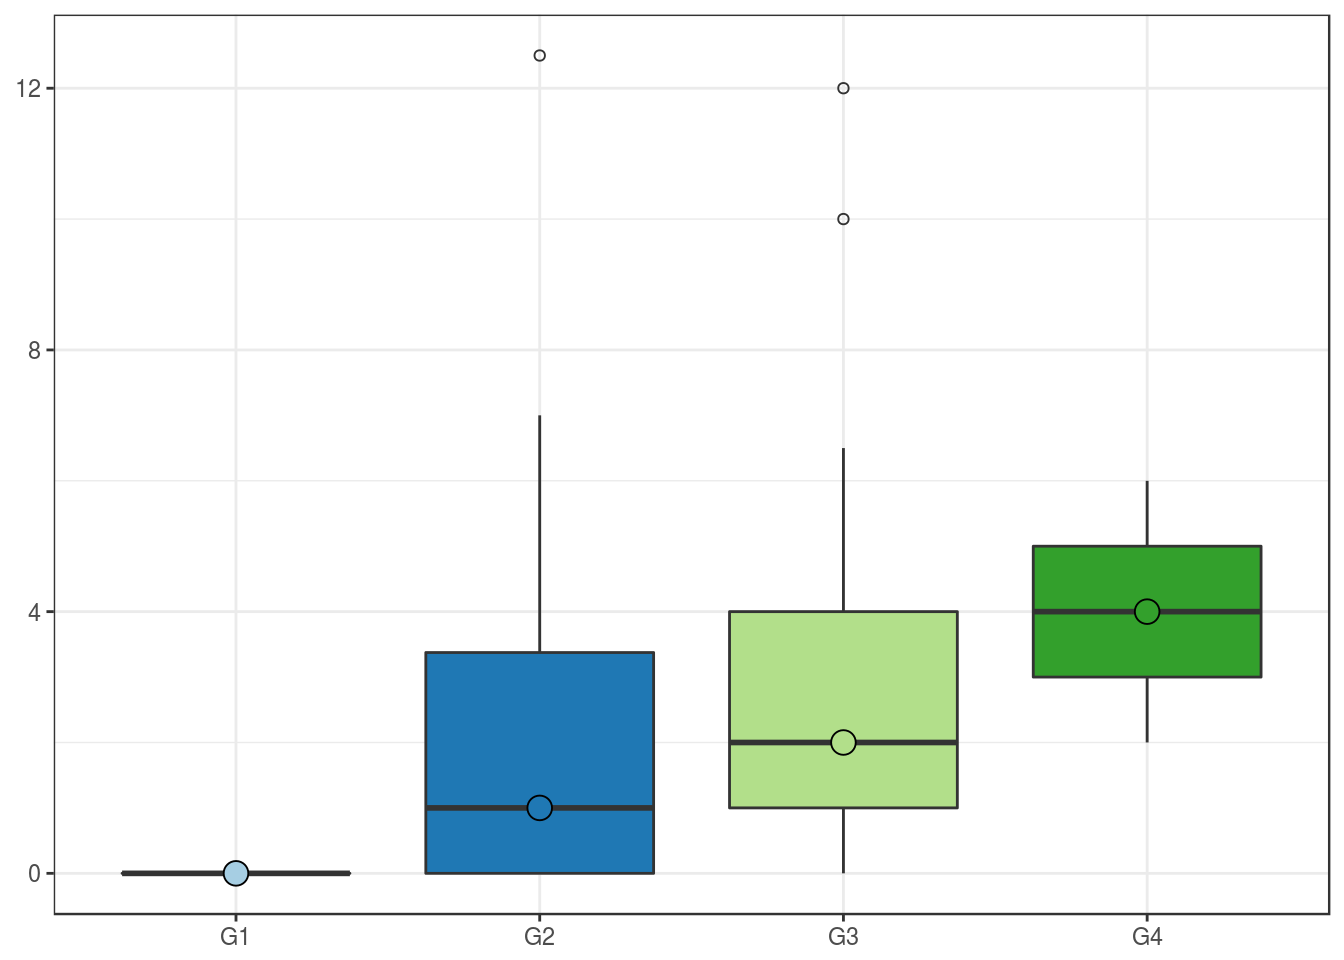
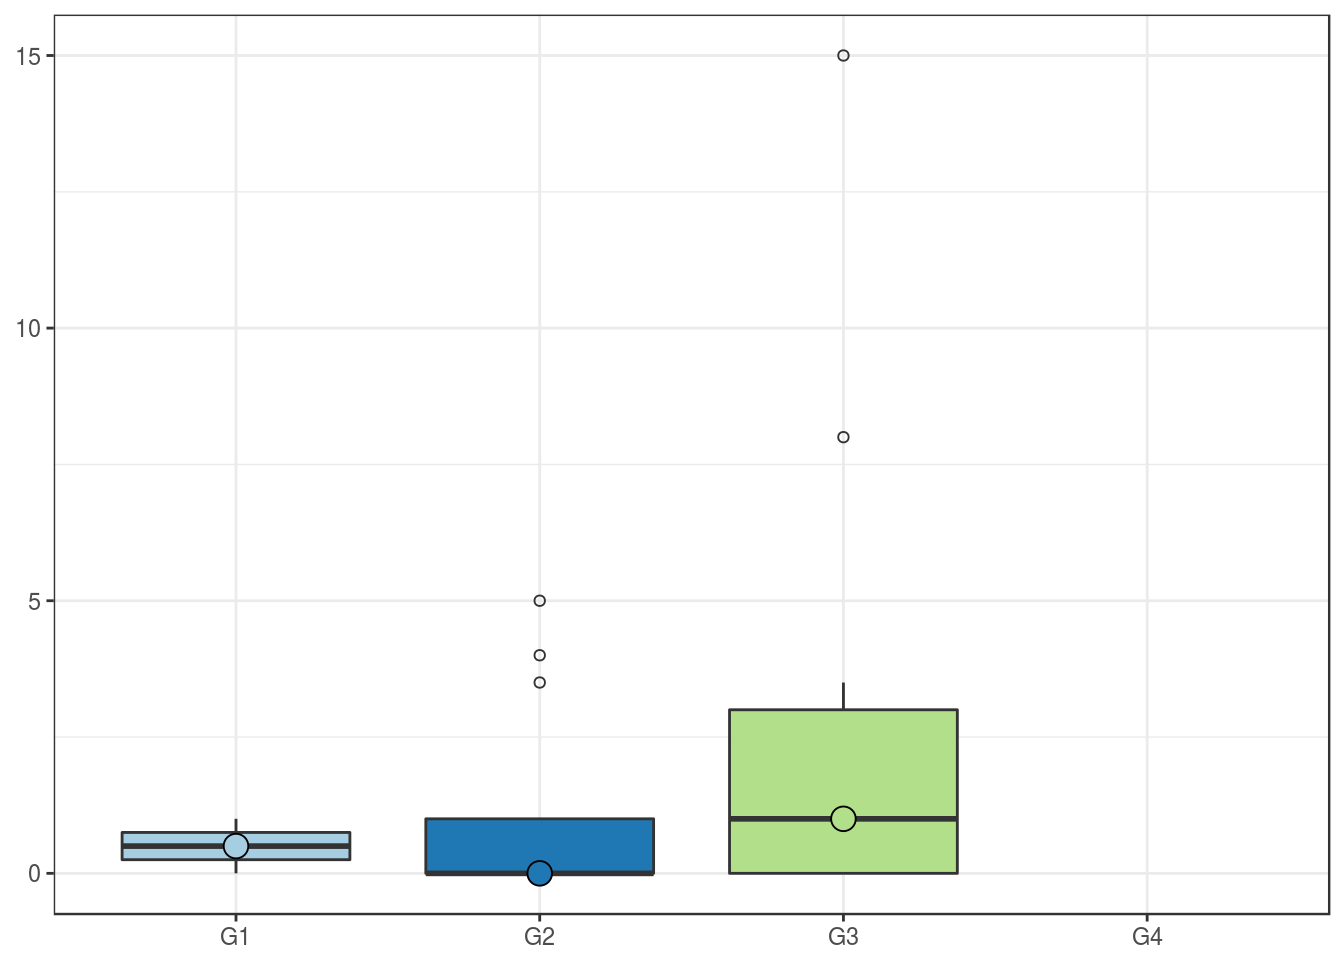
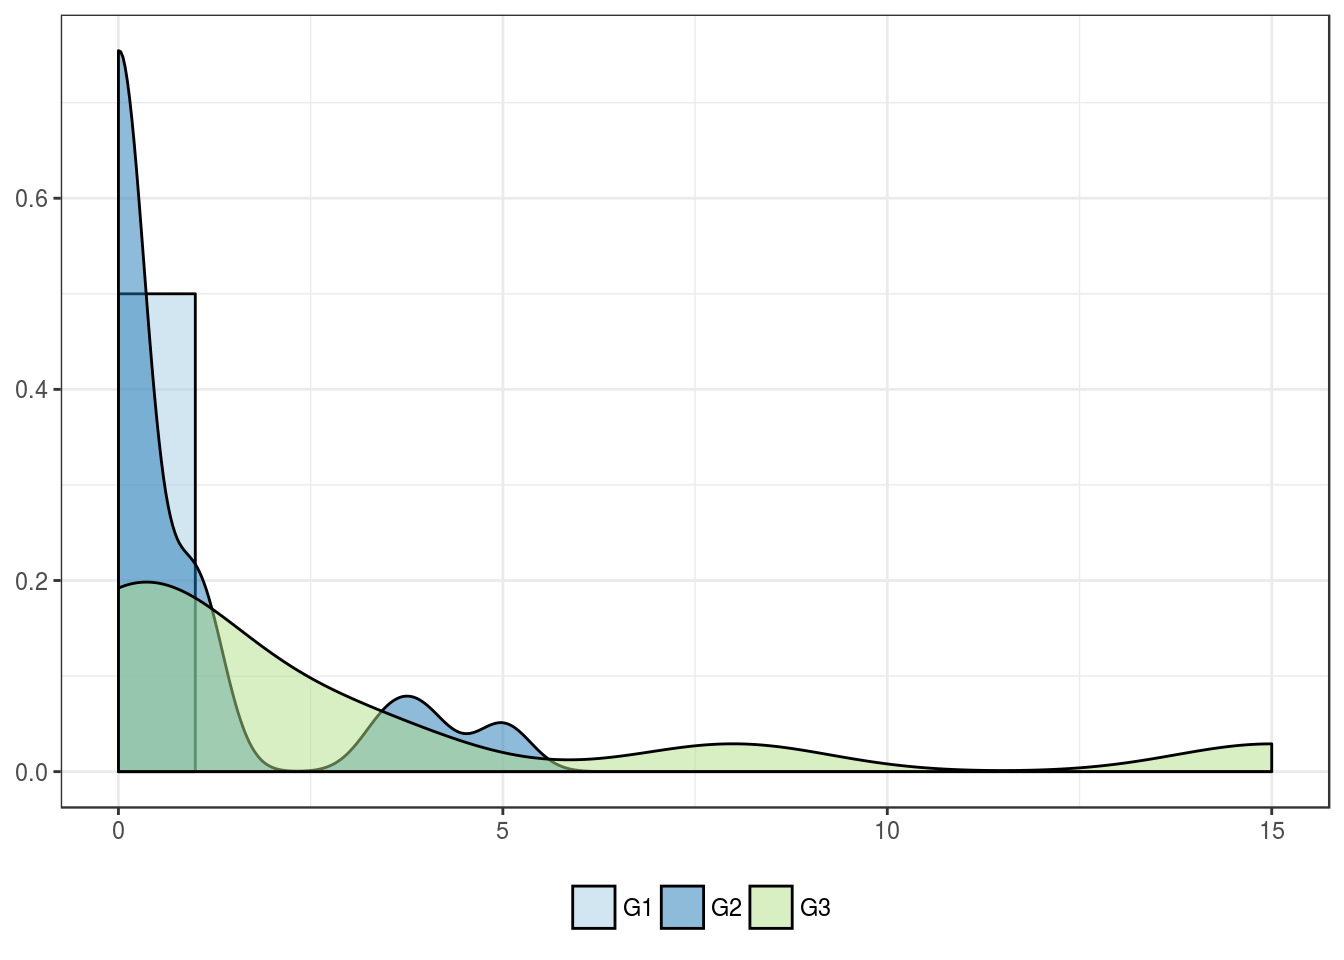
Fuhrman grade
| G1 | G2 | G3 | G4 | |
|---|---|---|---|---|
| Mean | 0 | 2.0 | 3.1 | 4.0 |
| Standard deviation | 0 | 2.5 | 3.1 | 2.8 |
| Median | 0 | 1.0 | 2.0 | 4.0 |
| Interquartile range | 0 | 3.4 | 3.0 | 2.0 |
| Minimum | 0 | 0.0 | 0.0 | 2.0 |
| Maximum | 0 | 12.5 | 12.0 | 6.0 |
| Value | |
|---|---|
| Statistic | 7.476 |
| Parameter | 3 |
| P statistic | 0.058 |
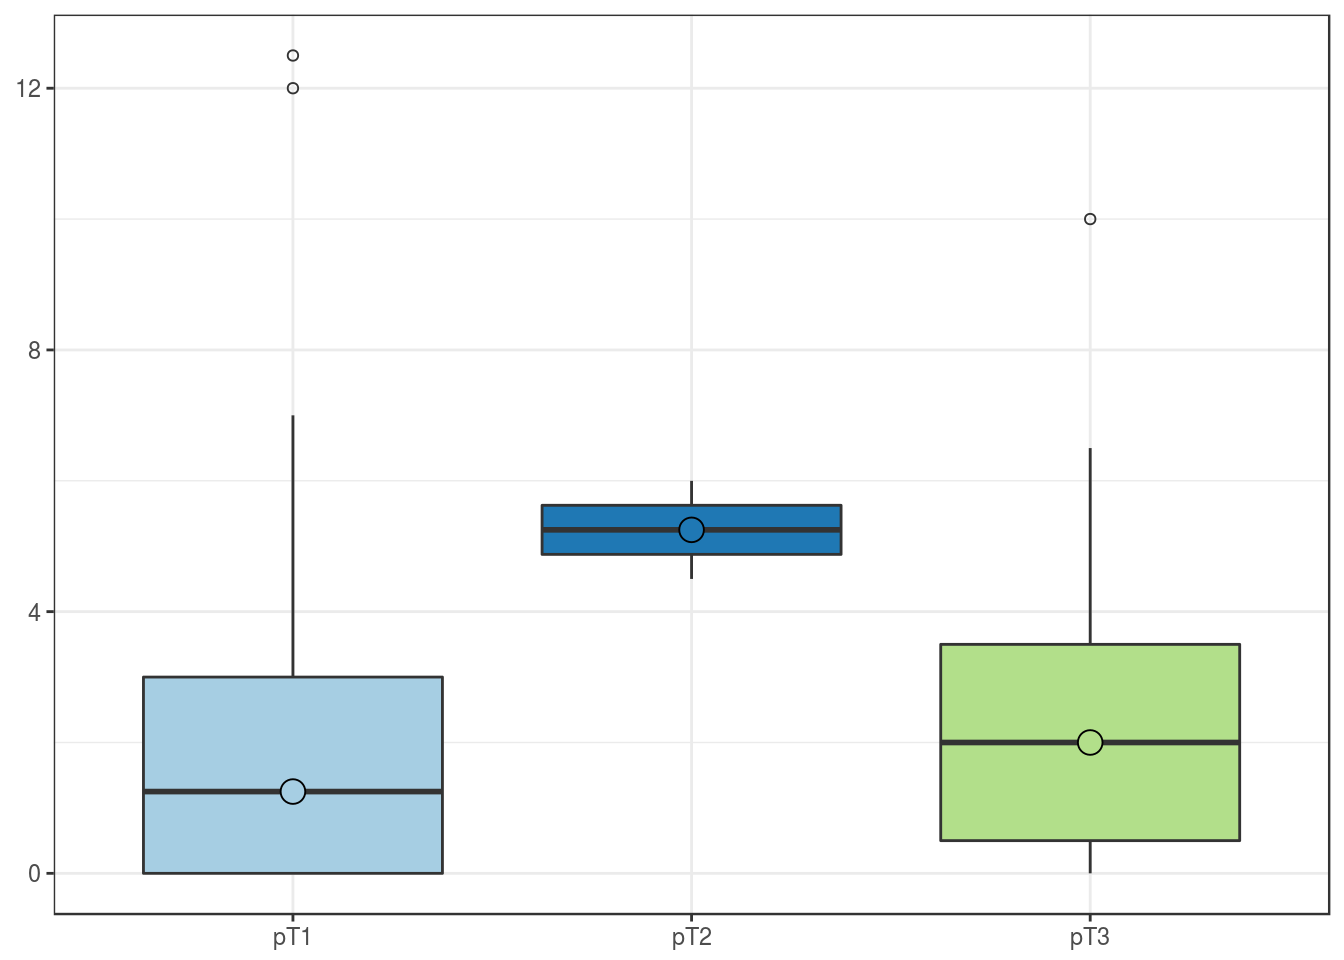
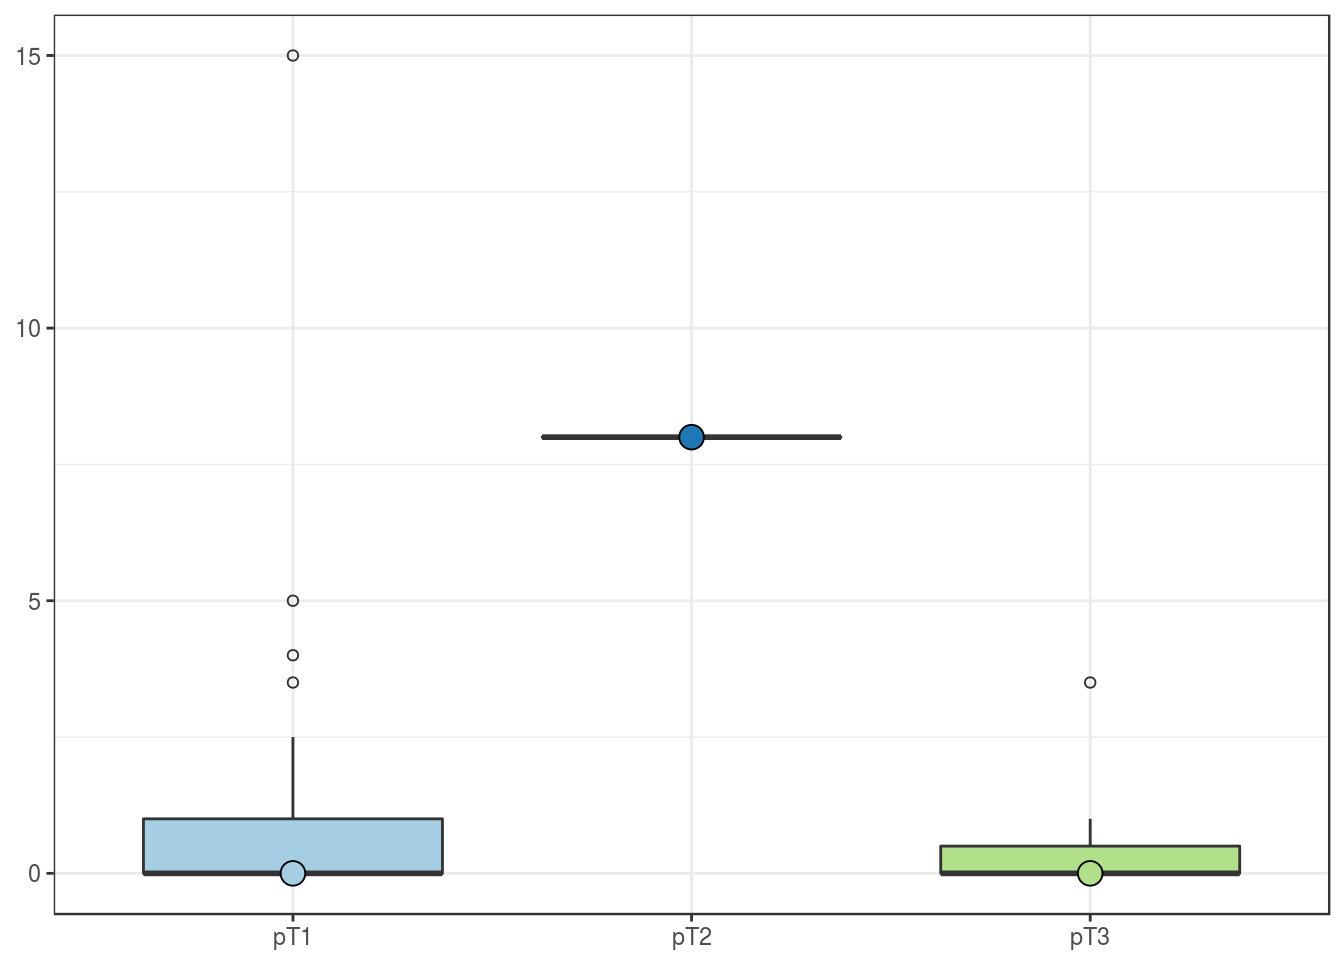
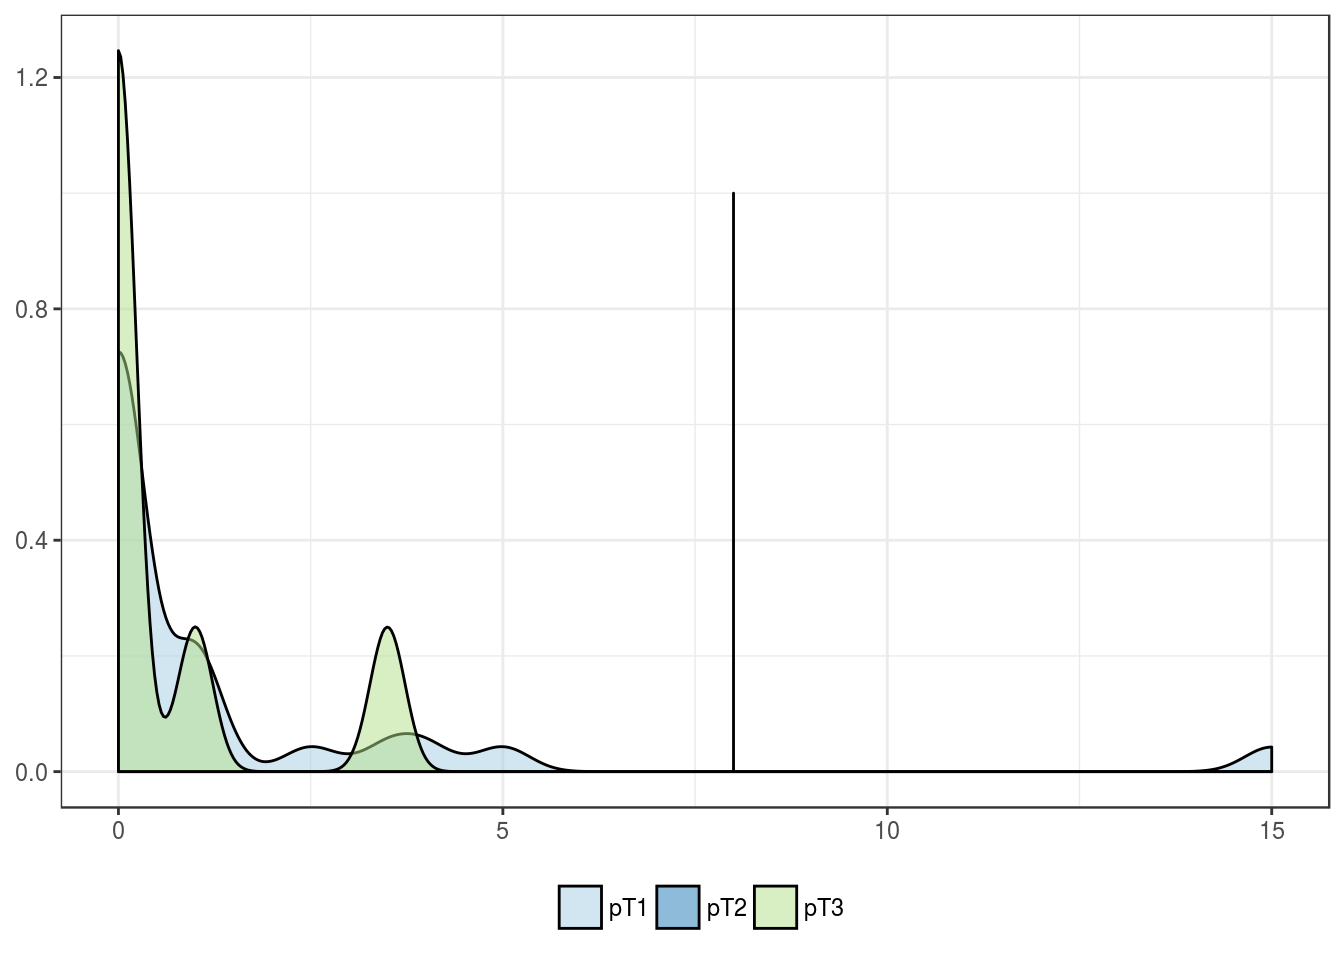
pT stage
| pT1 | pT2 | pT3 | |
|---|---|---|---|
| Mean | 2.1 | 5.2 | 2.5 |
| Standard deviation | 2.8 | 1.1 | 2.6 |
| Median | 1.2 | 5.2 | 2.0 |
| Interquartile range | 3.0 | 0.8 | 3.0 |
| Minimum | 0.0 | 4.5 | 0.0 |
| Maximum | 12.5 | 6.0 | 10.0 |
| Value | |
|---|---|
| Statistic | 4.189 |
| Parameter | 2 |
| P statistic | 0.12 |
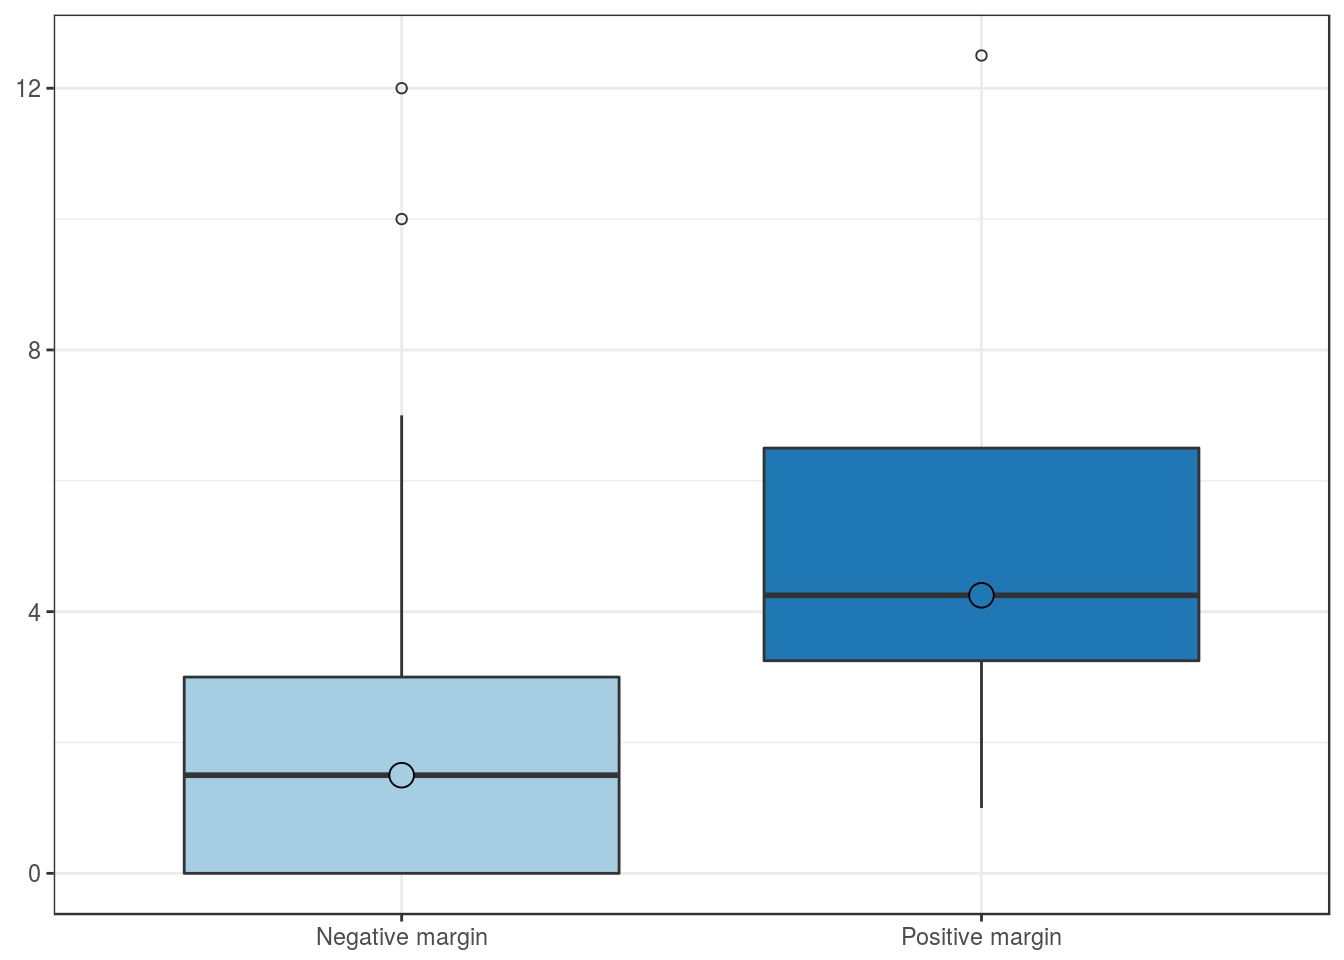
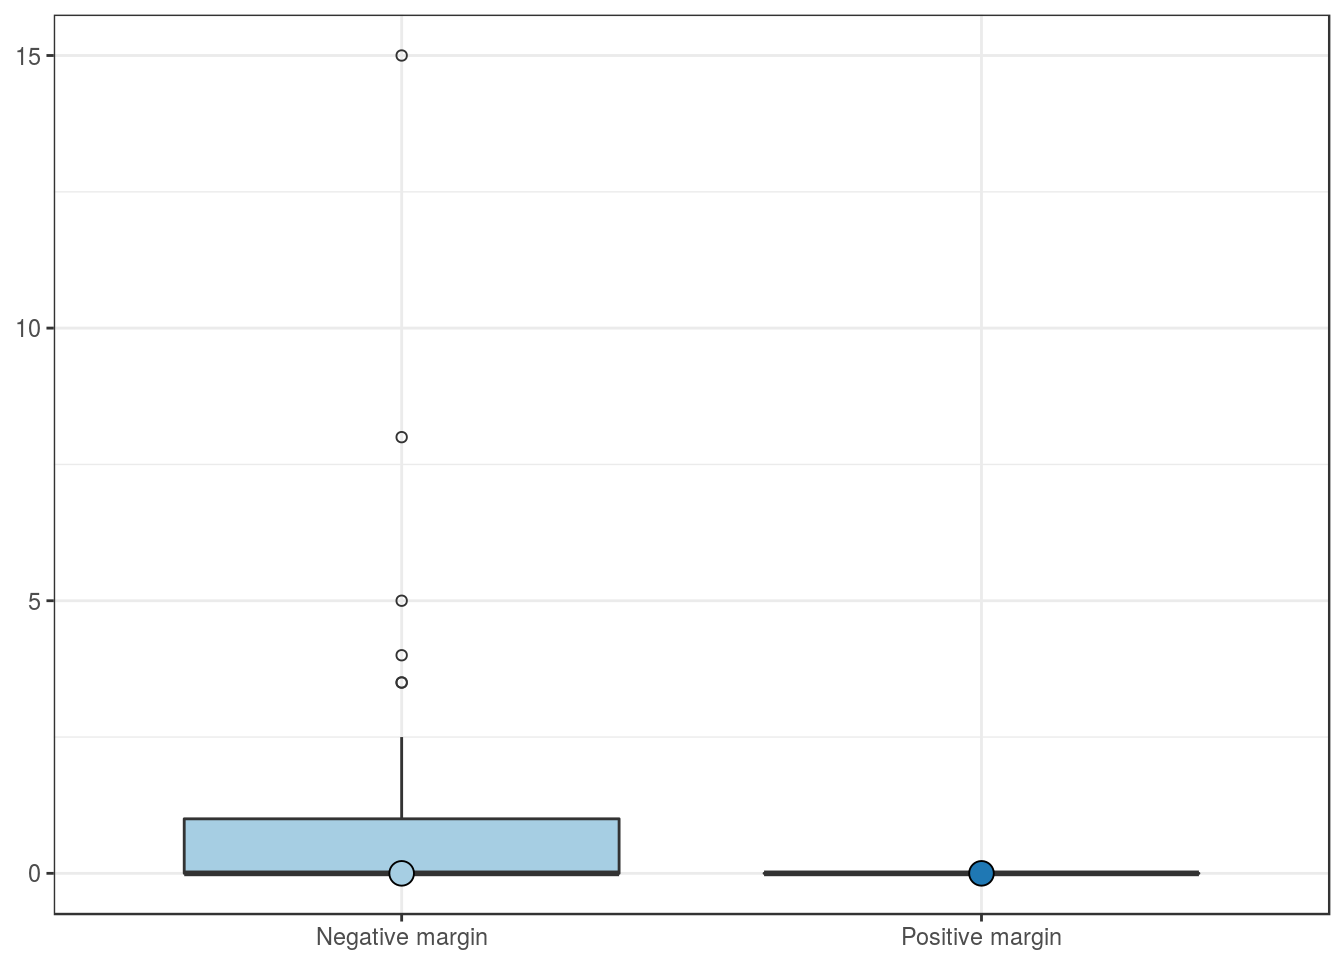
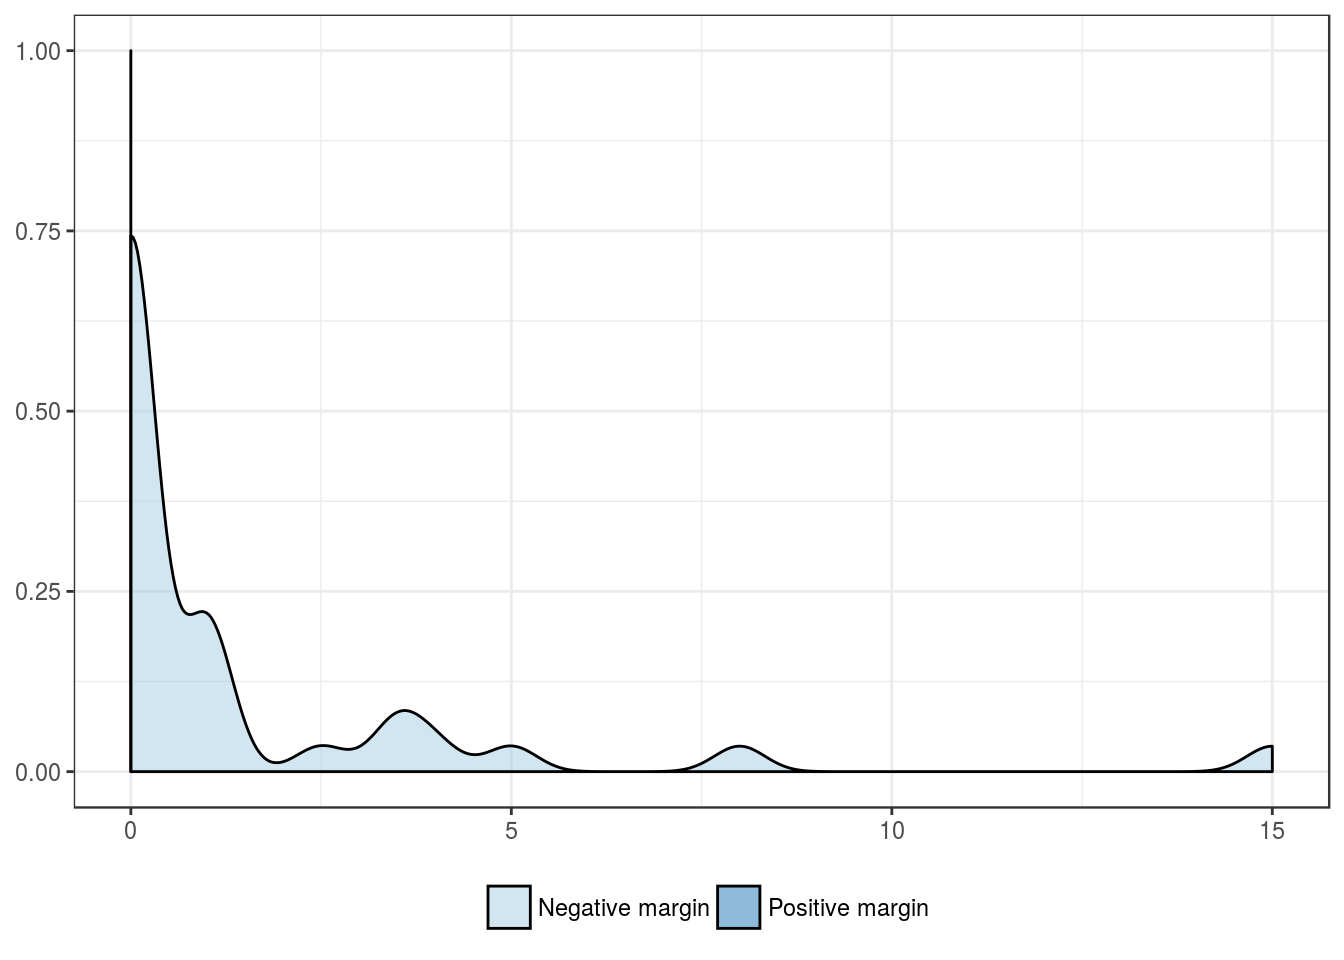
Surgical margin
| Negative margin | Positive margin | |
|---|---|---|
| Mean | 2.1 | 5.5 |
| Standard deviation | 2.5 | 4.9 |
| Median | 1.5 | 4.2 |
| Interquartile range | 3.0 | 3.2 |
| Minimum | 0.0 | 1.0 |
| Maximum | 12.0 | 12.5 |
| Value | |
|---|---|
| U-statistic | 58.5 |
| P statistic | 6.5e-02 |
Outcome features
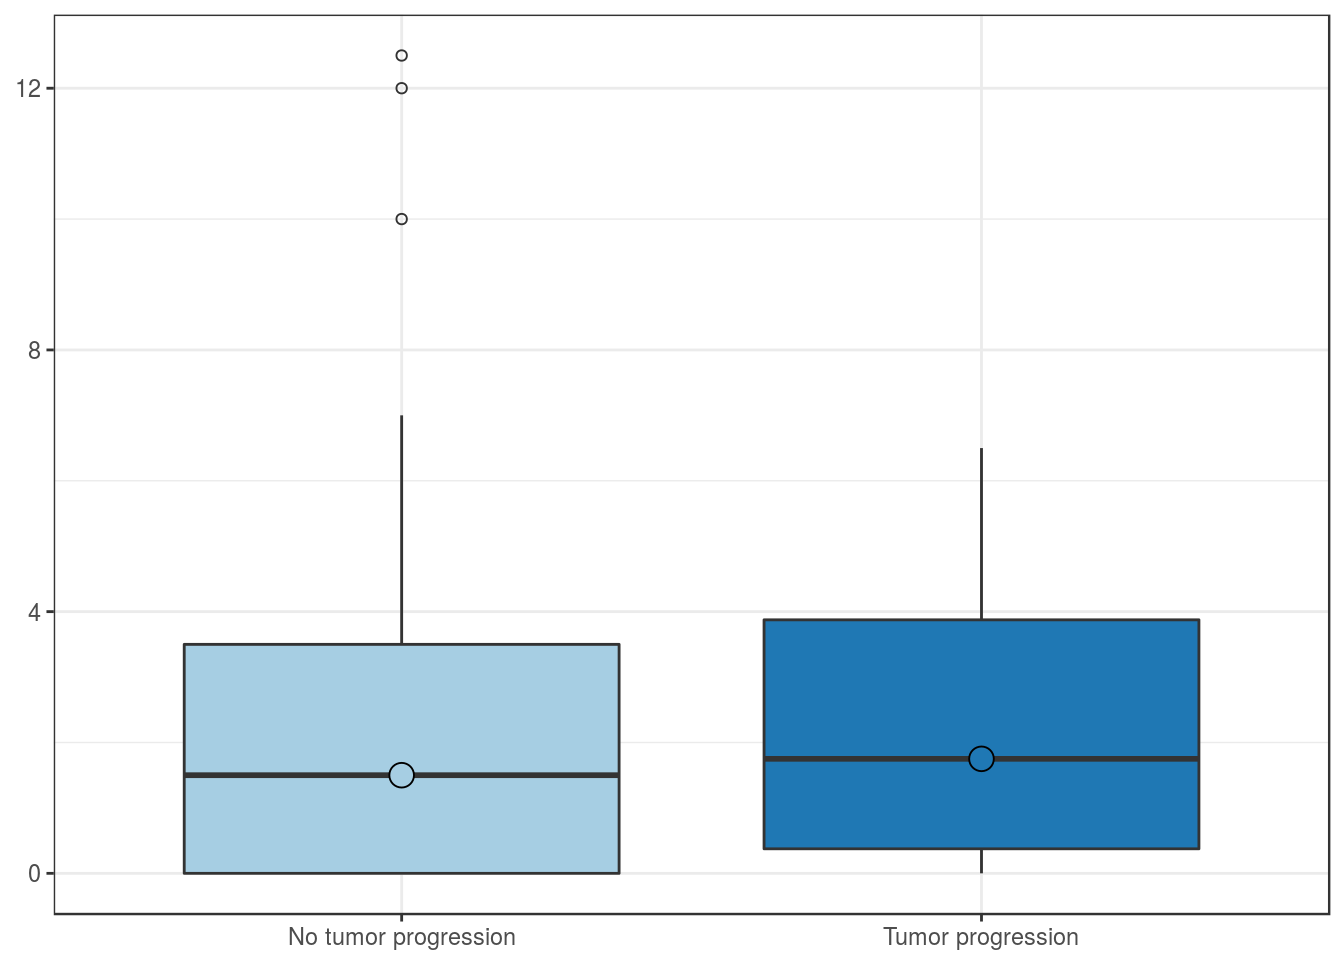
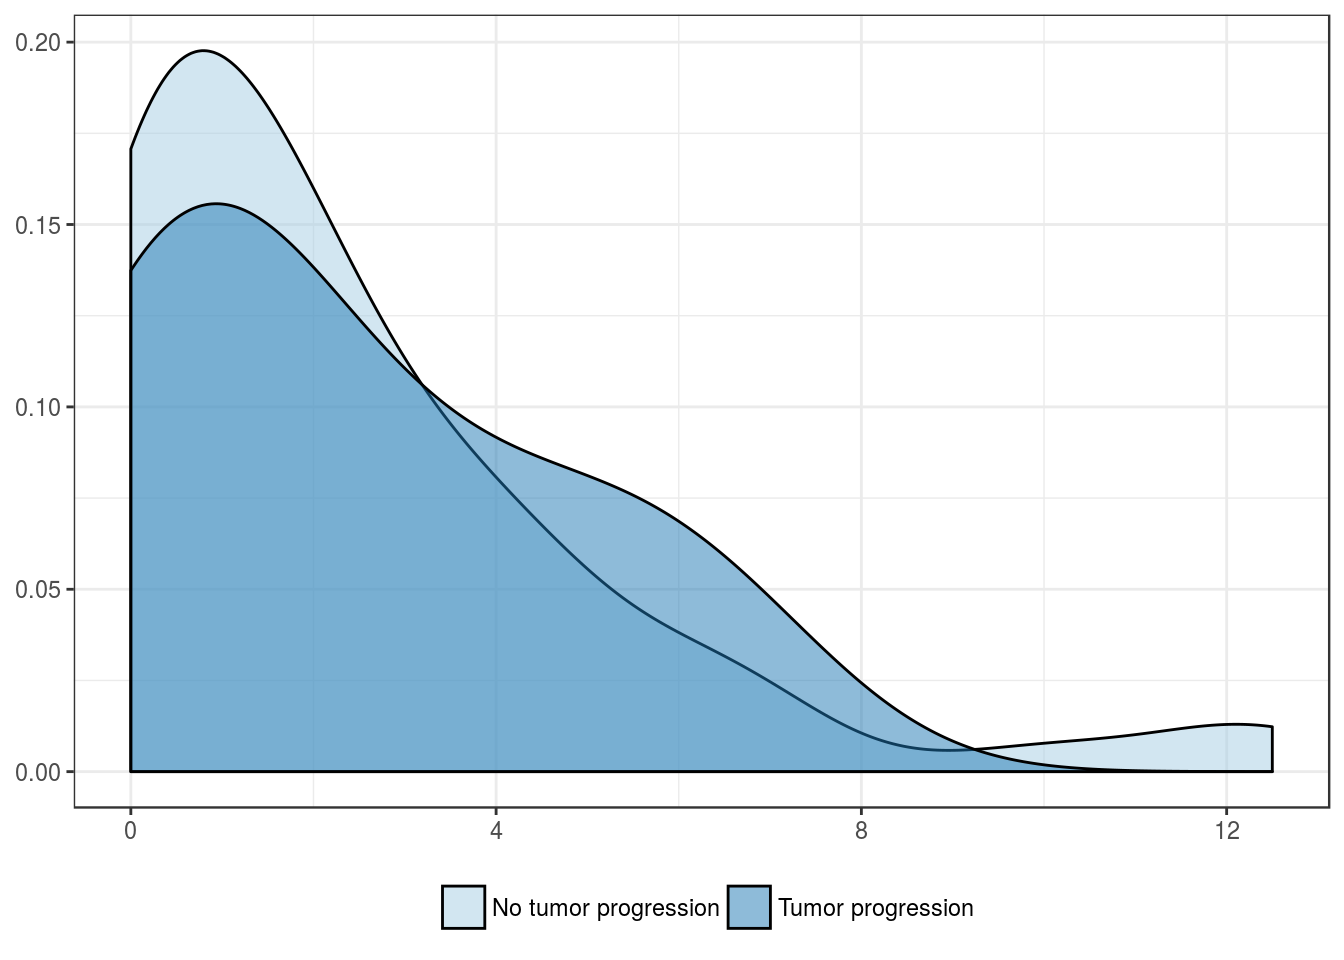
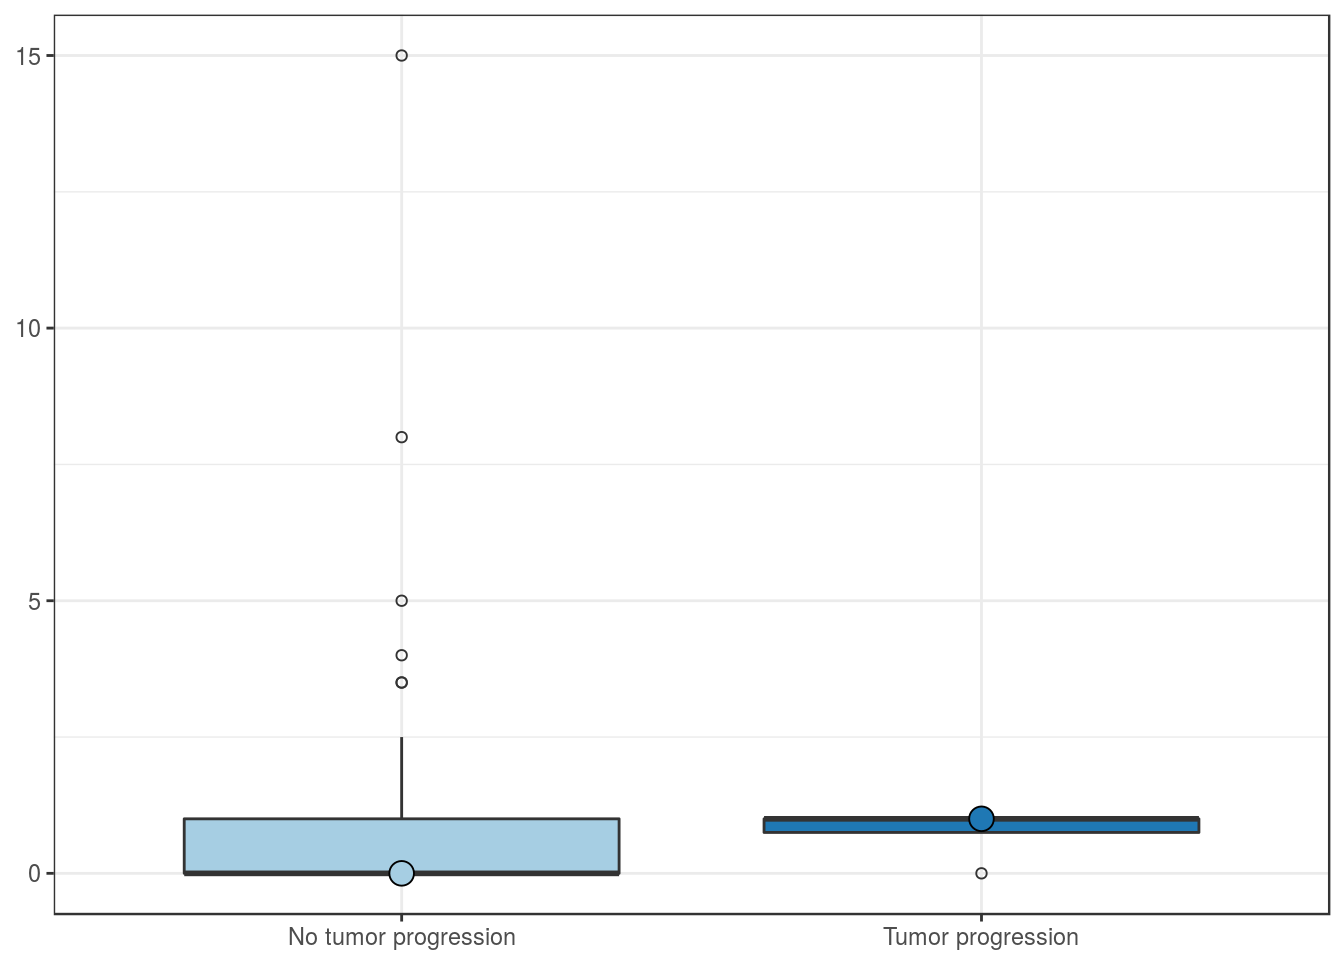
Tumor progression
| No tumor progression | Tumor progression | |
|---|---|---|
| Mean | 2.4 | 2.4 |
| Standard deviation | 2.8 | 2.4 |
| Median | 1.5 | 1.8 |
| Interquartile range | 3.5 | 3.5 |
| Minimum | 0.0 | 0.0 |
| Maximum | 12.5 | 6.5 |
| Value | |
|---|---|
| U-statistic | 234 |
| P statistic | 8.6e-01 |
Overall mortality
| ANOD + AWD | DOC + DOD | |
|---|---|---|
| Mean | 2.3 | 2.6 |
| Standard deviation | 2.9 | 2.3 |
| Median | 1.5 | 2.0 |
| Interquartile range | 3.4 | 3.6 |
| Minimum | 0.0 | 0.0 |
| Maximum | 12.5 | 6.5 |
| Value | |
|---|---|
| U-statistic | 298 |
| P statistic | 4.3e-01 |

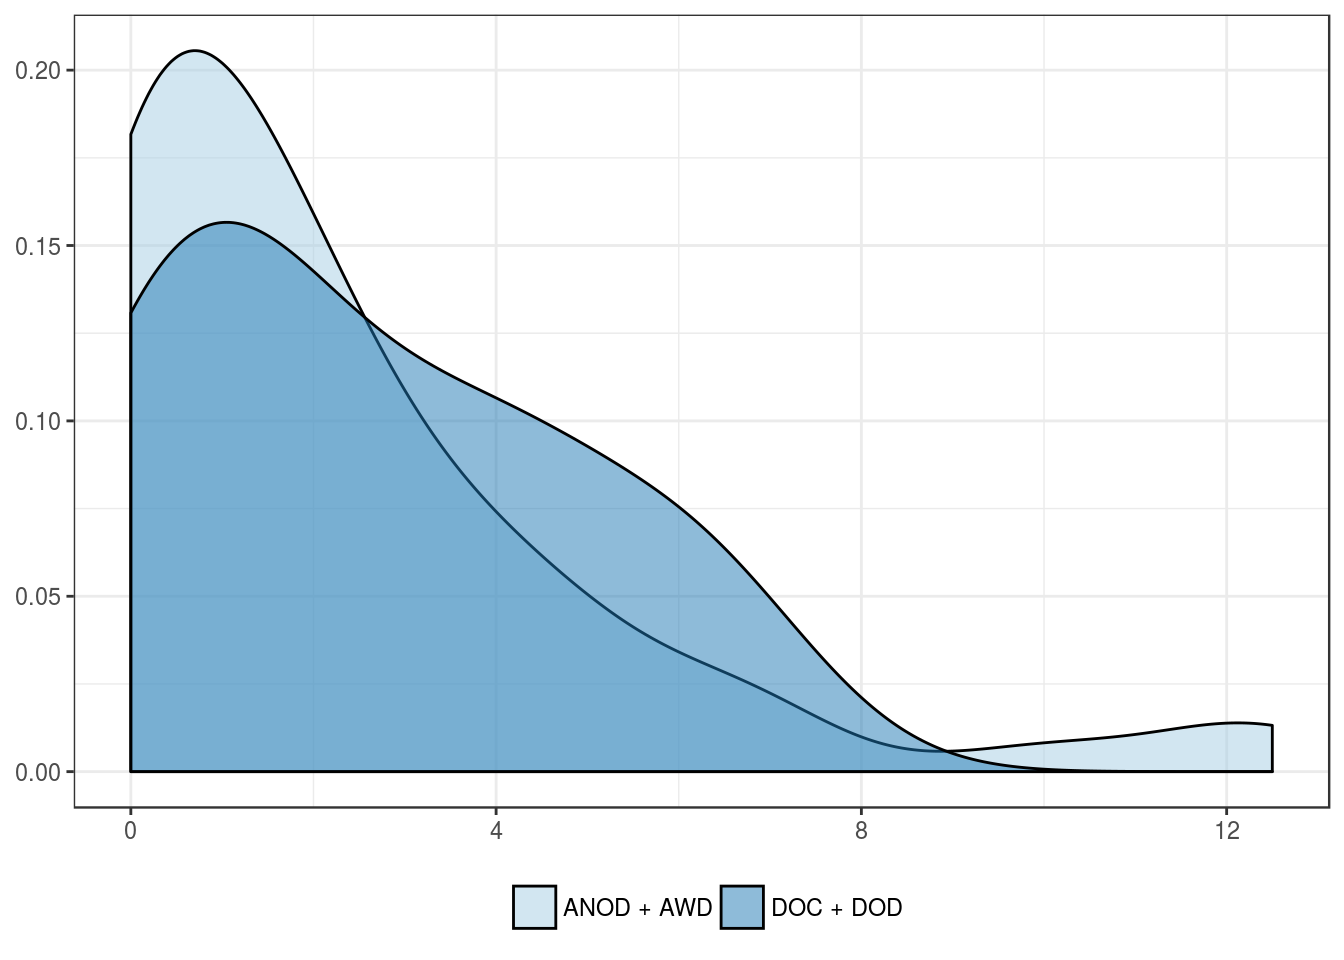
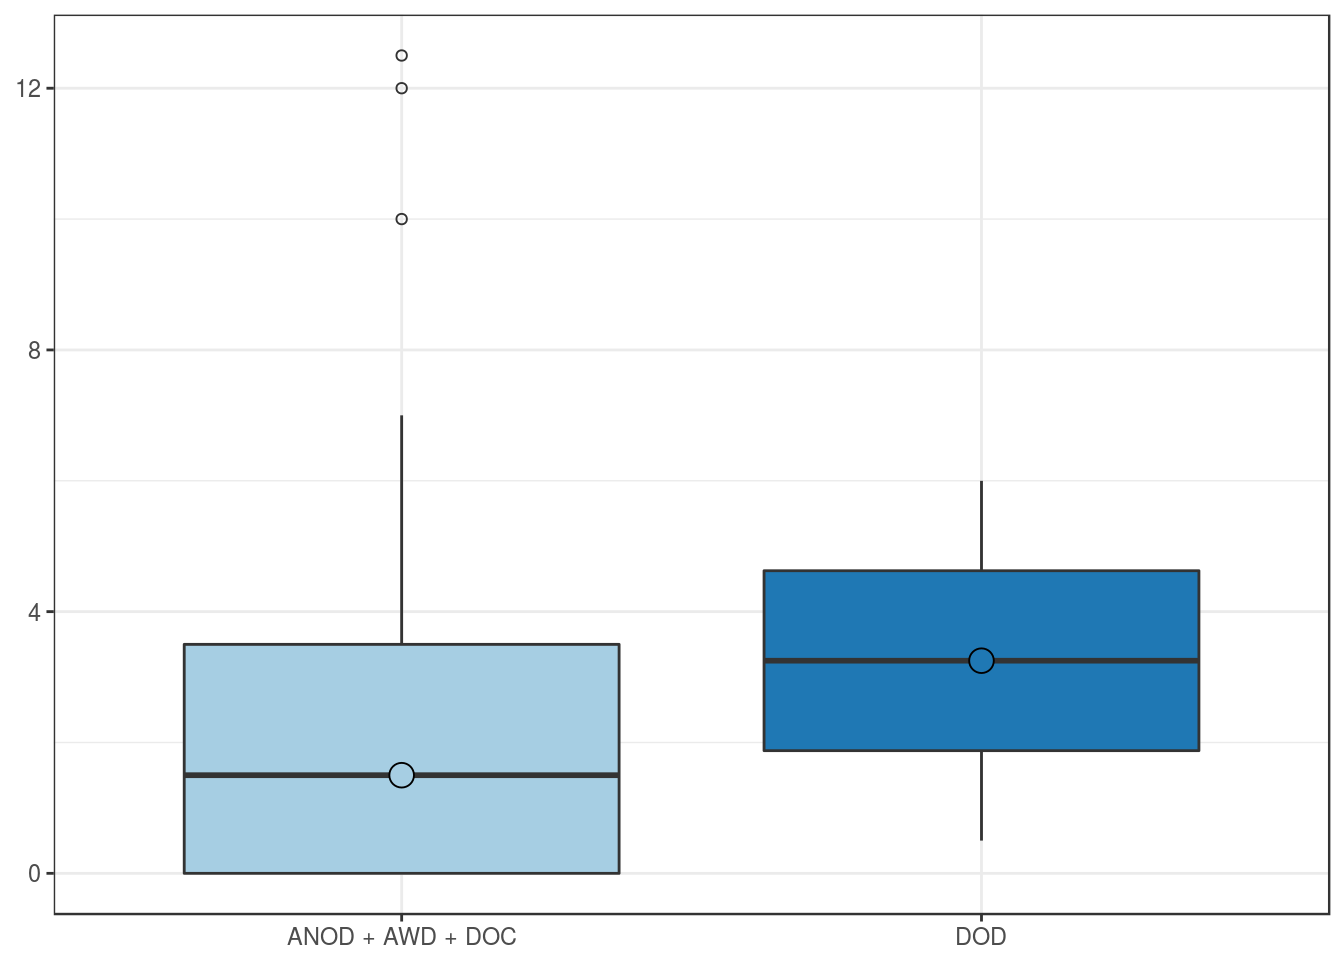
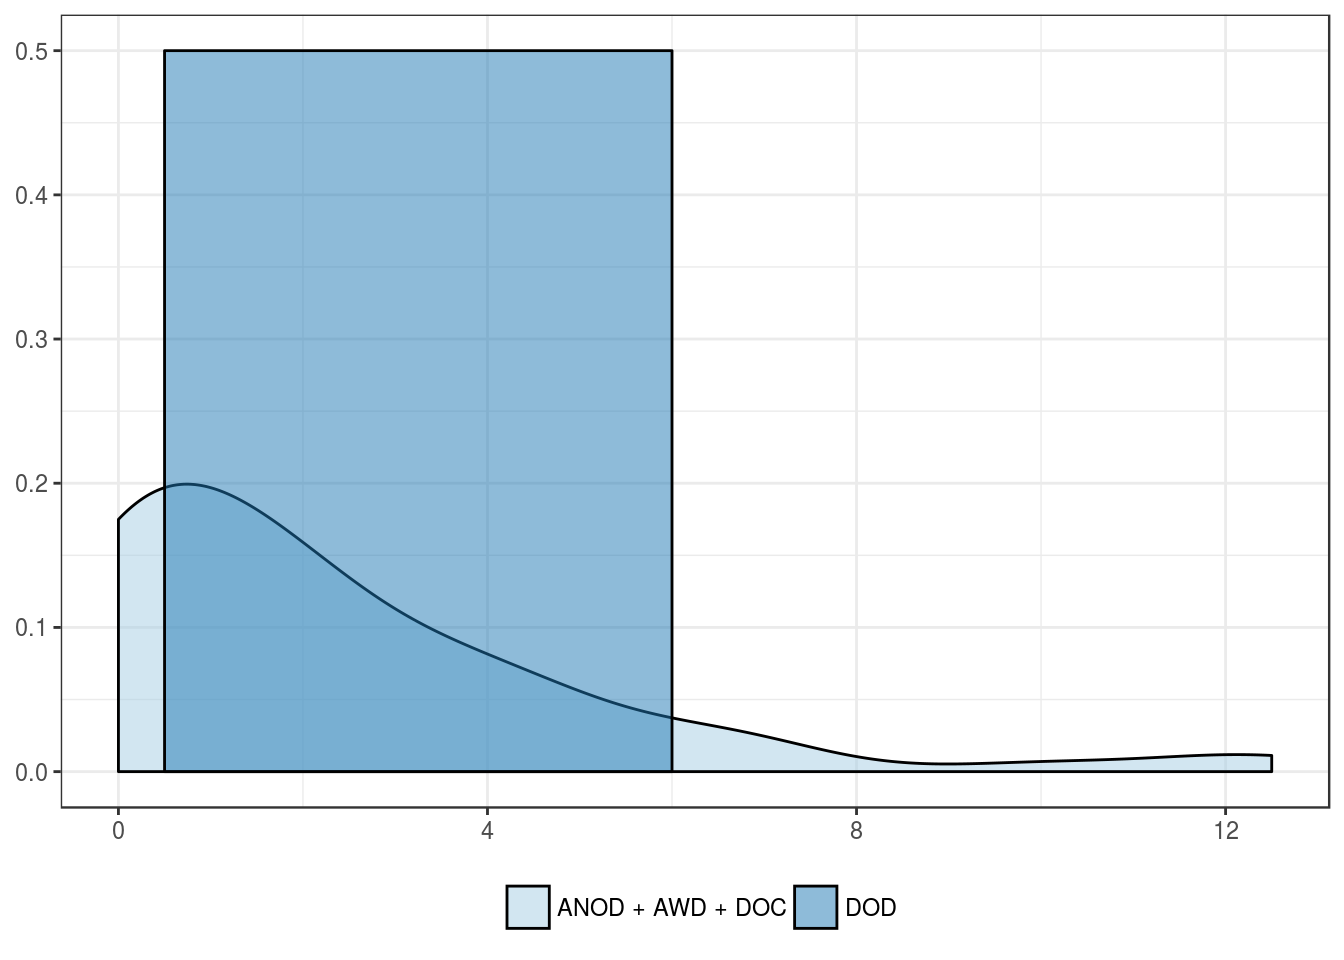
Cancer-related mortality
| ANOD + AWD + DOC | DOD | |
|---|---|---|
| Mean | 2.3 | 3.2 |
| Standard deviation | 2.8 | 3.9 |
| Median | 1.5 | 3.2 |
| Interquartile range | 3.5 | 2.8 |
| Minimum | 0.0 | 0.5 |
| Maximum | 12.5 | 6.0 |
| Value | |
|---|---|
| U-statistic | 54 |
| P statistic | 6.3e-01 |
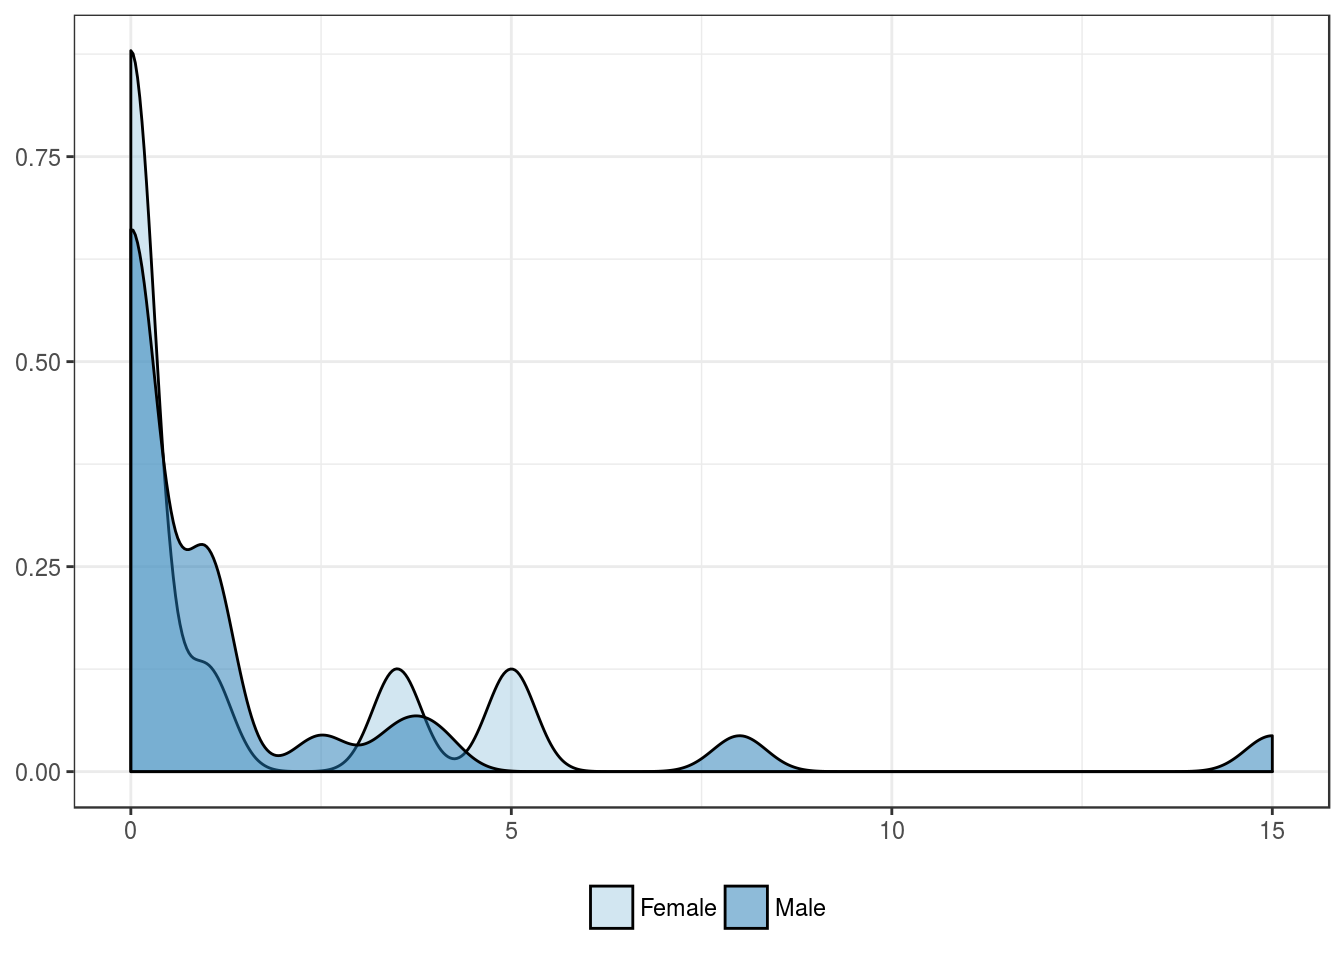
FOXP3 positivity in stromal lymphocytes
Clinical features
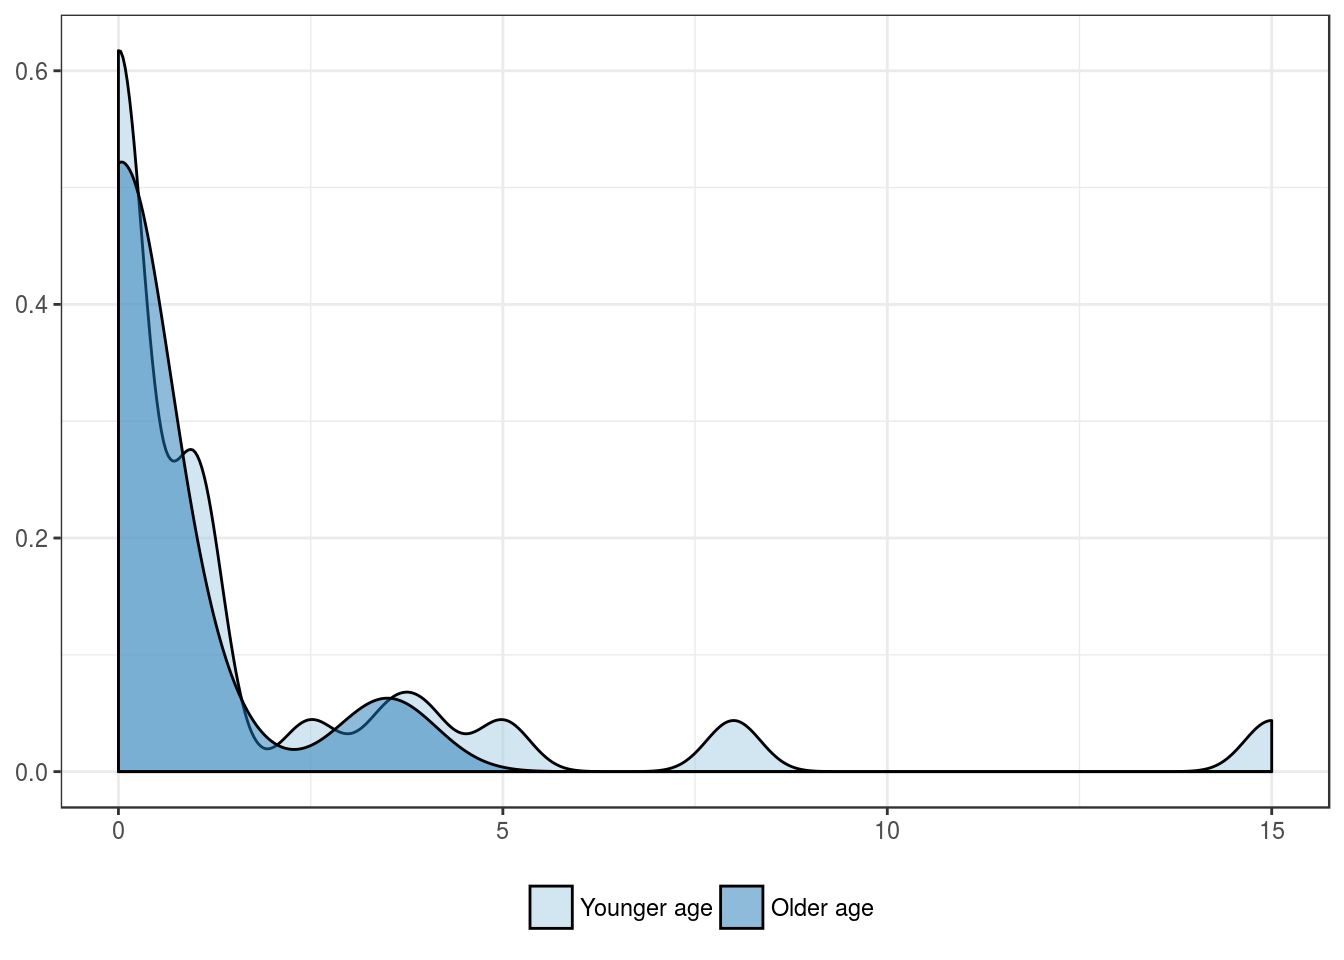
Patients’ age group, in years
| Younger age | Older age | |
|---|---|---|
| Mean | 1.7 | 0.4 |
| Standard deviation | 3.3 | 1.1 |
| Median | 0.0 | 0.0 |
| Interquartile range | 1.0 | 0.0 |
| Minimum | 0.0 | 0.0 |
| Maximum | 15.0 | 3.5 |
| Value | |
|---|---|
| U-statistic | 166 |
| P statistic | 1.6e-01 |
Patients’ sex
| Female | Male | |
|---|---|---|
| Mean | 1.0 | 1.5 |
| Standard deviation | 1.8 | 3.3 |
| Median | 0.0 | 0.0 |
| Interquartile range | 0.8 | 1.0 |
| Minimum | 0.0 | 0.0 |
| Maximum | 5.0 | 15.0 |
| Value | |
|---|---|
| U-statistic | 117 |
| P statistic | 6.1e-01 |
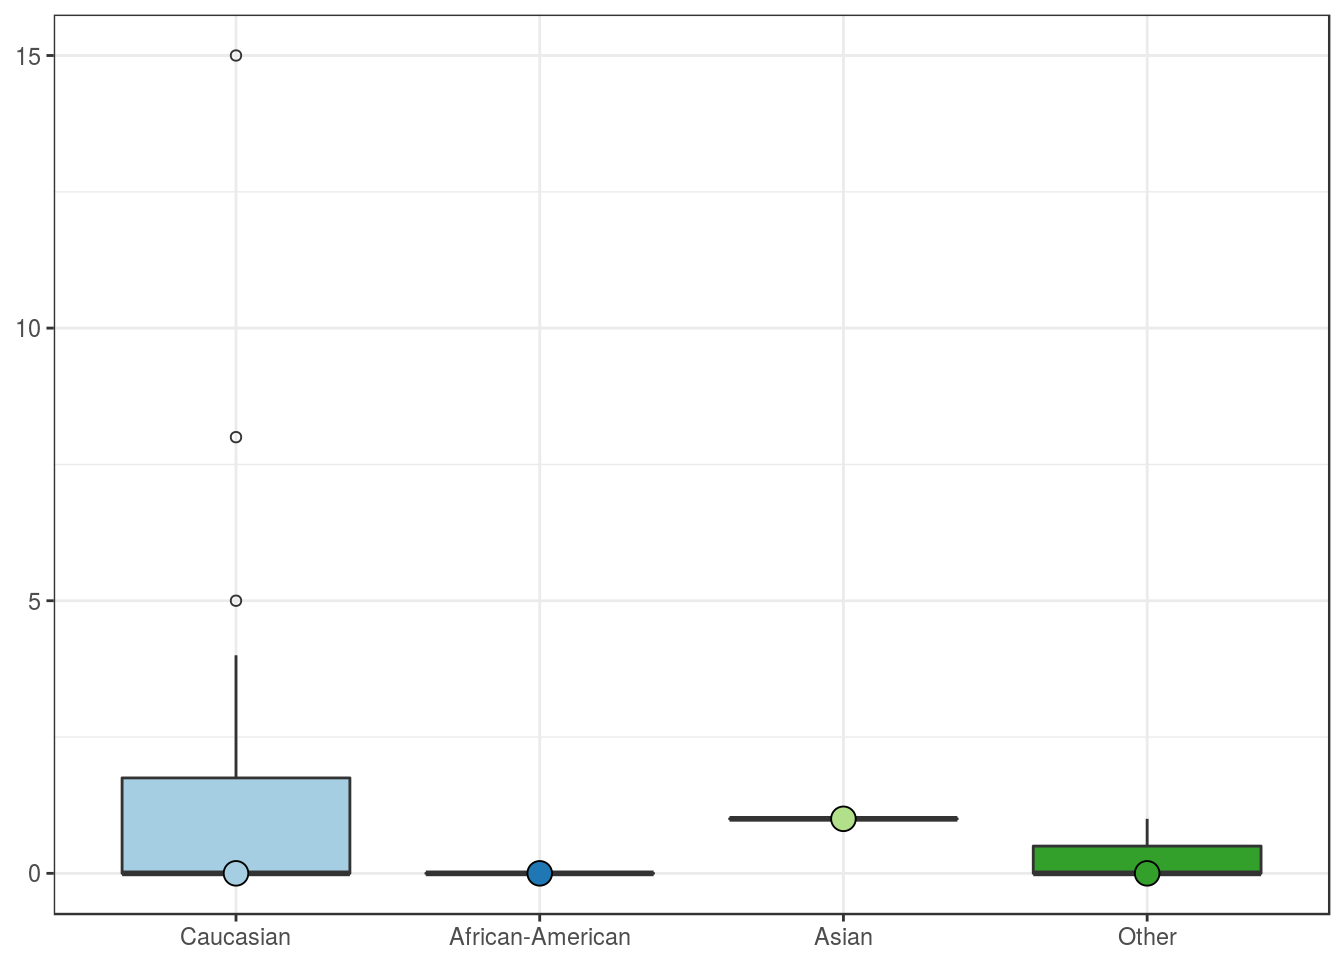
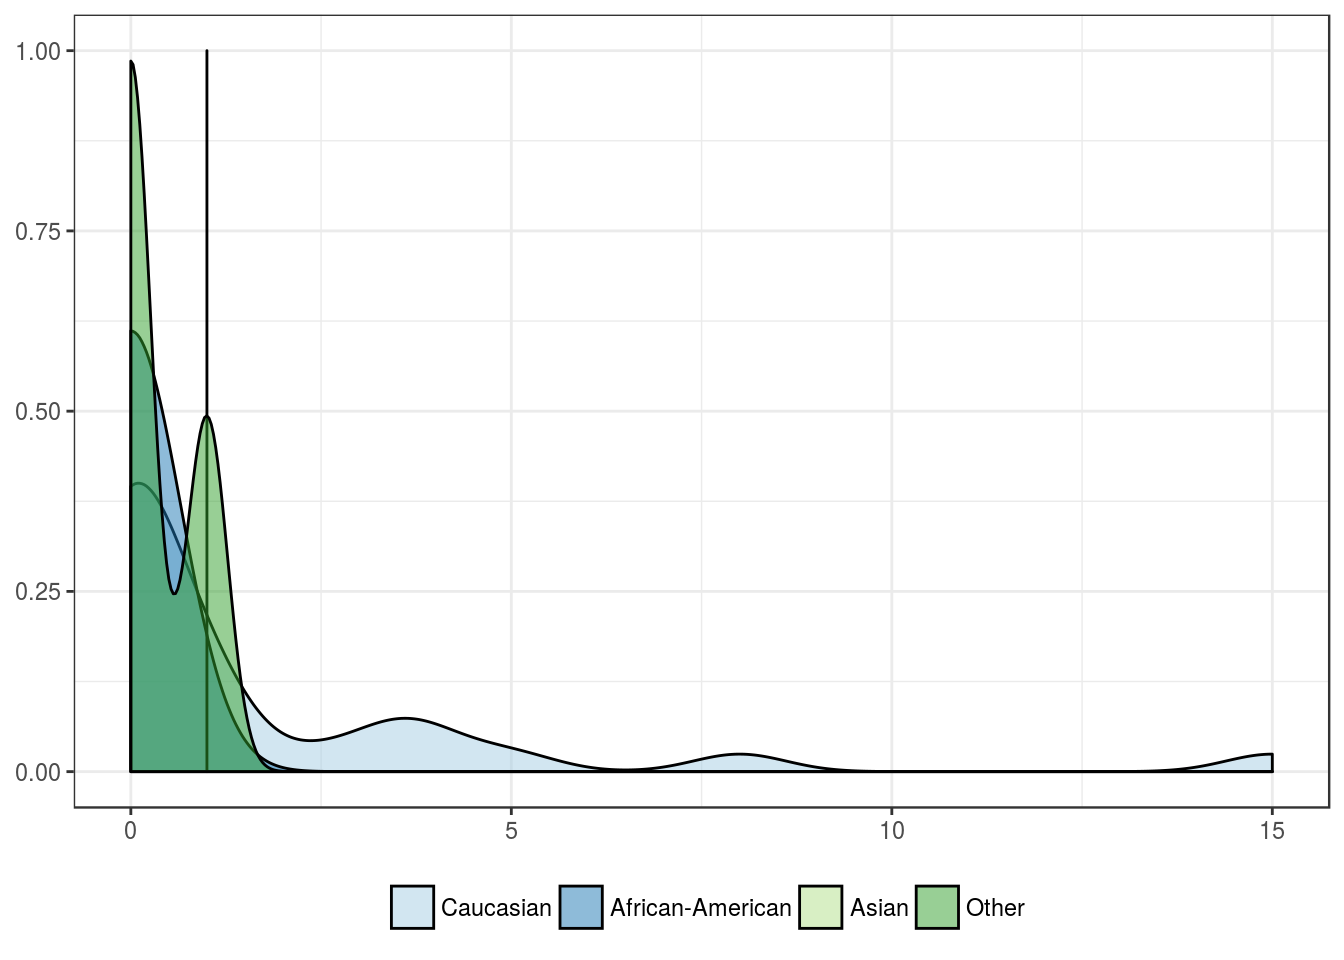
Patients’ race
| Caucasian | African-American | Asian | Other | |
|---|---|---|---|---|
| Mean | 1.7 | 0 | 1 | 0.3 |
| Standard deviation | 3.3 | 0 | NA | 0.6 |
| Median | 0.0 | 0 | 1 | 0.0 |
| Interquartile range | 1.8 | 0 | 0 | 0.5 |
| Minimum | 0.0 | 0 | 1 | 0.0 |
| Maximum | 15.0 | 0 | 1 | 1.0 |
| Value | |
|---|---|
| Statistic | 4.219 |
| Parameter | 3 |
| P statistic | 0.24 |
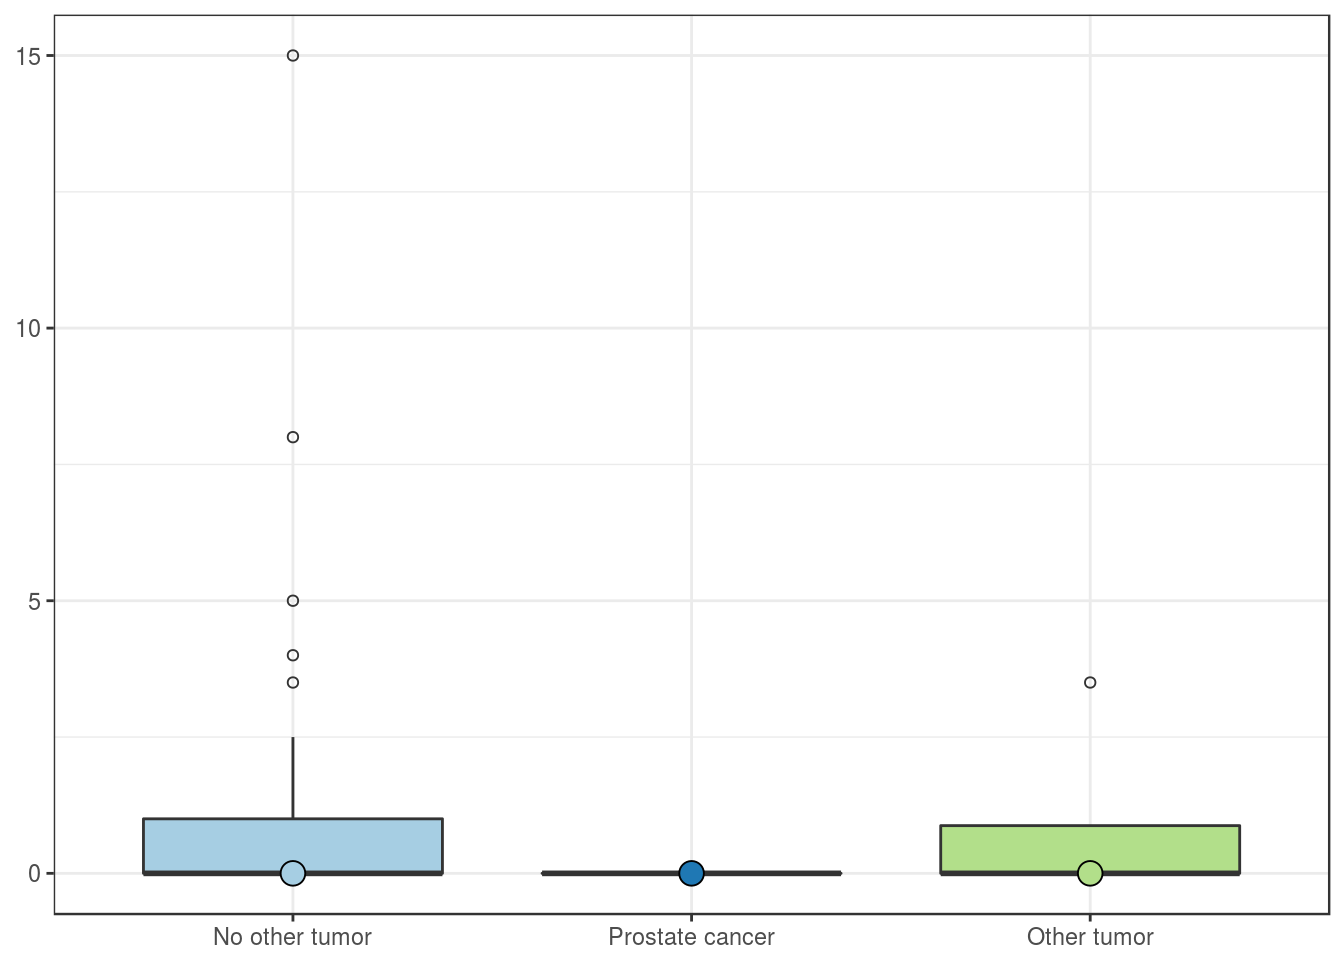
History of other malignancies
| No other tumor | Prostate cancer | Other tumor | |
|---|---|---|---|
| Mean | 1.5 | 0 | 0.9 |
| Standard deviation | 3.2 | 0 | 1.8 |
| Median | 0.0 | 0 | 0.0 |
| Interquartile range | 1.0 | 0 | 0.9 |
| Minimum | 0.0 | 0 | 0.0 |
| Maximum | 15.0 | 0 | 3.5 |
| Value | |
|---|---|
| Statistic | 1.533 |
| Parameter | 2 |
| P statistic | 0.46 |
Pathologic features
Tumor size group
| Smaller size | Larger size | |
|---|---|---|
| Mean | 0.6 | 2.6 |
| Standard deviation | 1.3 | 4.4 |
| Median | 0.0 | 0.0 |
| Interquartile range | 1.0 | 3.5 |
| Minimum | 0.0 | 0.0 |
| Maximum | 5.0 | 15.0 |
| Value | |
|---|---|
| U-statistic | 110 |
| P statistic | 2.1e-01 |
Multifocality
| Single tumor | Multifocal tumor | |
|---|---|---|
| Mean | 1.3 | 2.5 |
| Standard deviation | 3.0 | 3.5 |
| Median | 0.0 | 2.5 |
| Interquartile range | 1.0 | 2.5 |
| Minimum | 0.0 | 0.0 |
| Maximum | 15.0 | 5.0 |
| Value | |
|---|---|
| U-statistic | 25 |
| P statistic | 5.5e-01 |
Fuhrman grade
| G1 | G2 | G3 | G4 | |
|---|---|---|---|---|
| Mean | 0.5 | 0.8 | 2.8 | NaN |
| Standard deviation | 0.7 | 1.5 | 4.7 | NA |
| Median | 0.5 | 0.0 | 1.0 | NA |
| Interquartile range | 0.5 | 1.0 | 3.0 | NA |
| Minimum | 0.0 | 0.0 | 0.0 | Inf |
| Maximum | 1.0 | 5.0 | 15.0 | -Inf |
| Value | |
|---|---|
| Statistic | 2.108 |
| Parameter | 2 |
| P statistic | 0.35 |
pT stage
| pT1 | pT2 | pT3 | |
|---|---|---|---|
| Mean | 1.3 | 8 | 0.6 |
| Standard deviation | 3.1 | NA | 1.3 |
| Median | 0.0 | 8 | 0.0 |
| Interquartile range | 1.0 | 0 | 0.5 |
| Minimum | 0.0 | 8 | 0.0 |
| Maximum | 15.0 | 8 | 3.5 |
| Value | |
|---|---|
| Statistic | 3.555 |
| Parameter | 2 |
| P statistic | 0.17 |
Surgical margin
| Negative margin | Positive margin | |
|---|---|---|
| Mean | 1.4 | 0 |
| Standard deviation | 3.0 | NA |
| Median | 0.0 | 0 |
| Interquartile range | 1.0 | 0 |
| Minimum | 0.0 | 0 |
| Maximum | 15.0 | 0 |
| Value | |
|---|---|
| U-statistic | 23.5 |
| P statistic | 4.9e-01 |
Outcome features
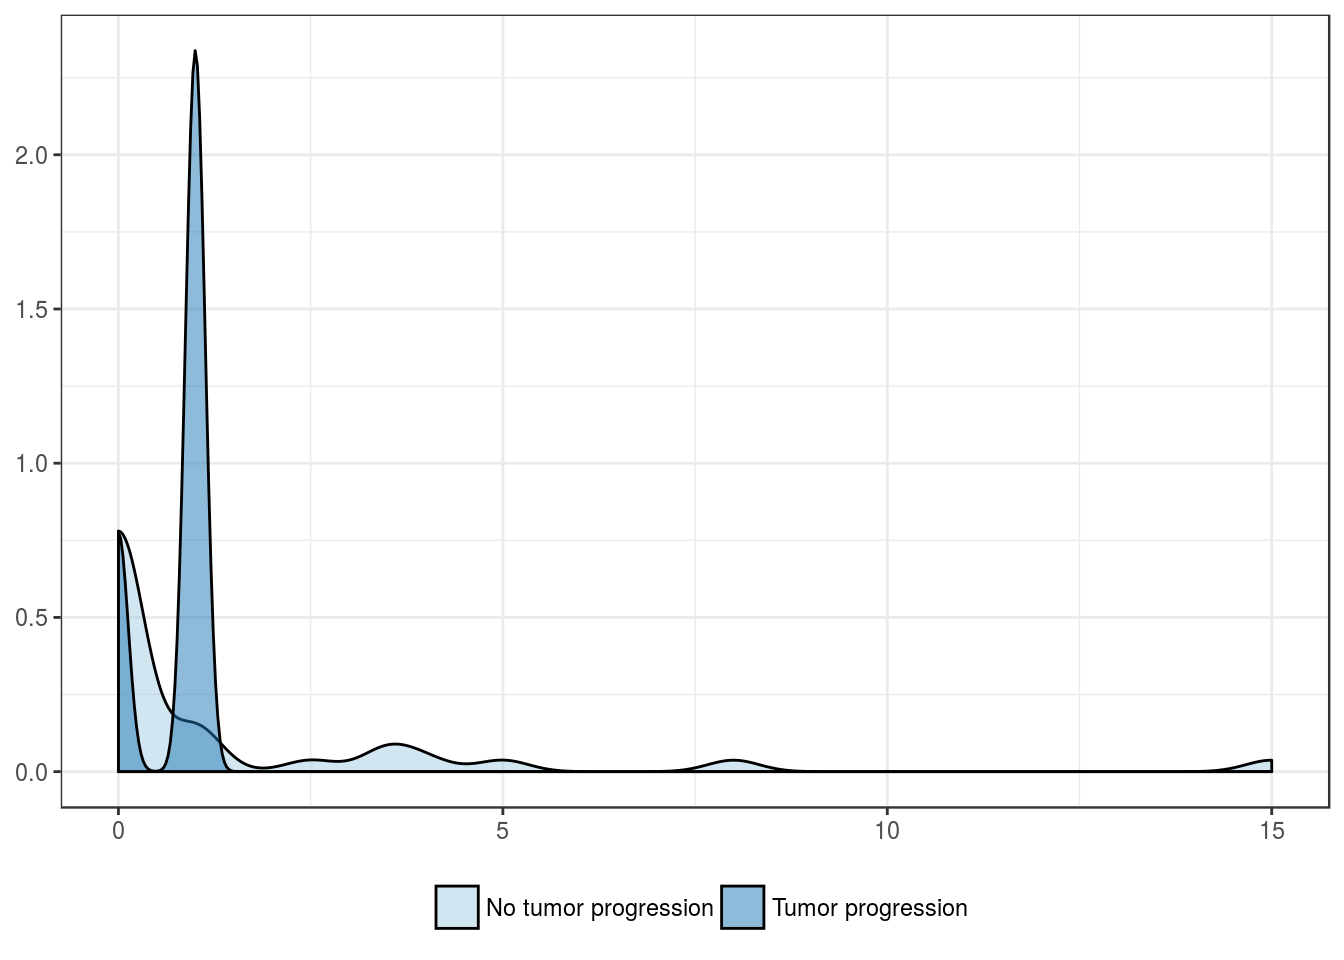
Tumor progression
| No tumor progression | Tumor progression | |
|---|---|---|
| Mean | 1.4 | 0.8 |
| Standard deviation | 3.1 | 0.5 |
| Median | 0.0 | 1.0 |
| Interquartile range | 1.0 | 0.2 |
| Minimum | 0.0 | 0.0 |
| Maximum | 15.0 | 1.0 |
| Value | |
|---|---|
| U-statistic | 48.5 |
| P statistic | 3.9e-01 |
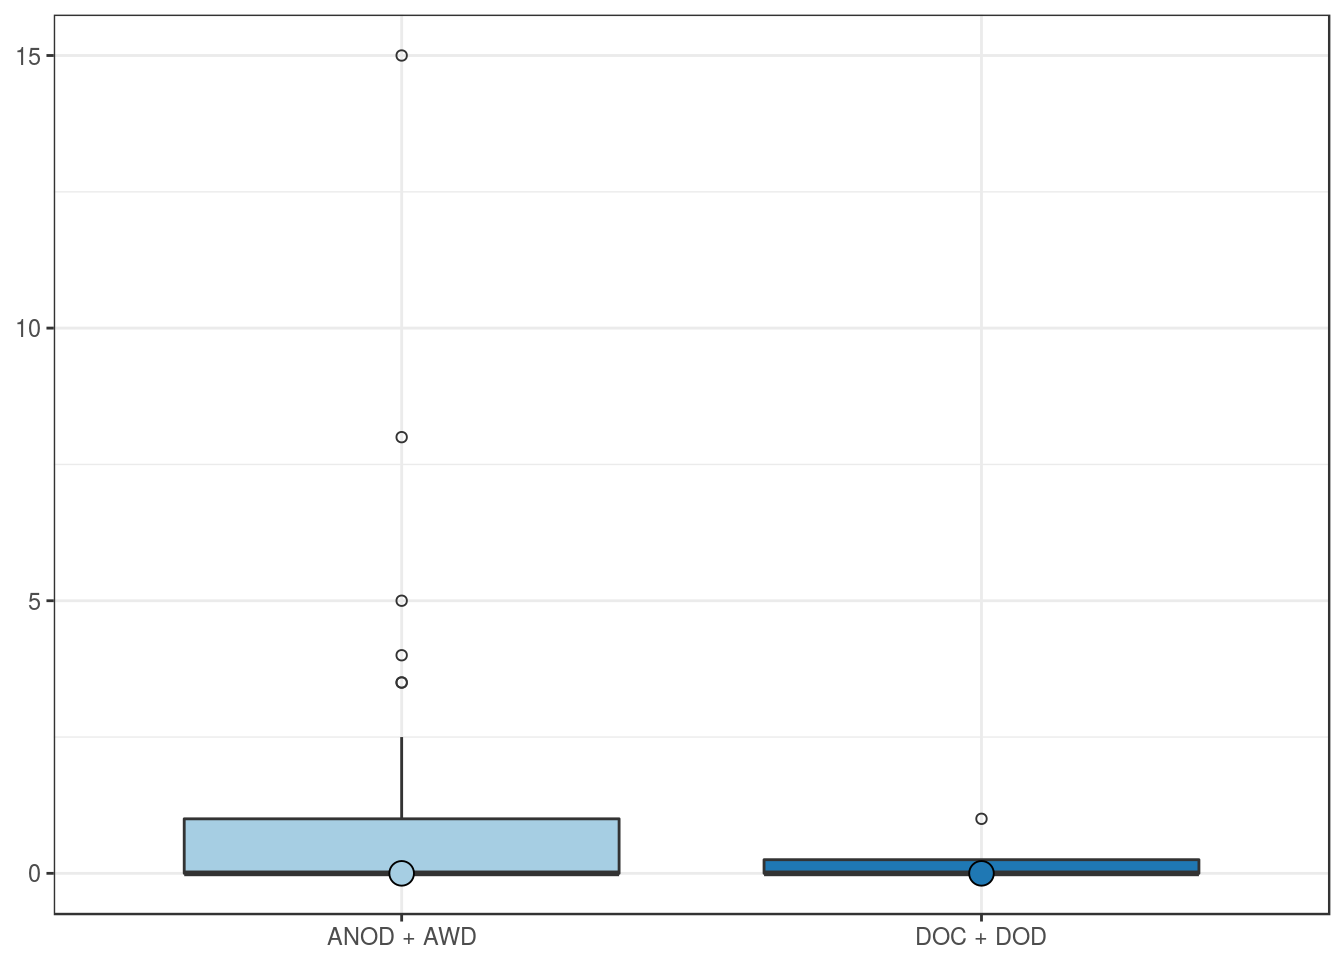
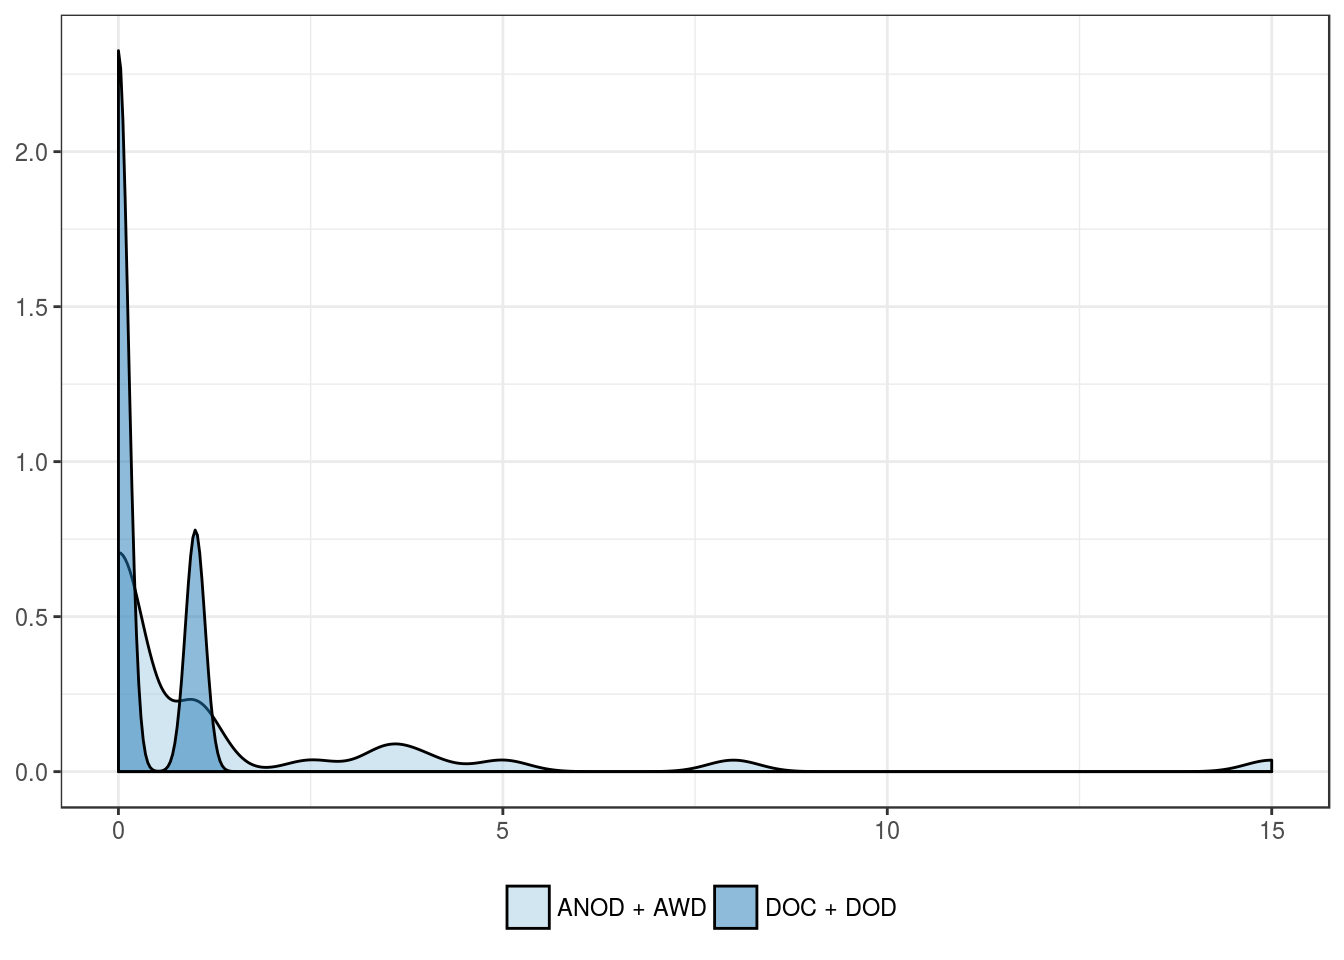
Overall mortality
| ANOD + AWD | DOC + DOD | |
|---|---|---|
| Mean | 1.5 | 0.2 |
| Standard deviation | 3.1 | 0.5 |
| Median | 0.0 | 0.0 |
| Interquartile range | 1.0 | 0.2 |
| Minimum | 0.0 | 0.0 |
| Maximum | 15.0 | 1.0 |
| Value | |
|---|---|
| U-statistic | 77.5 |
| P statistic | 4.5e-01 |
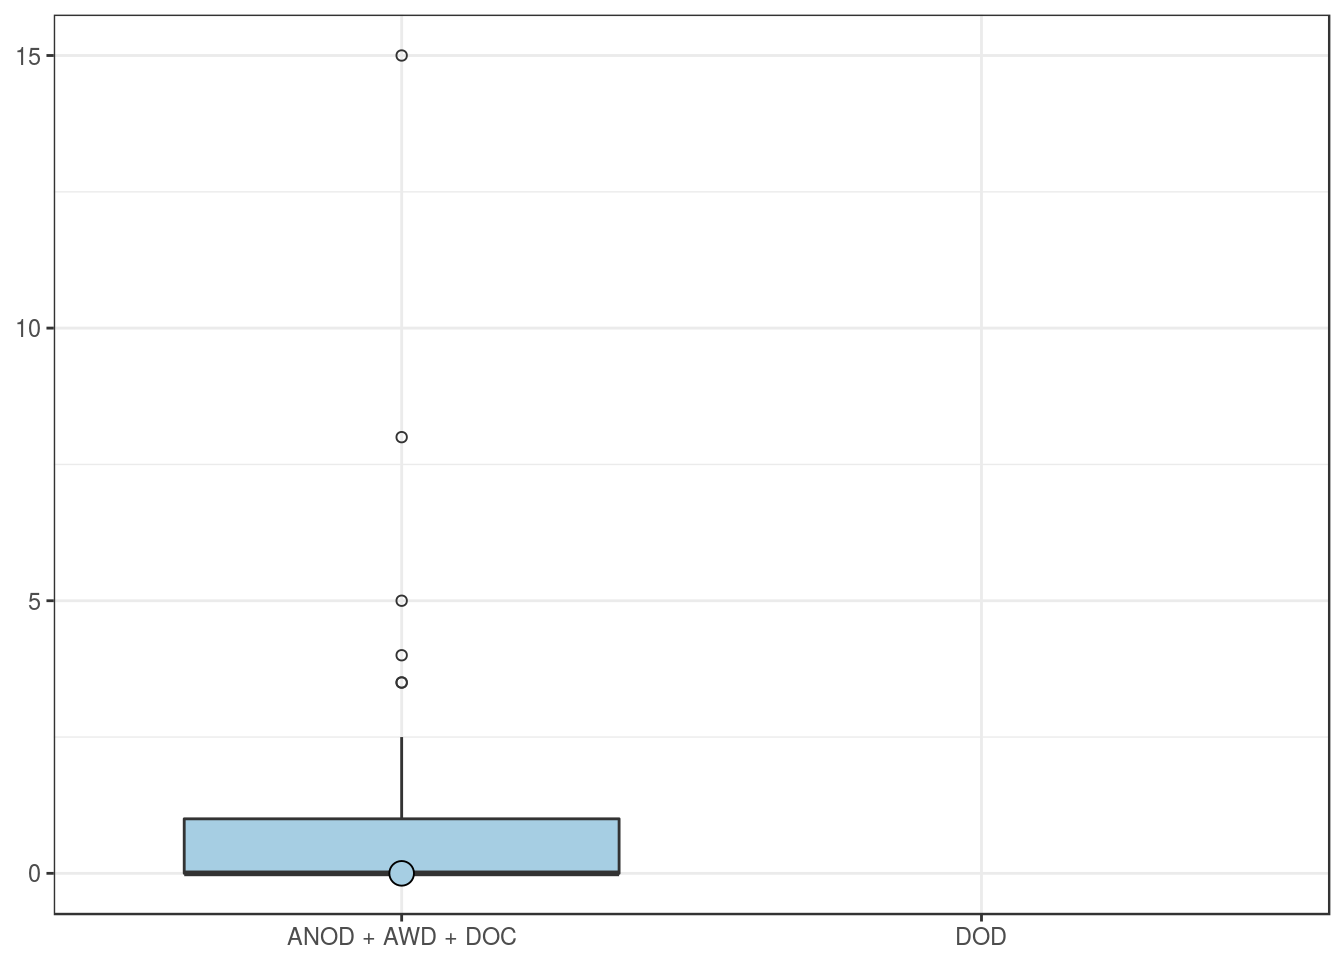
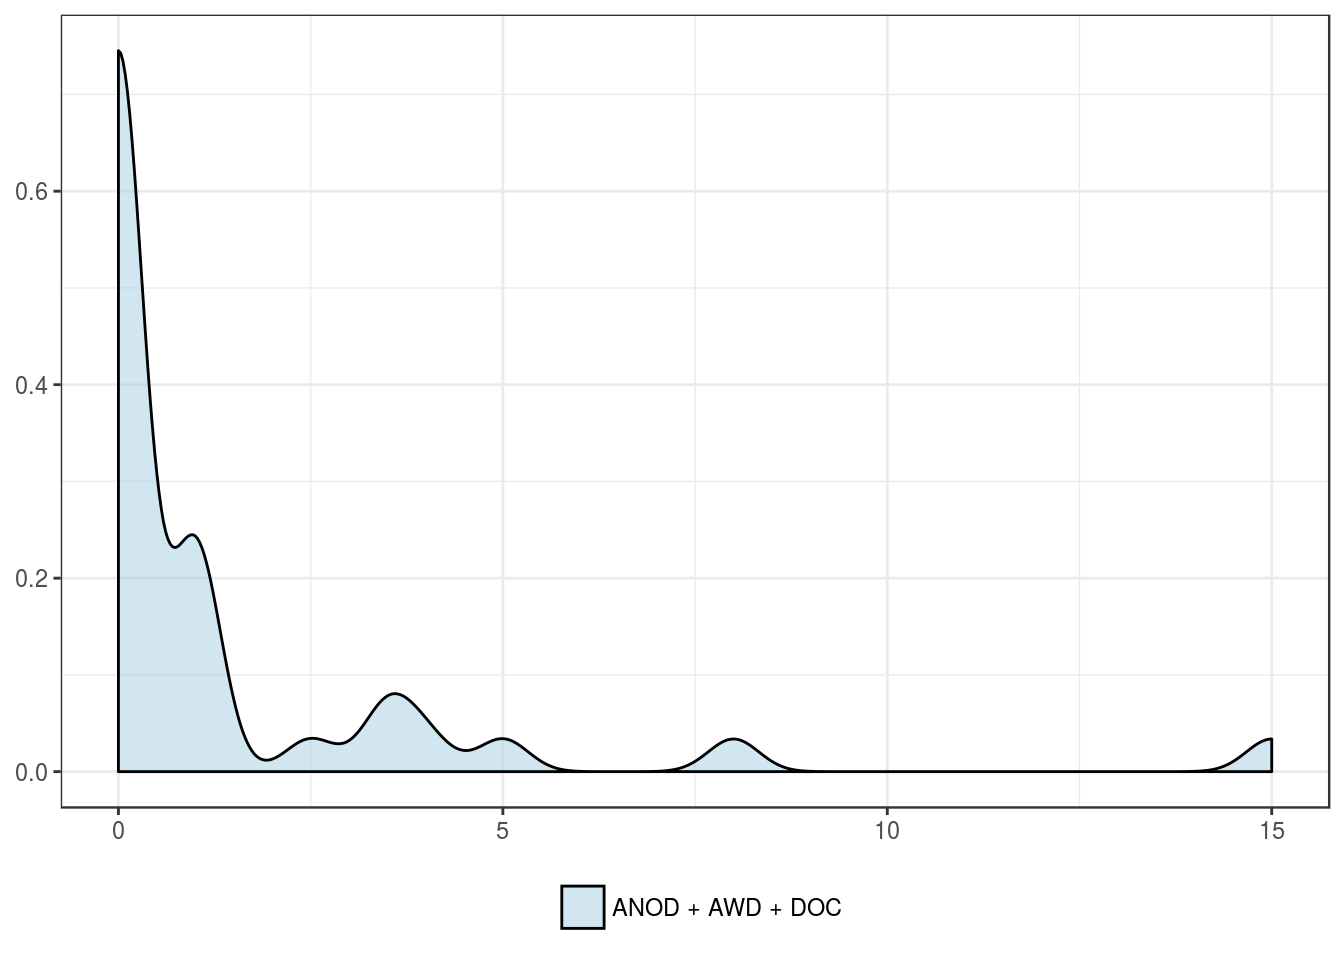
Cancer-related mortality
| ANOD + AWD + DOC | DOD | |
|---|---|---|
| Mean | 1.3 | NaN |
| Standard deviation | 2.9 | NA |
| Median | 0.0 | NA |
| Interquartile range | 1.0 | NA |
| Minimum | 0.0 | Inf |
| Maximum | 15.0 | -Inf |