Cohort features
In this section, we describe the clinicopathologic and outcome features of the 99 patients included in the cohort.
Clinical features
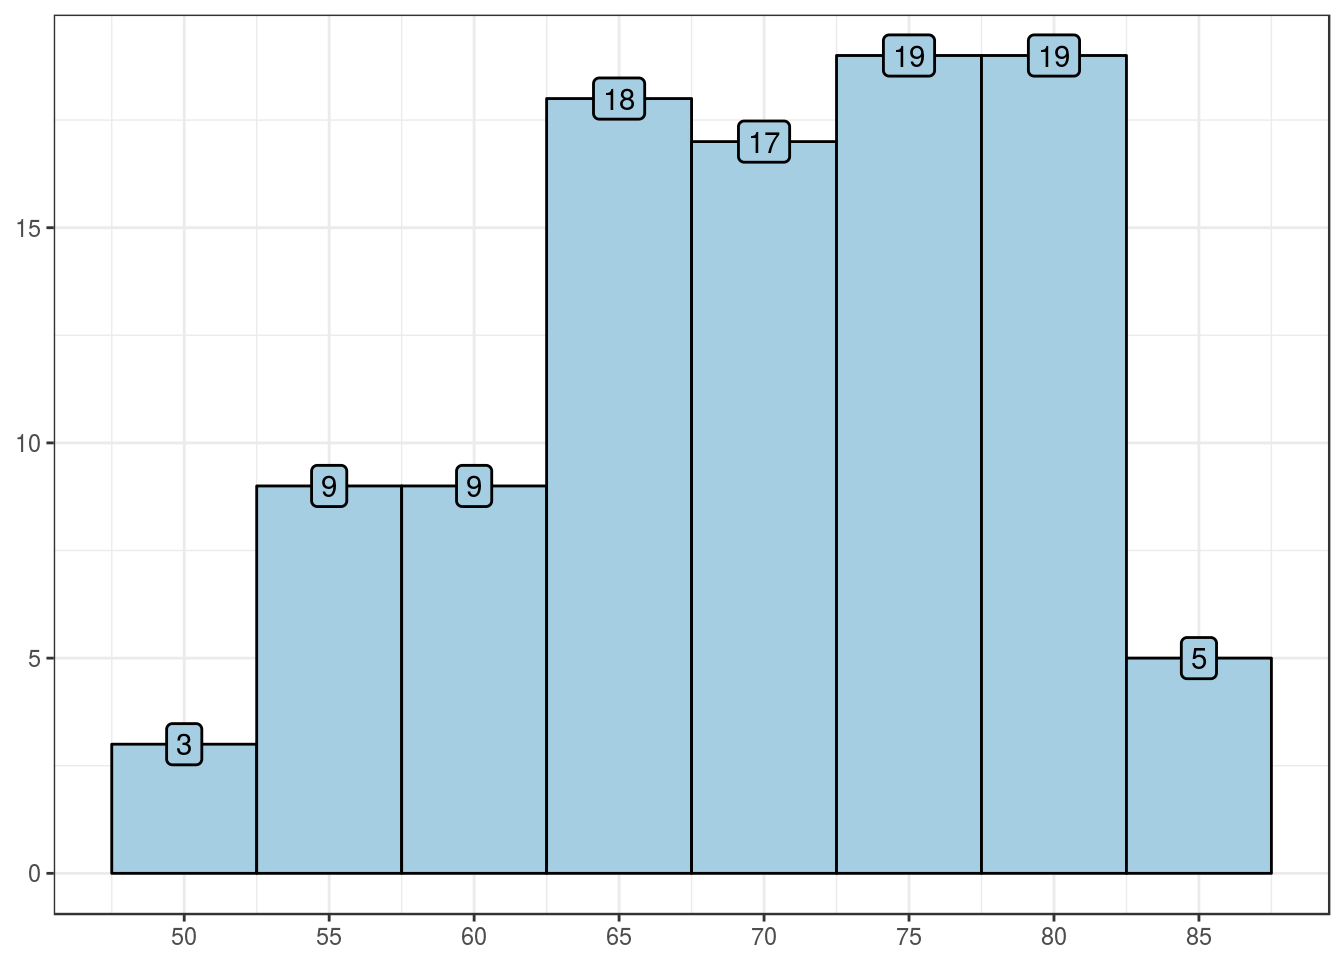
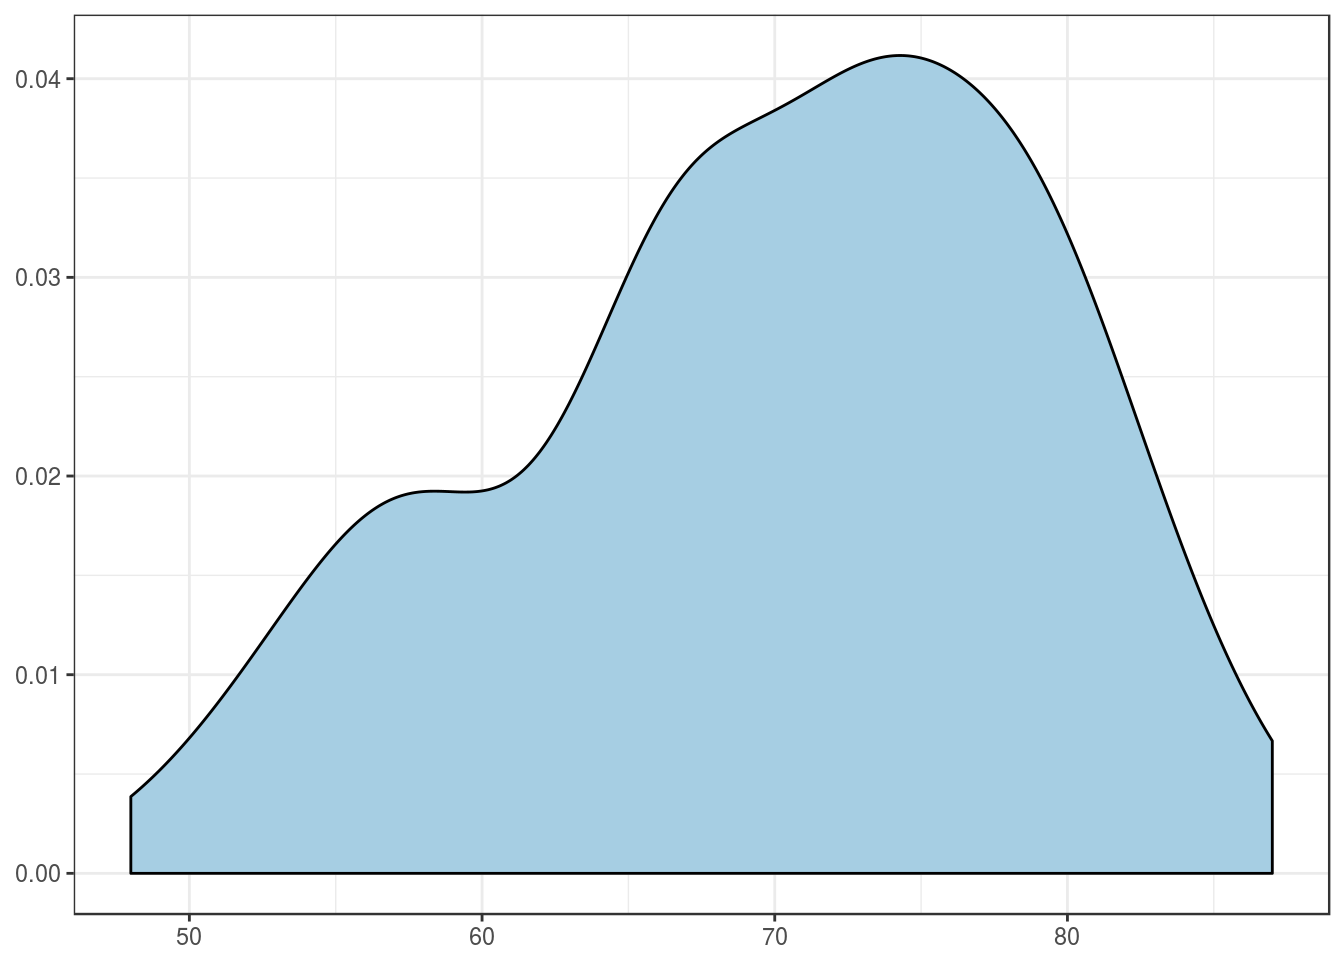
Patient’s age, in years
| Values | |
|---|---|
| Mean | 70 |
| Standard deviation | 8.9 |
| Median | 71 |
| Interquartile range | 11.5 |
| Mininum | 48 |
| Maximum | 87 |
Patient’s sex
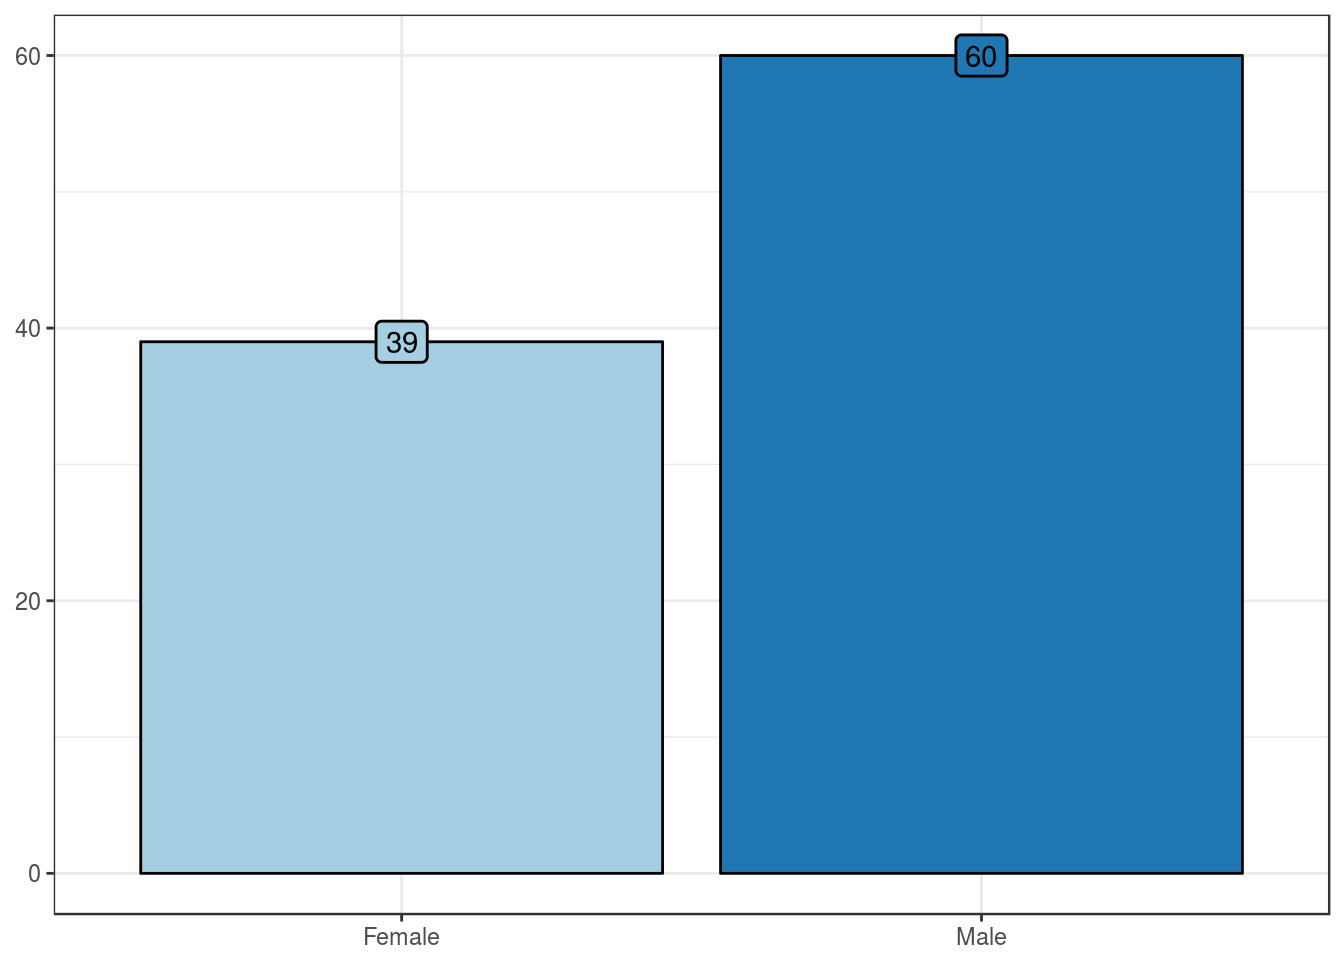
| No. Cases (%) | |
|---|---|
| Female | 39 (39) |
| Male | 60 (61) |
Pathologic features
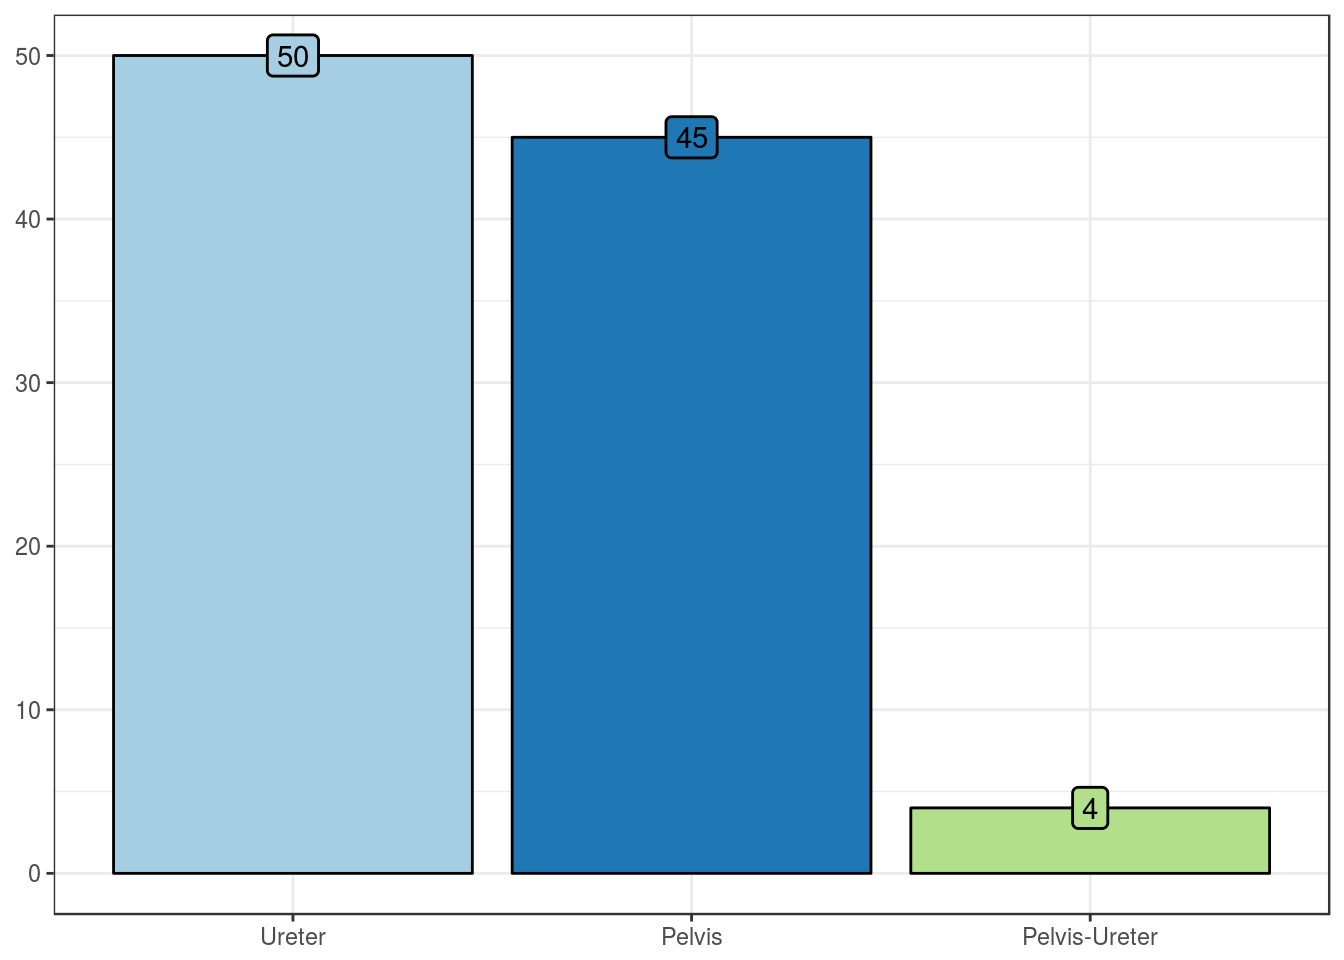
Tumor location
| No. Cases (%) | |
|---|---|
| Ureter | 50 (51) |
| Pelvis | 45 (45) |
| Pelvis-Ureter | 4 (4) |
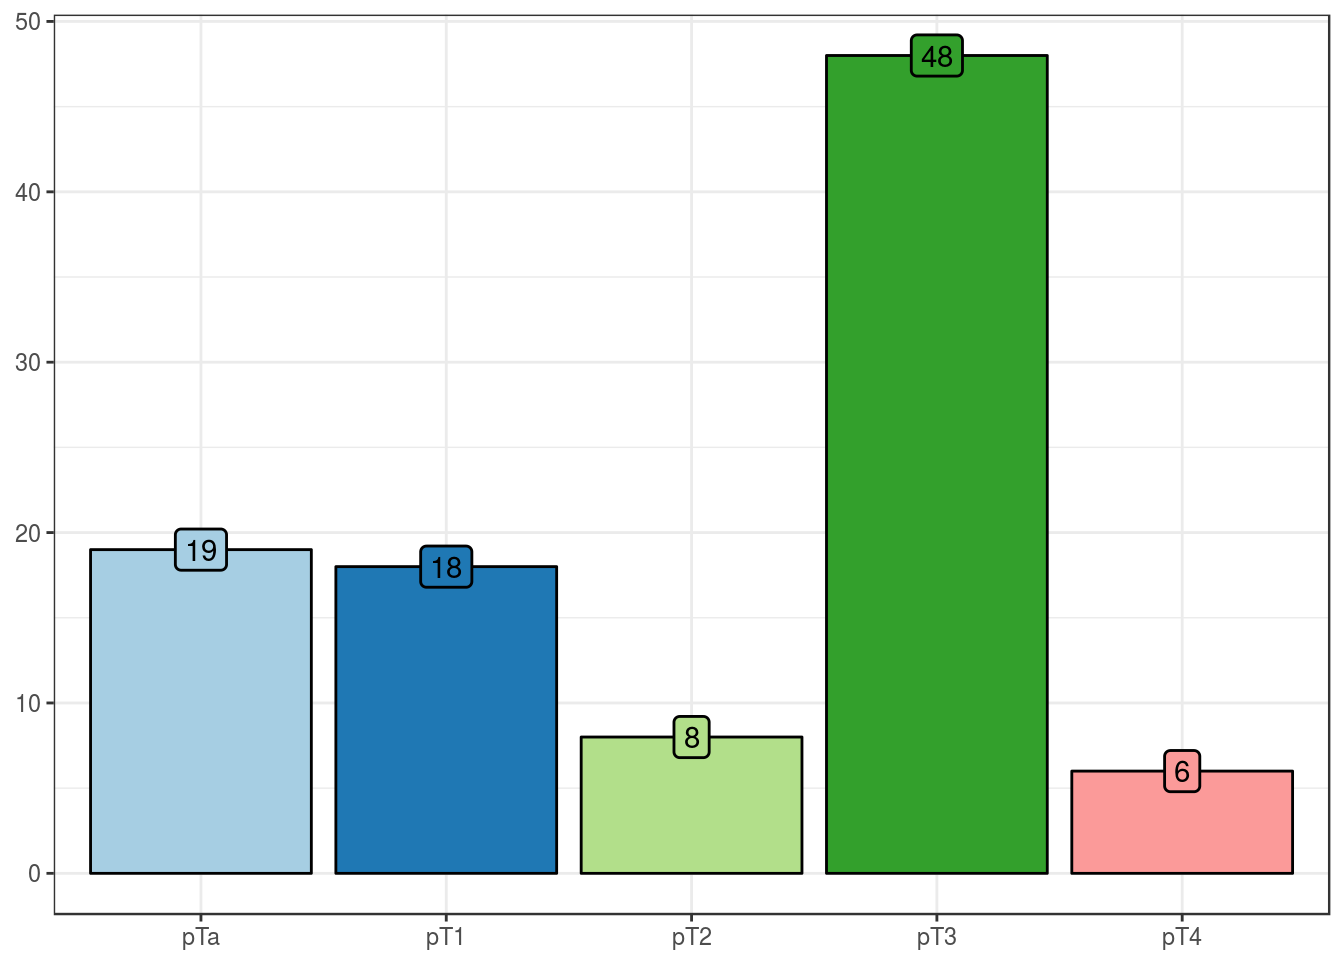
pT
| No. Cases (%) | |
|---|---|
| pTa | 19 (19) |
| pT1 | 18 (18) |
| pT2 | 8 (8) |
| pT3 | 48 (48) |
| pT4 | 6 (6) |
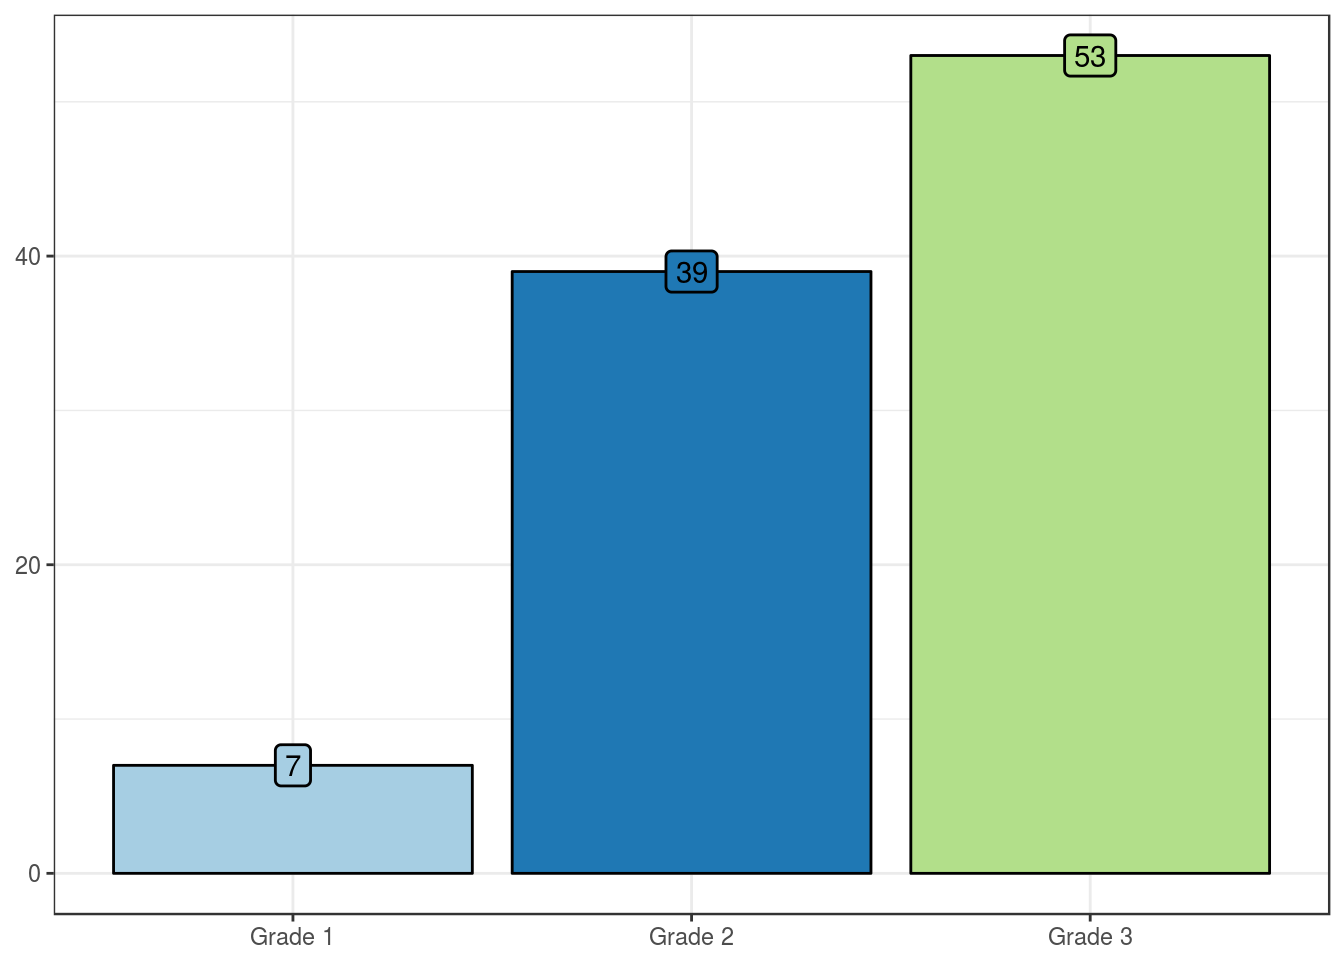
Histologic grade
| No. Cases (%) | |
|---|---|
| Grade 1 | 7 (7) |
| Grade 2 | 39 (39) |
| Grade 3 | 53 (54) |
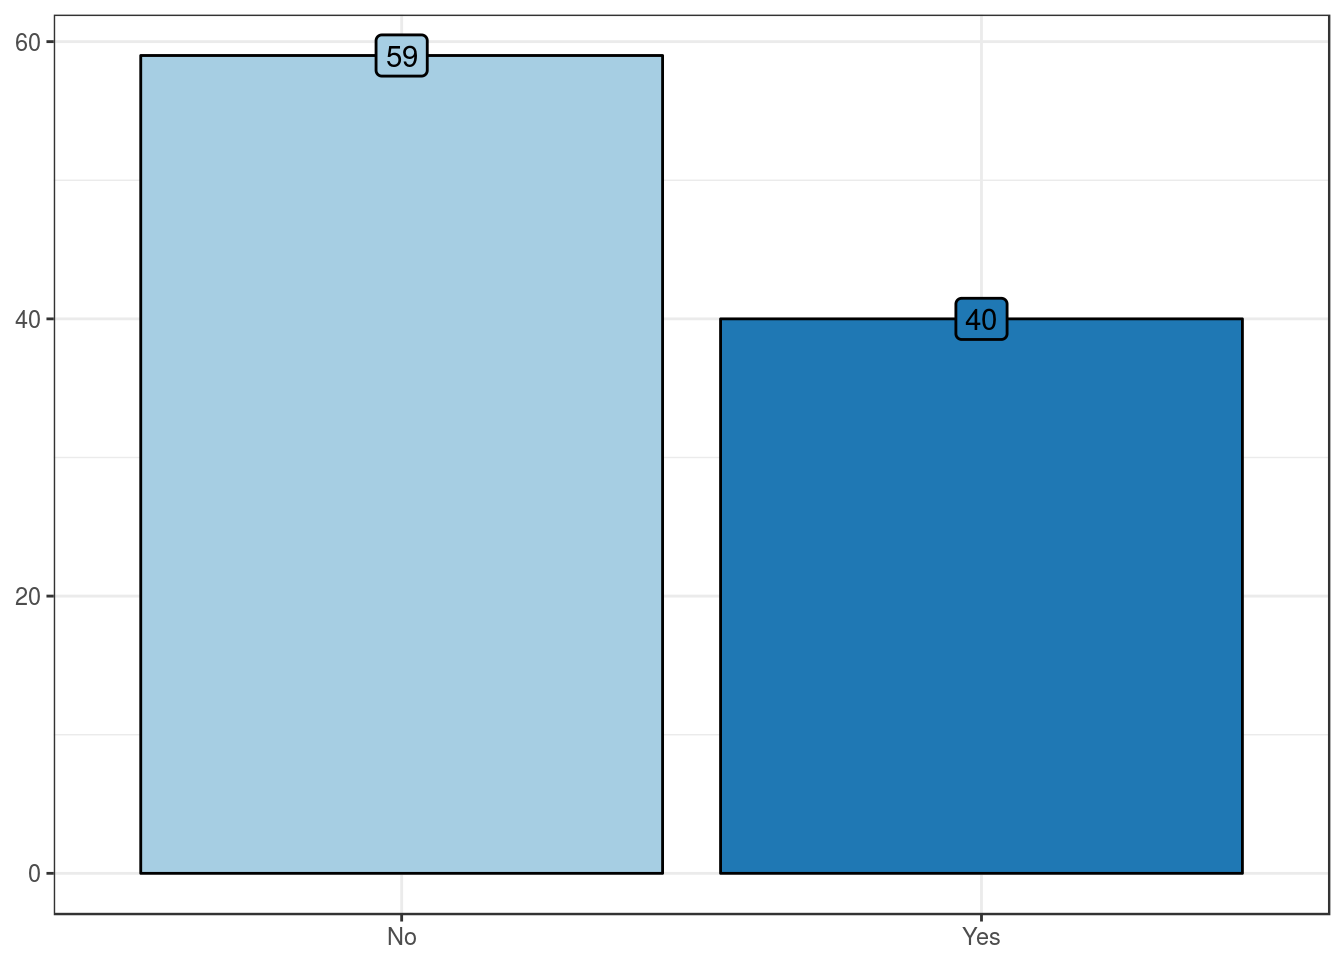
Lymphovascular invasion
| No. Cases (%) | |
|---|---|
| No | 59 (60) |
| Yes | 40 (40) |
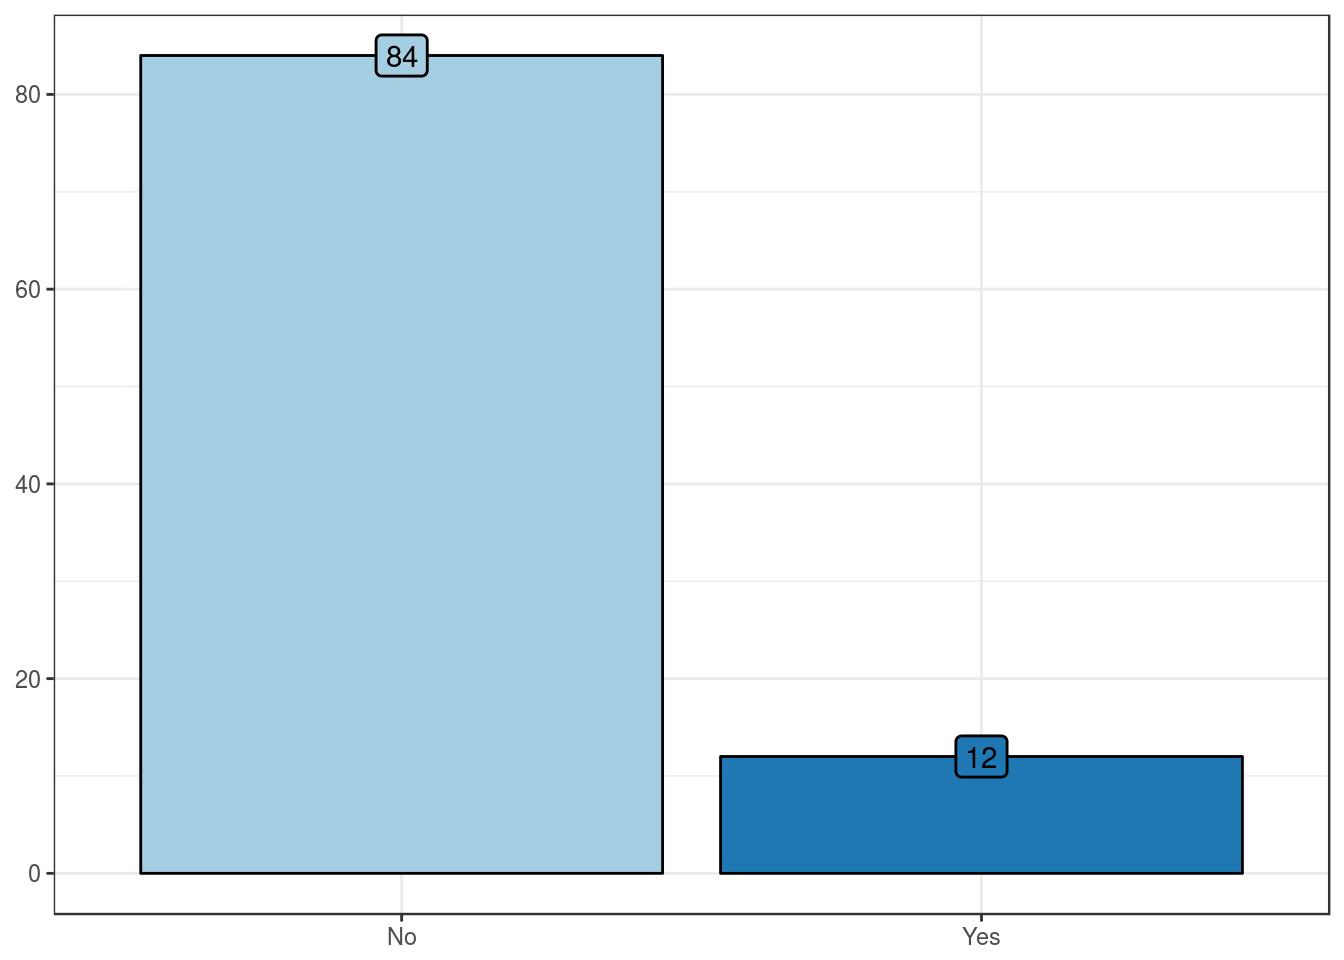
Lymph node metastasis
| No. Cases (%) | |
|---|---|
| No | 84 (88) |
| Yes | 12 (12) |
Outcome features
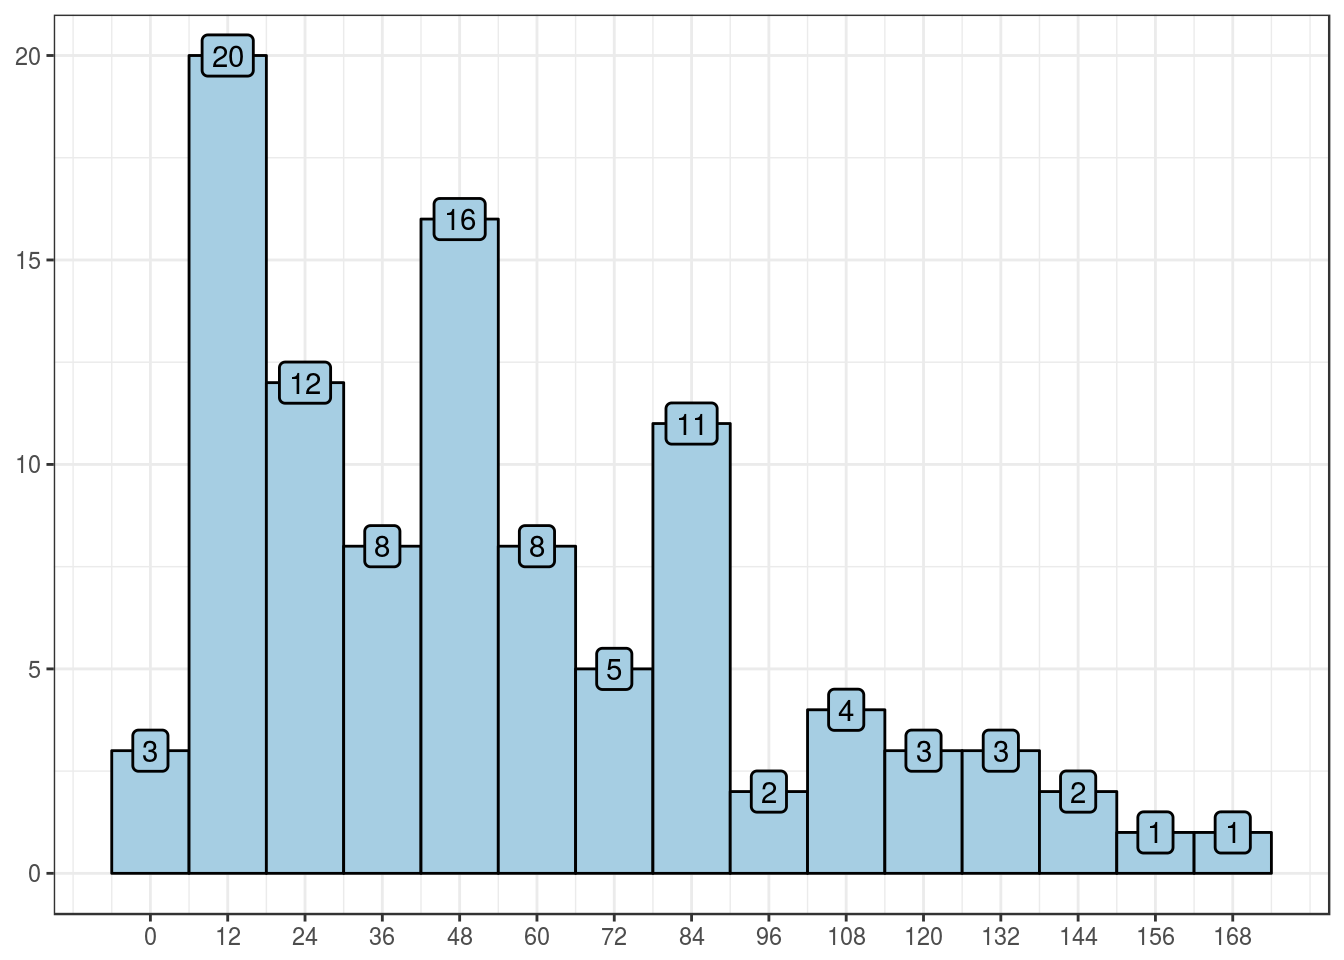
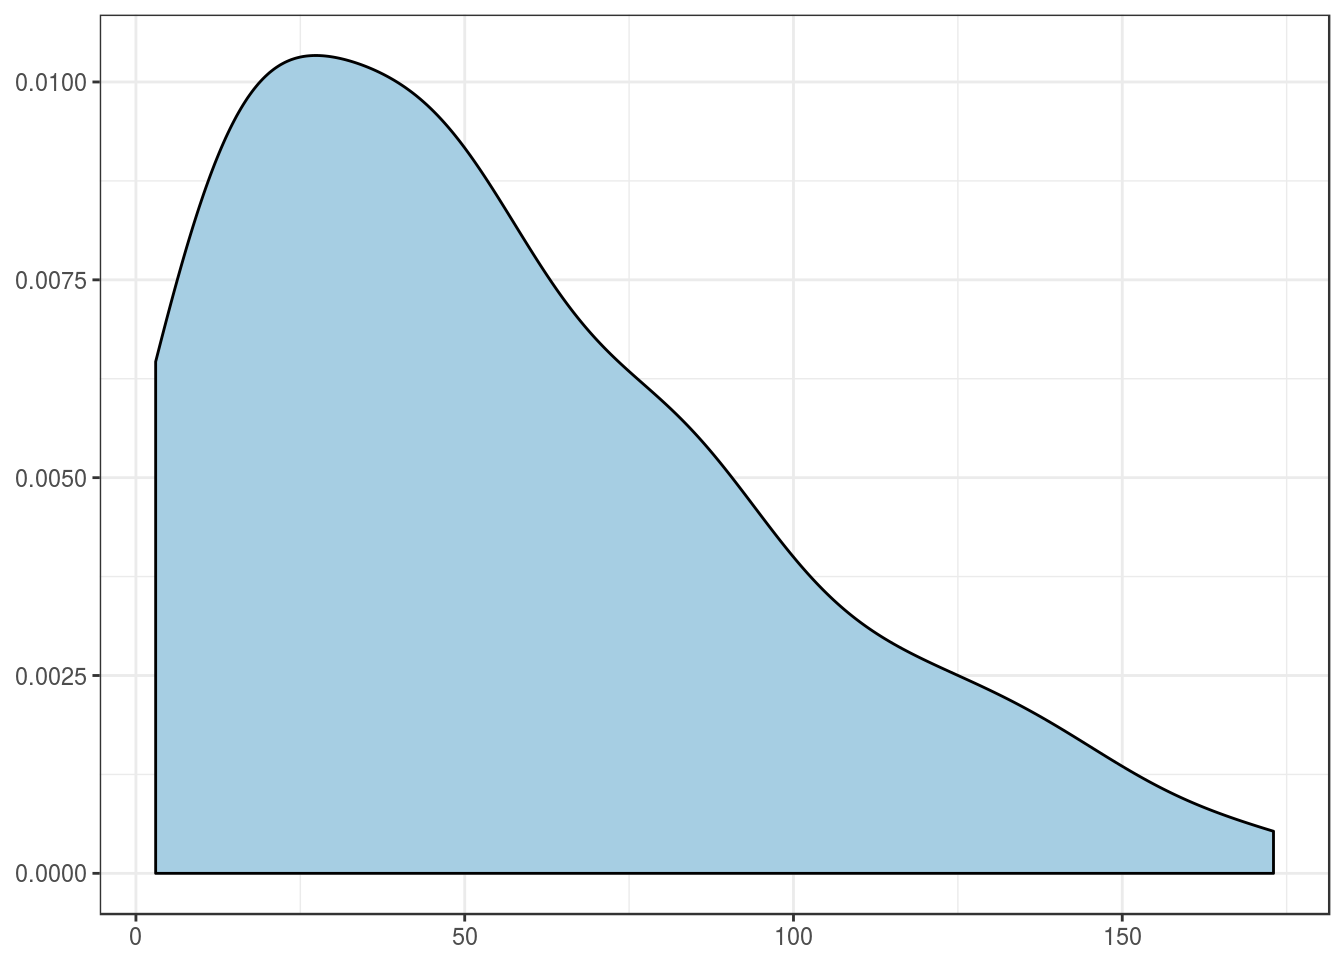
Follow-up, in months
| Values | |
|---|---|
| Mean | 54.8 |
| Standard deviation | 39.9 |
| Median | 47 |
| Interquartile range | 56.5 |
| Mininum | 3 |
| Maximum | 173 |
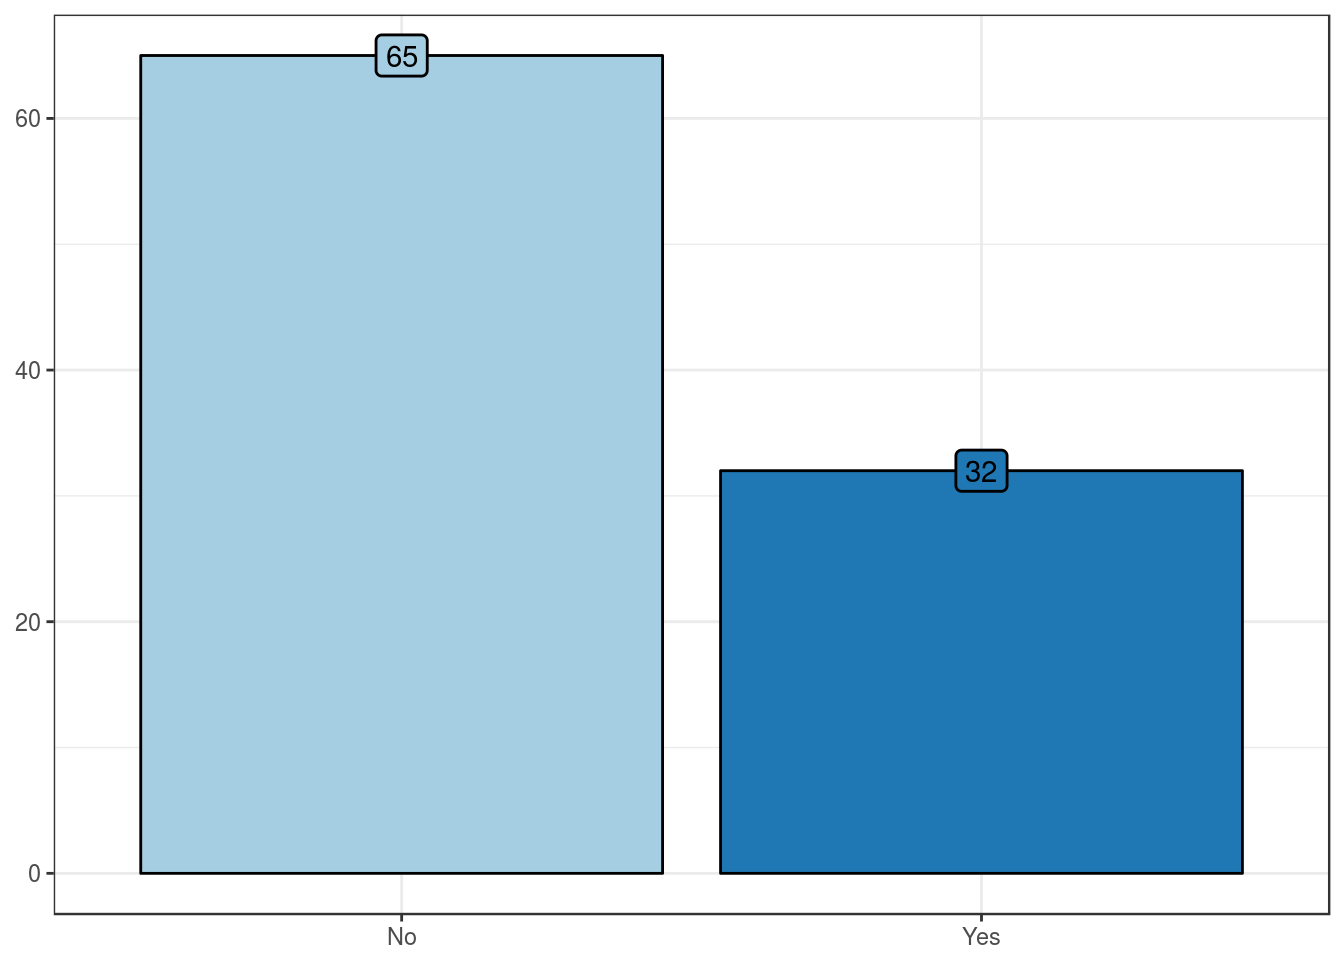
Bladder recurrence
| No. Cases (%) | |
|---|---|
| No | 65 (67) |
| Yes | 32 (33) |
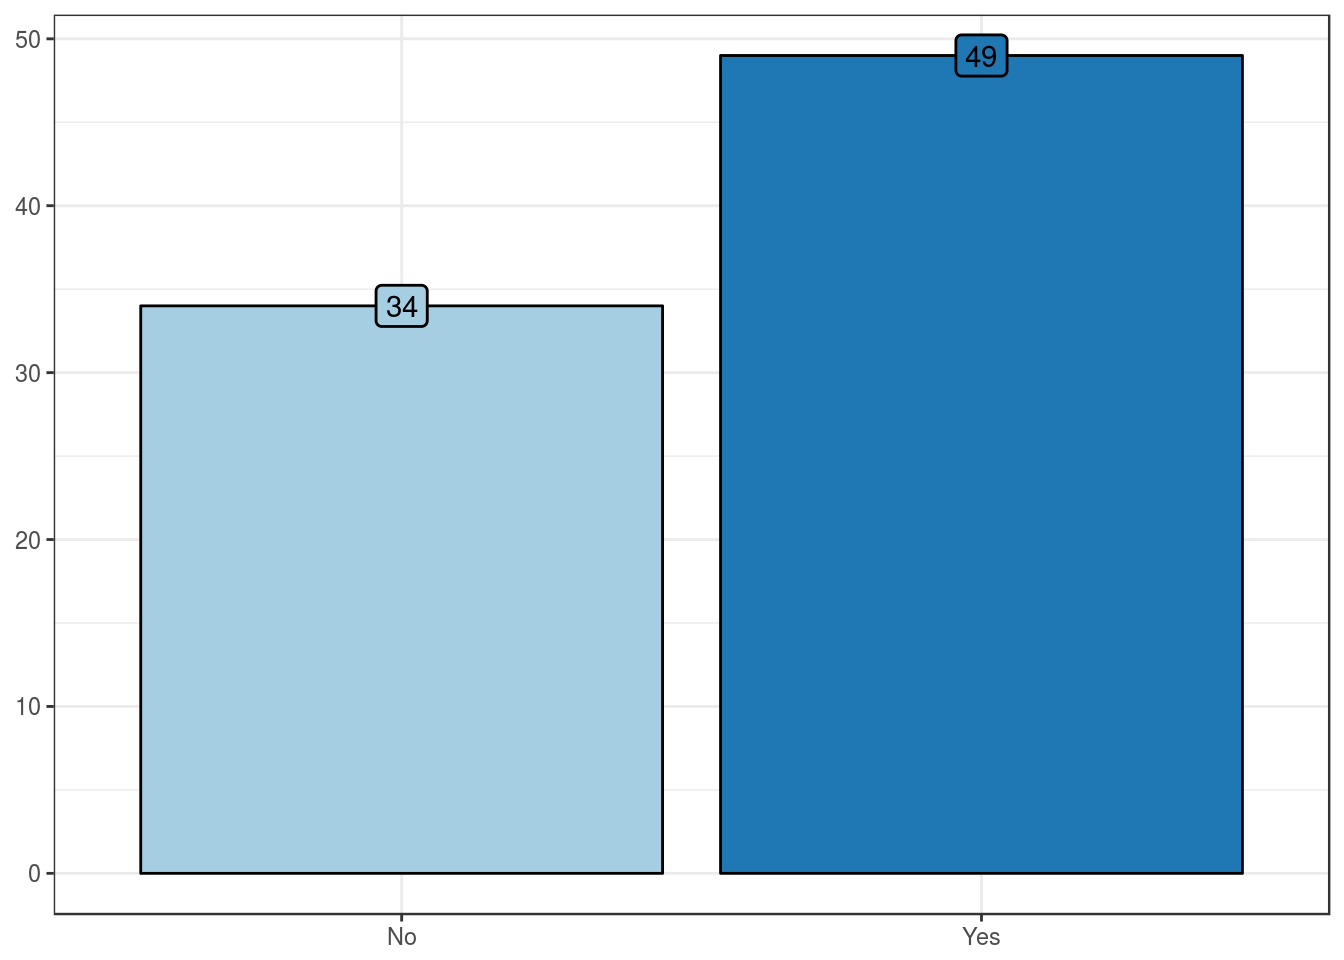
Tumor progression
| No. Cases (%) | |
|---|---|
| No | 34 (41) |
| Yes | 49 (59) |
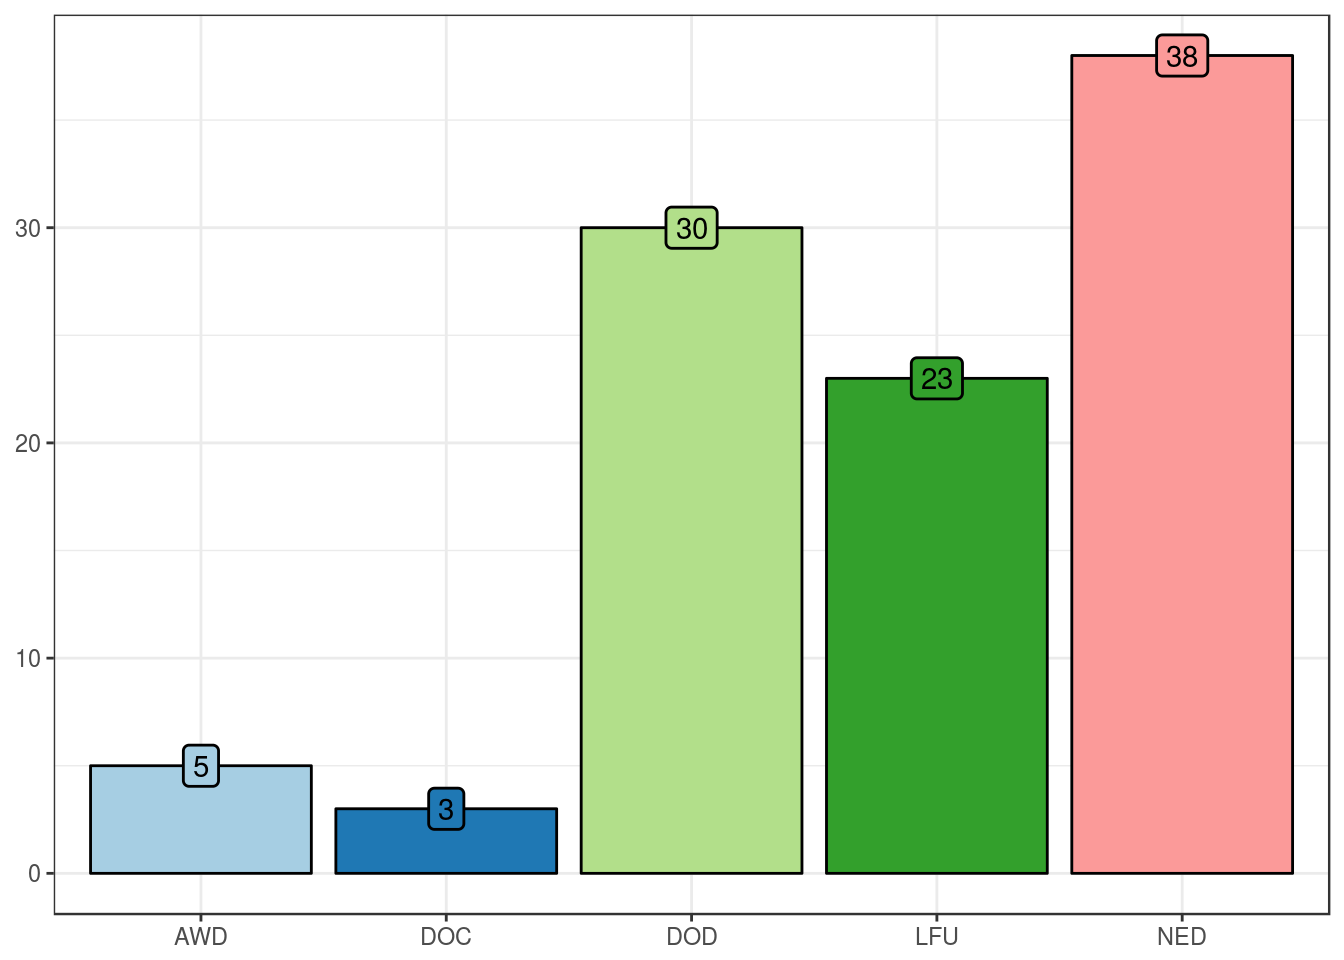
Final outcome
| No. Cases (%) | |
|---|---|
| AWD | 5 (5) |
| DOC | 3 (3) |
| DOD | 30 (30) |
| LFU | 23 (23) |
| NED | 38 (38) |
