CD8 positivity in stromal lymphocytes
Clinical features
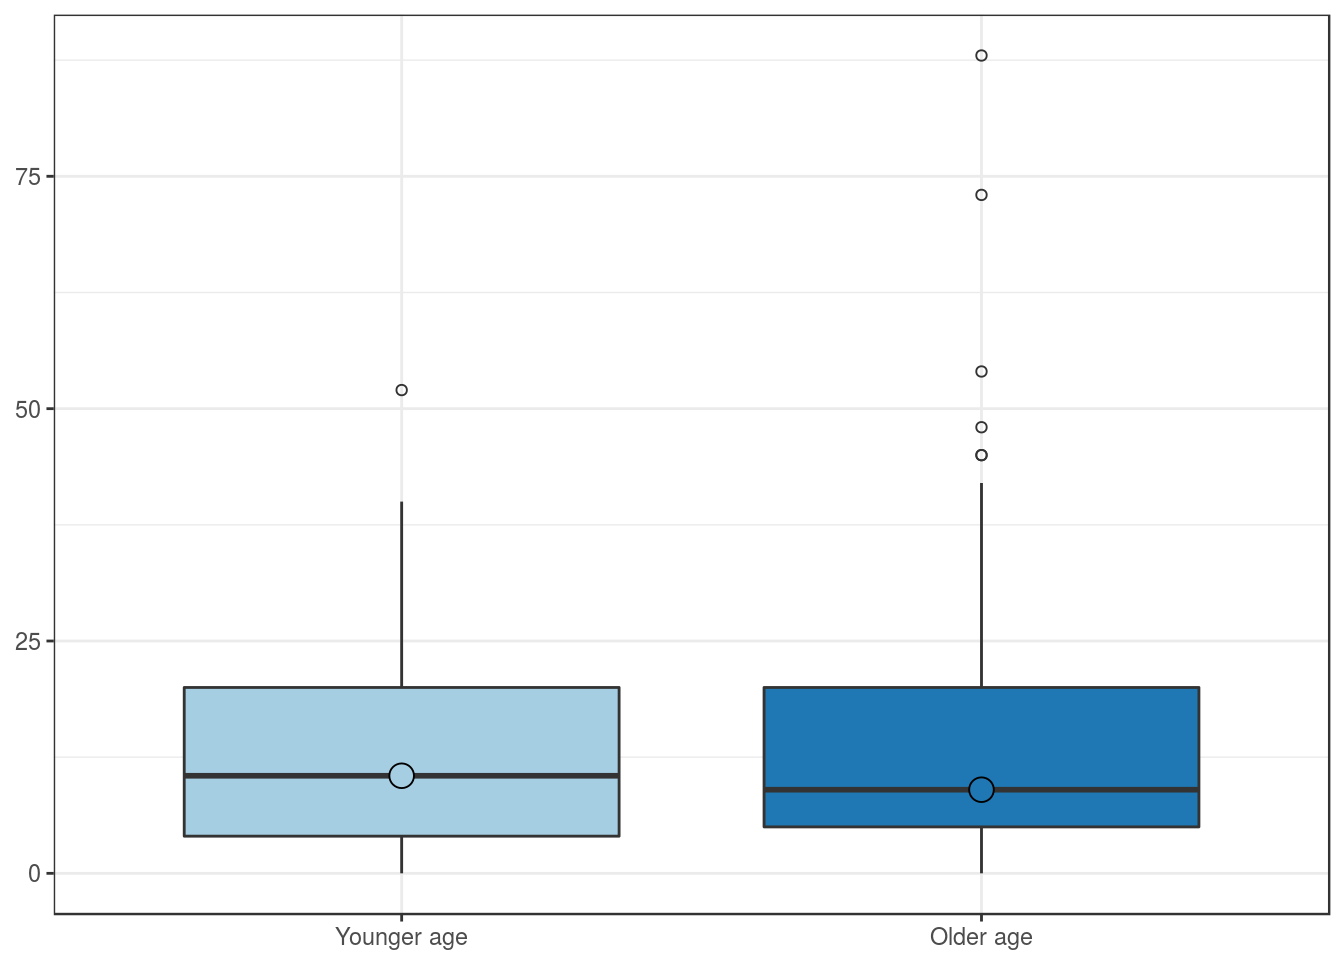
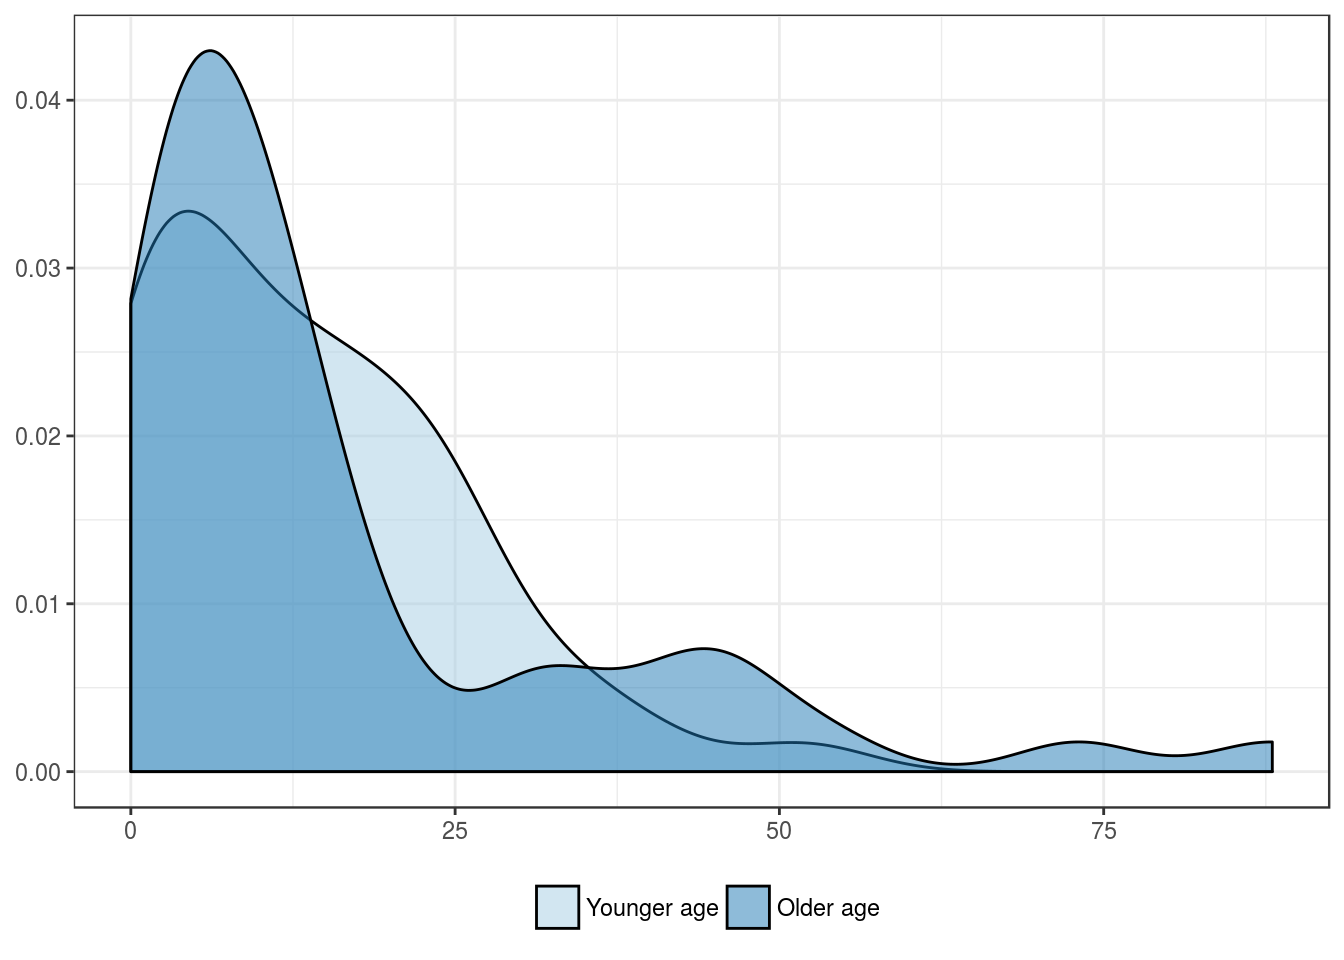
Expression by patient’s age group
| Younger age | Older age | |
|---|---|---|
| Mean | 13.4 | 16.6 |
| Standard deviation | 12.0 | 19.5 |
| Median | 10.5 | 9.0 |
| Interquartile range | 16.0 | 15.0 |
| Minimum | 0.0 | 0.0 |
| Maximum | 52.0 | 88.0 |
| Value | |
|---|---|
| U-statistic | 1206 |
| P statistic | 8.9e-01 |
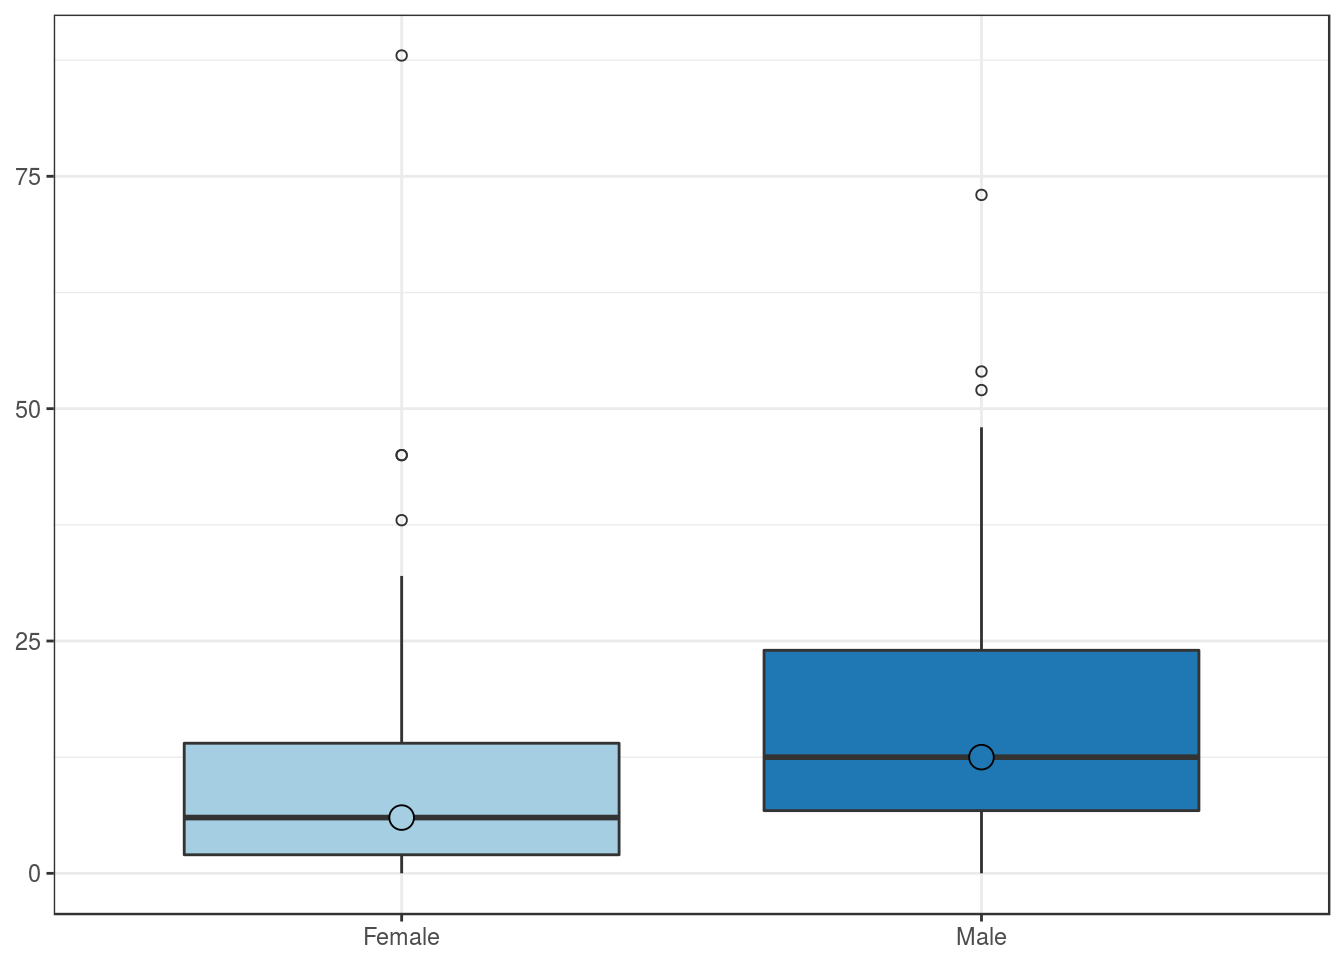
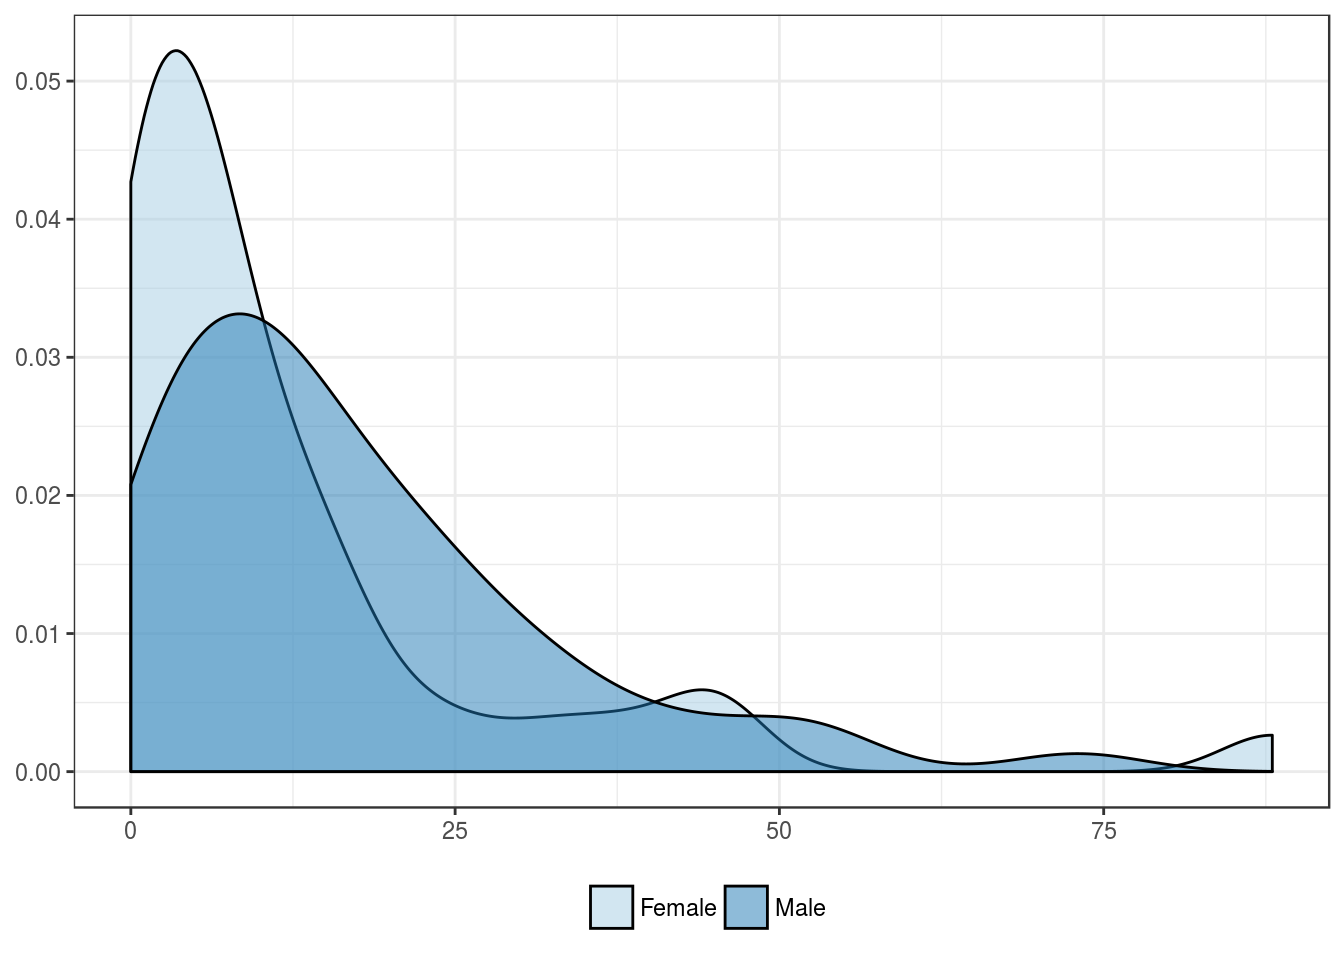
Expression by patient’s sex
| Female | Male | |
|---|---|---|
| Mean | 12.1 | 16.9 |
| Standard deviation | 17.3 | 15.2 |
| Median | 6.0 | 12.5 |
| Interquartile range | 12.0 | 17.2 |
| Minimum | 0.0 | 0.0 |
| Maximum | 88.0 | 73.0 |
| Value | |
|---|---|
| U-statistic | 809 |
| P statistic | 9.7e-03 |
Pathologic features
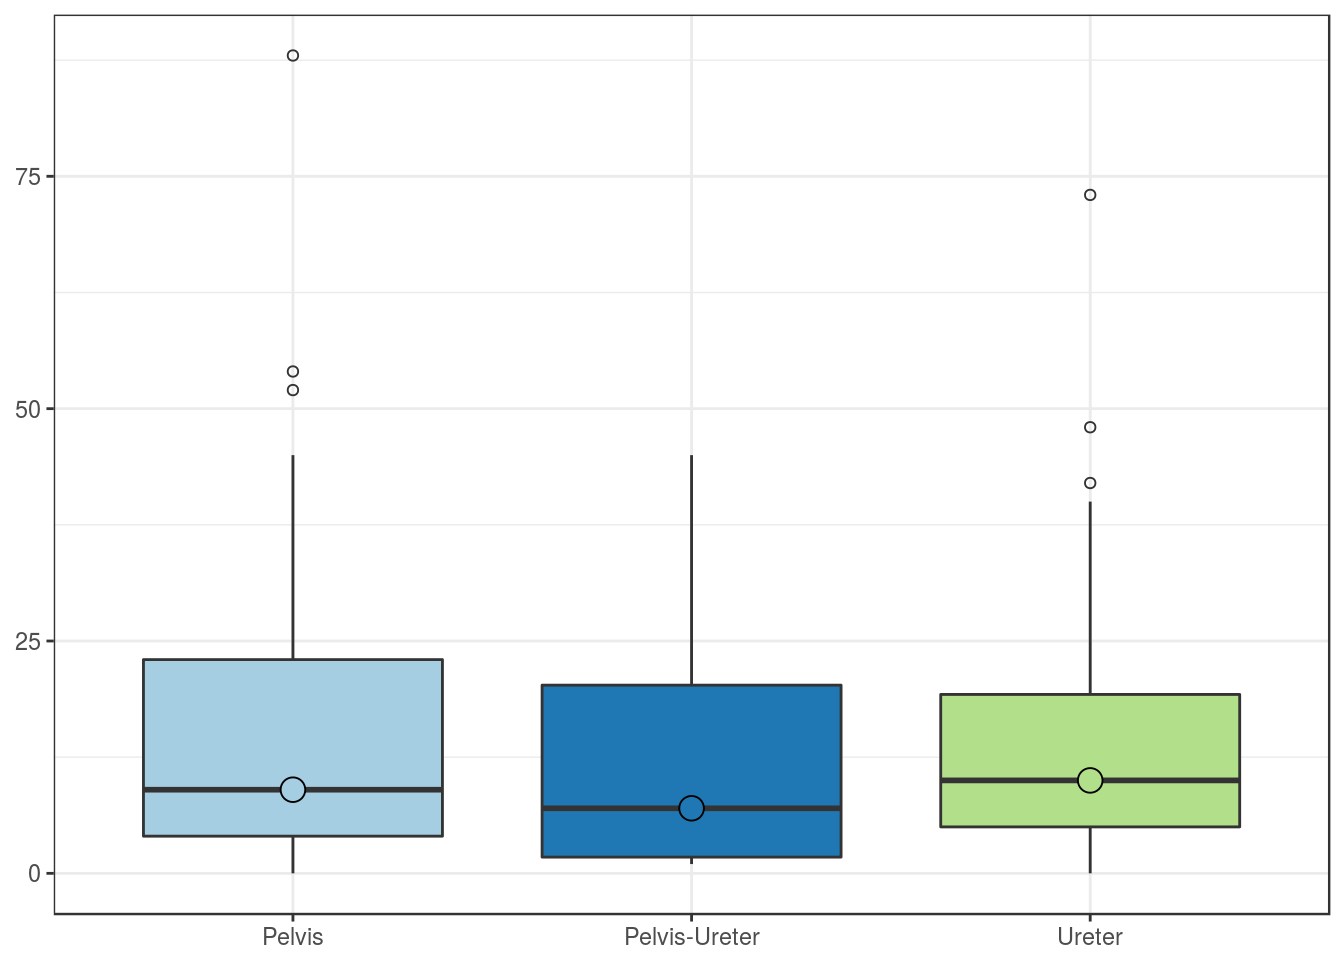
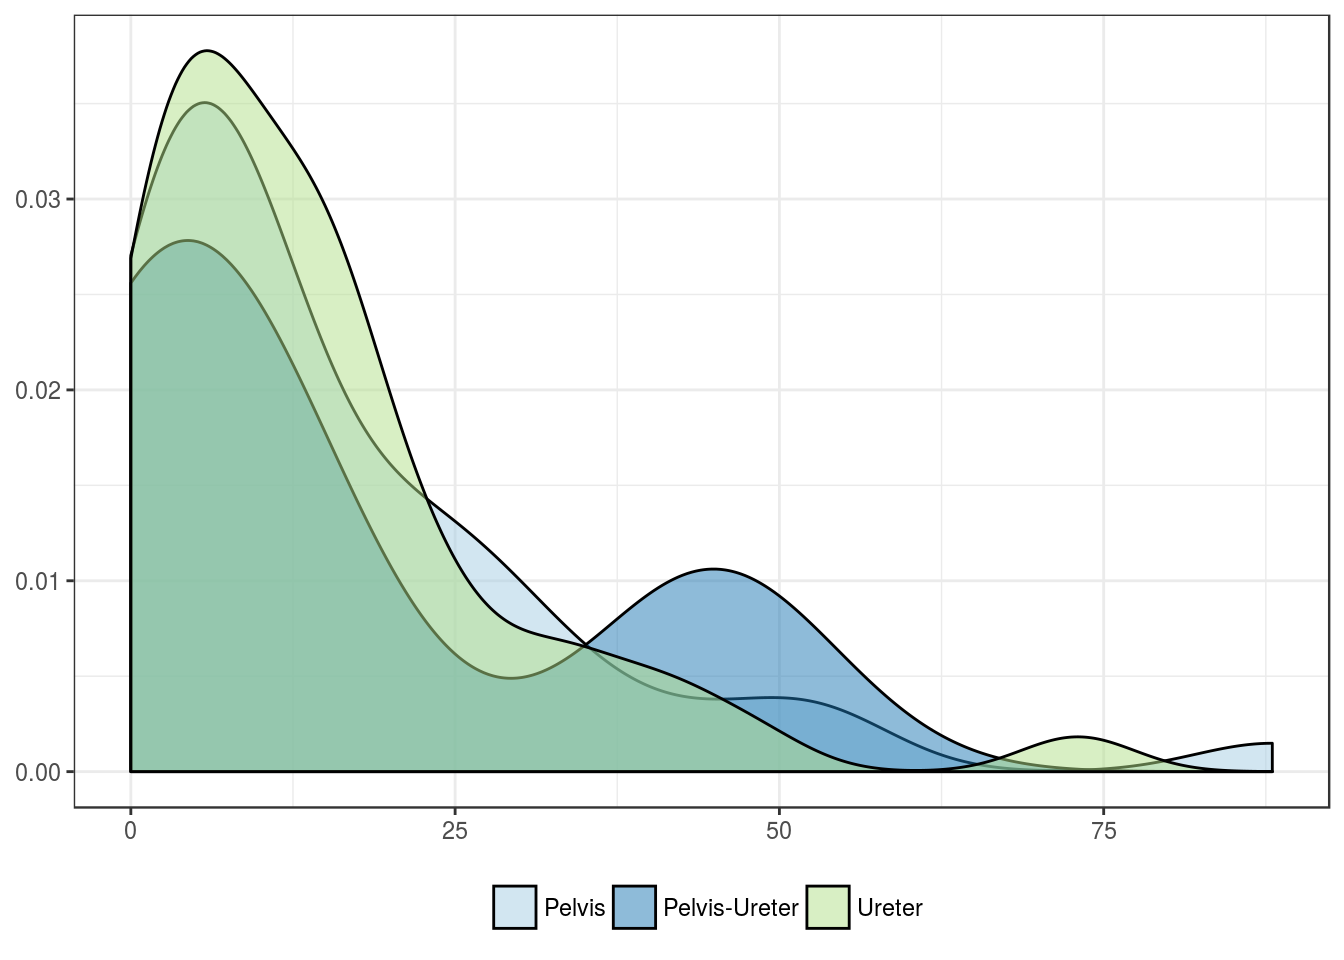
Expression by tumor location
| Pelvis | Pelvis-Ureter | Ureter | |
|---|---|---|---|
| Mean | 15.6 | 15.0 | 14.4 |
| Standard deviation | 17.8 | 20.6 | 14.5 |
| Median | 9.0 | 7.0 | 10.0 |
| Interquartile range | 19.0 | 18.5 | 14.2 |
| Minimum | 0.0 | 1.0 | 0.0 |
| Maximum | 88.0 | 45.0 | 73.0 |
| Value | |
|---|---|
| Statistic | 0.1327 |
| Parameter | 2 |
| P statistic | 0.94 |
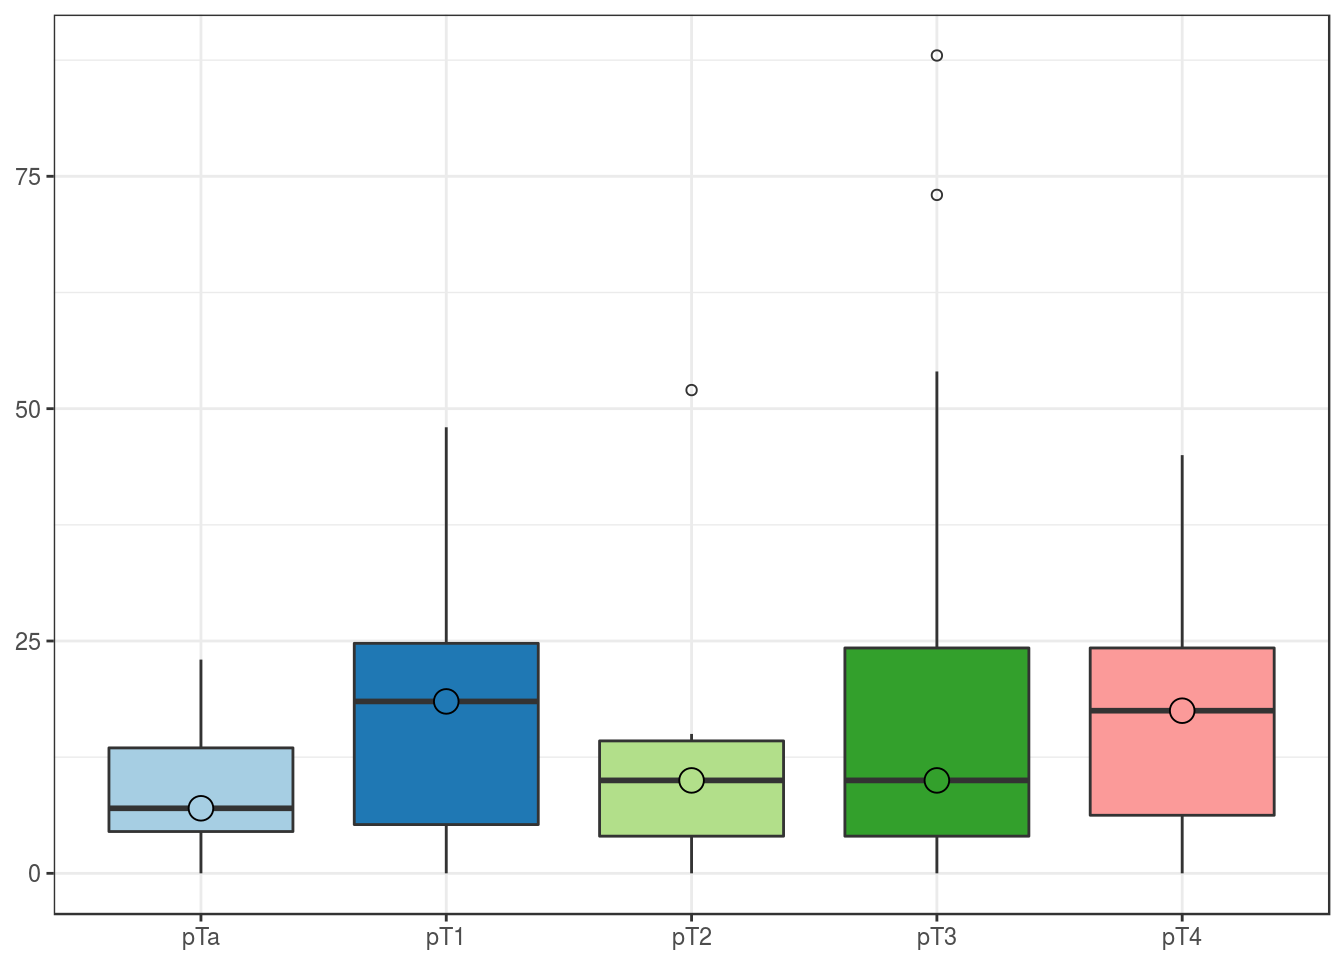
Expression by pT
| pTa | pT1 | pT2 | pT3 | pT4 | |
|---|---|---|---|---|---|
| Mean | 9.2 | 17.4 | 13.4 | 16.2 | 18.2 |
| Standard deviation | 6.9 | 13.9 | 16.6 | 19.1 | 16.4 |
| Median | 7.0 | 18.5 | 10.0 | 10.0 | 17.5 |
| Interquartile range | 9.0 | 19.5 | 10.2 | 20.2 | 18.0 |
| Minimum | 0.0 | 0.0 | 0.0 | 0.0 | 0.0 |
| Maximum | 23.0 | 48.0 | 52.0 | 88.0 | 45.0 |
| Value | |
|---|---|
| Statistic | 2.979 |
| Parameter | 4 |
| P statistic | 0.56 |
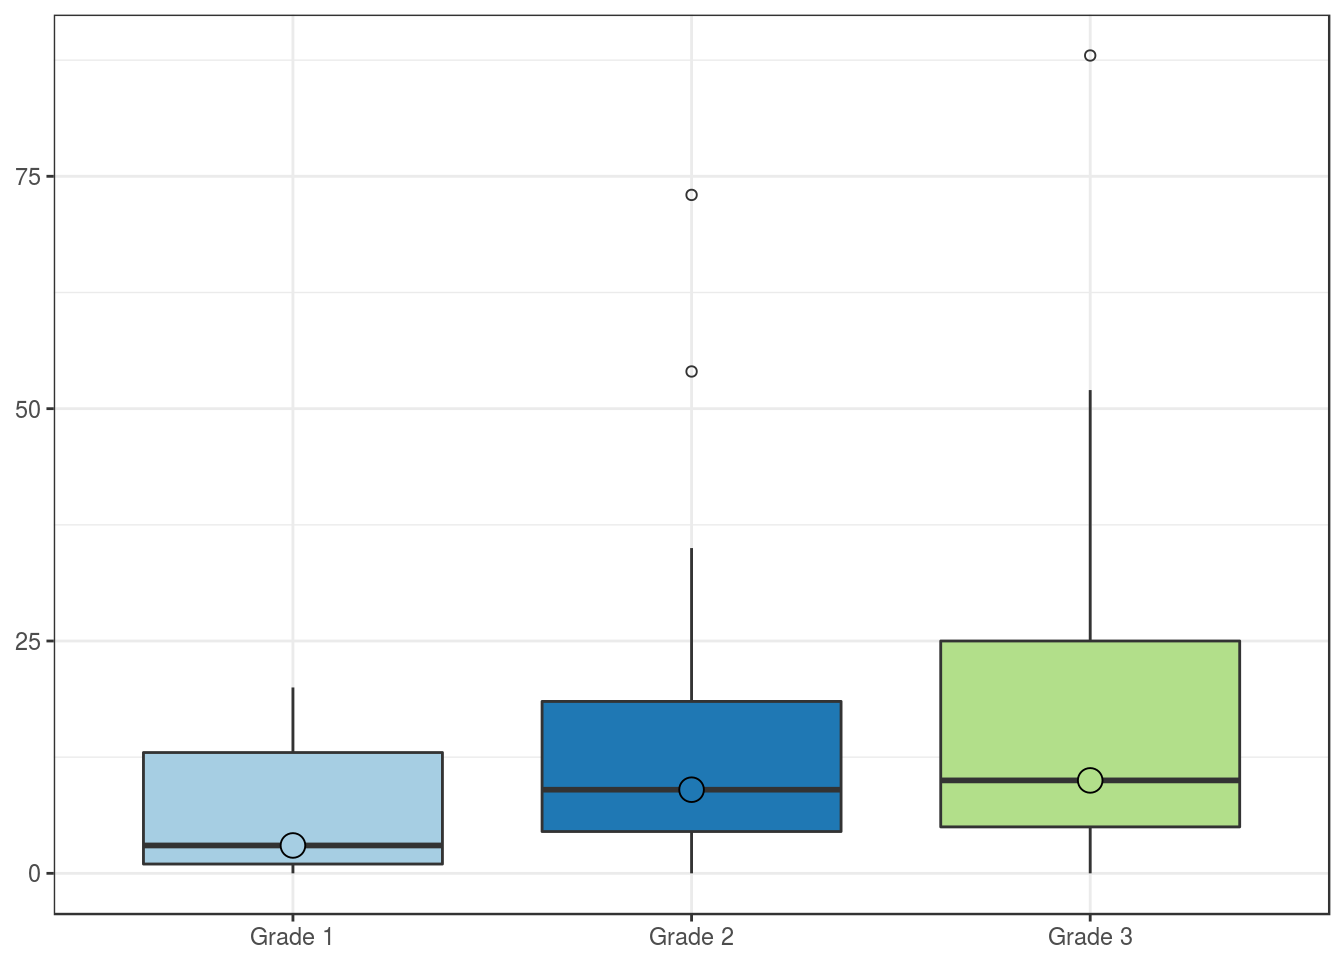
Expression by histologic grade
| Grade 1 | Grade 2 | Grade 3 | |
|---|---|---|---|
| Mean | 7.3 | 13.8 | 16.9 |
| Standard deviation | 8.0 | 14.9 | 17.6 |
| Median | 3.0 | 9.0 | 10.0 |
| Interquartile range | 12.0 | 14.0 | 20.0 |
| Minimum | 0.0 | 0.0 | 0.0 |
| Maximum | 20.0 | 73.0 | 88.0 |
| Value | |
|---|---|
| Statistic | 2.351 |
| Parameter | 2 |
| P statistic | 0.31 |
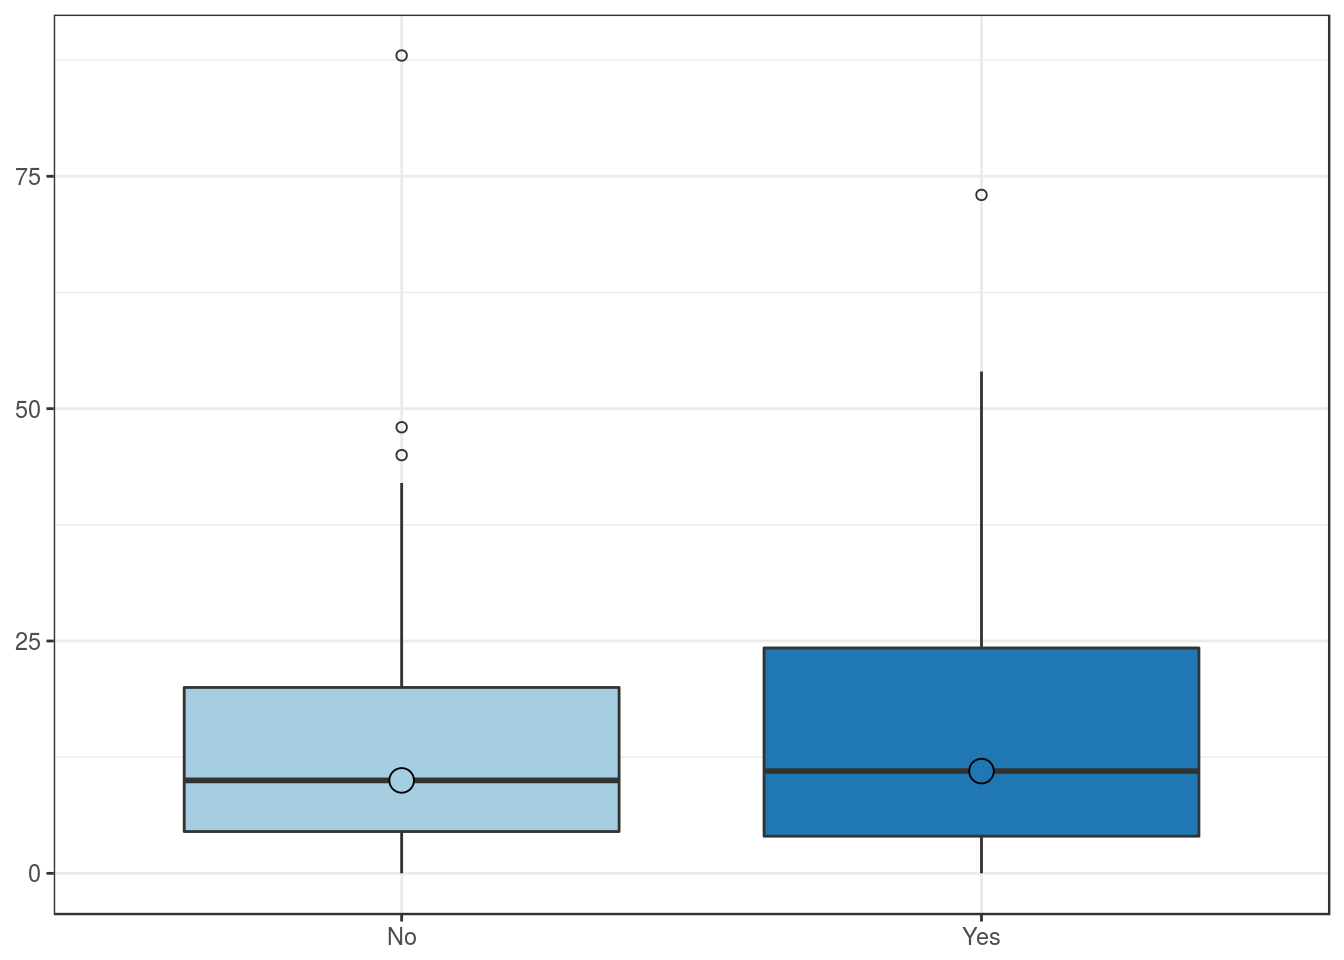
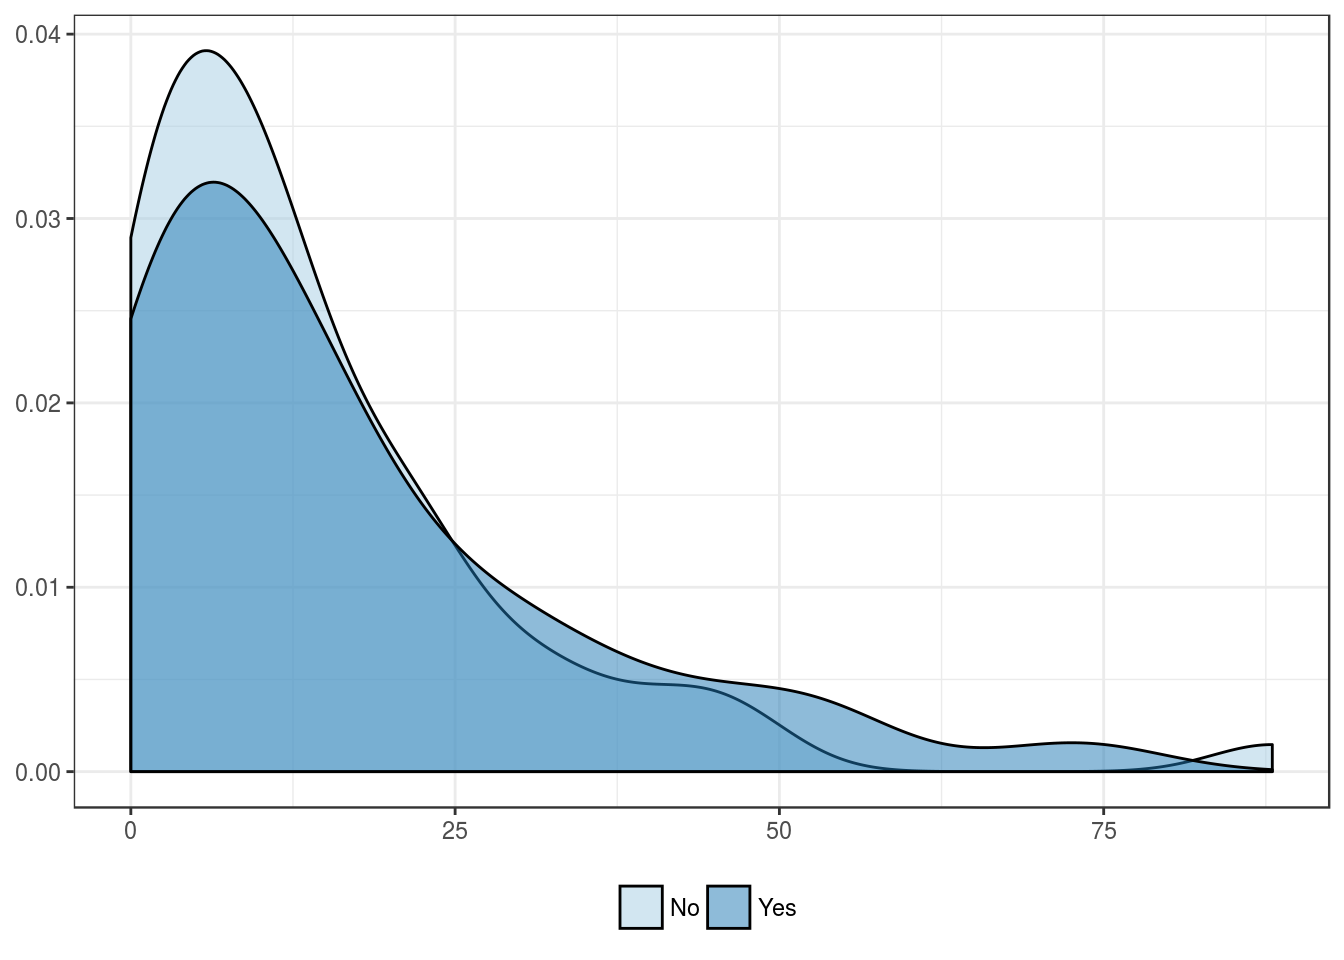
Expression by lymphovascular invasion
| No | Yes | |
|---|---|---|
| Mean | 14.0 | 16.4 |
| Standard deviation | 15.5 | 17.2 |
| Median | 10.0 | 11.0 |
| Interquartile range | 15.5 | 20.2 |
| Minimum | 0.0 | 0.0 |
| Maximum | 88.0 | 73.0 |
| Value | |
|---|---|
| U-statistic | 1094 |
| P statistic | 5.4e-01 |
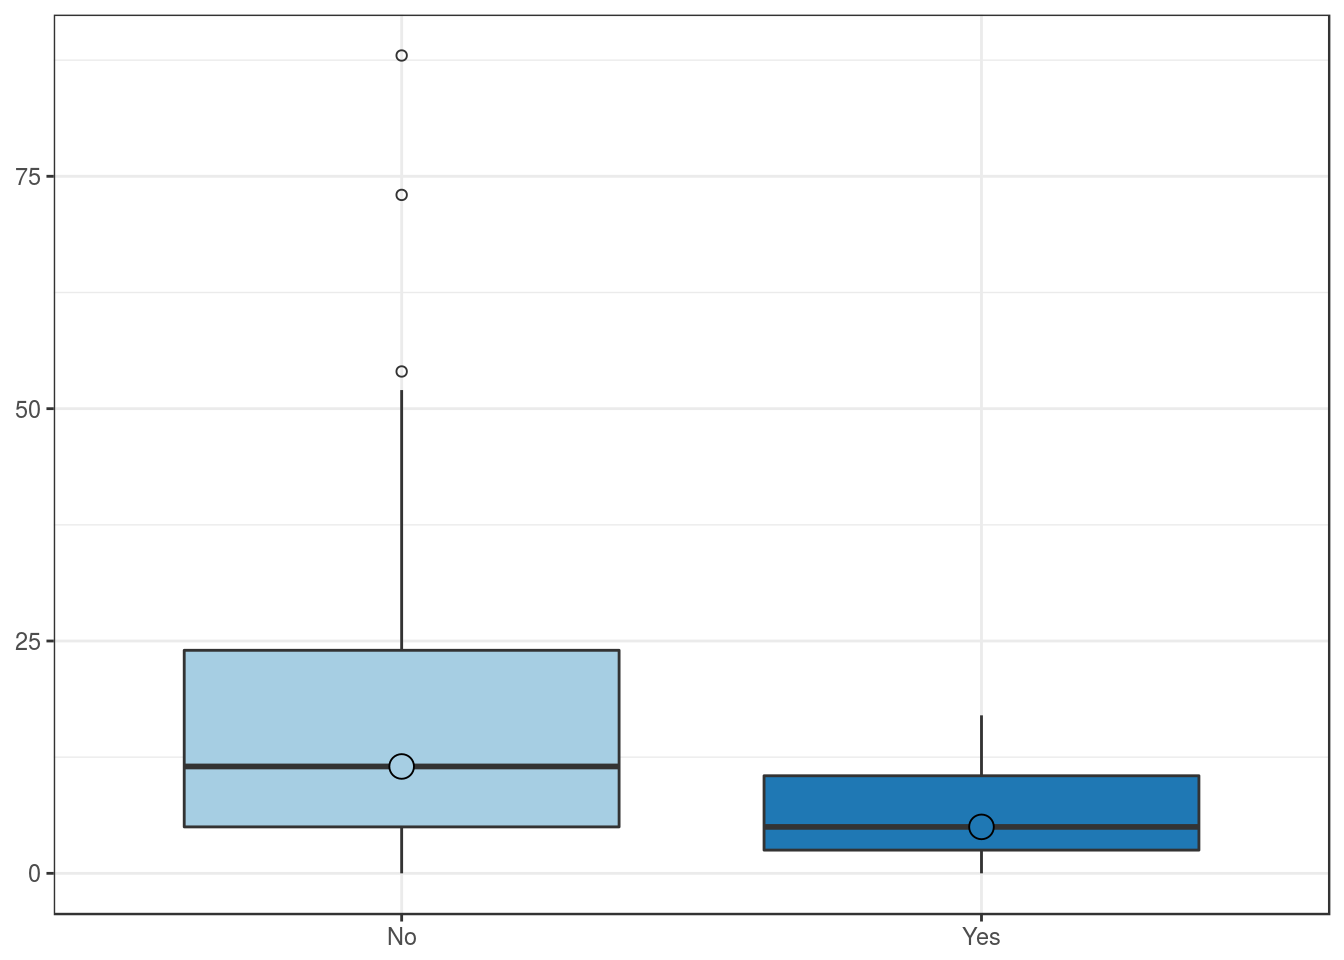
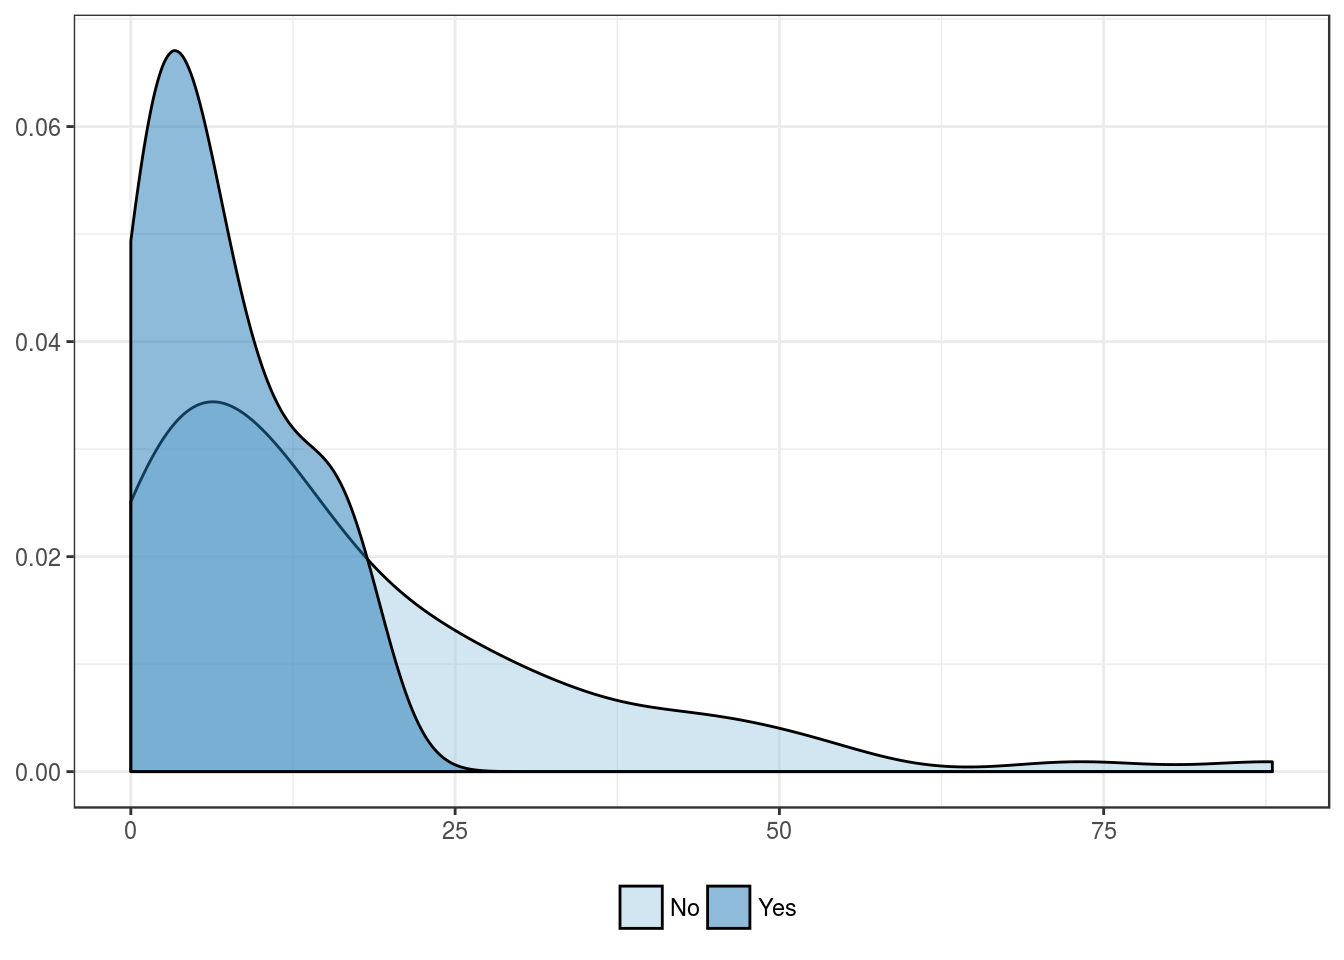
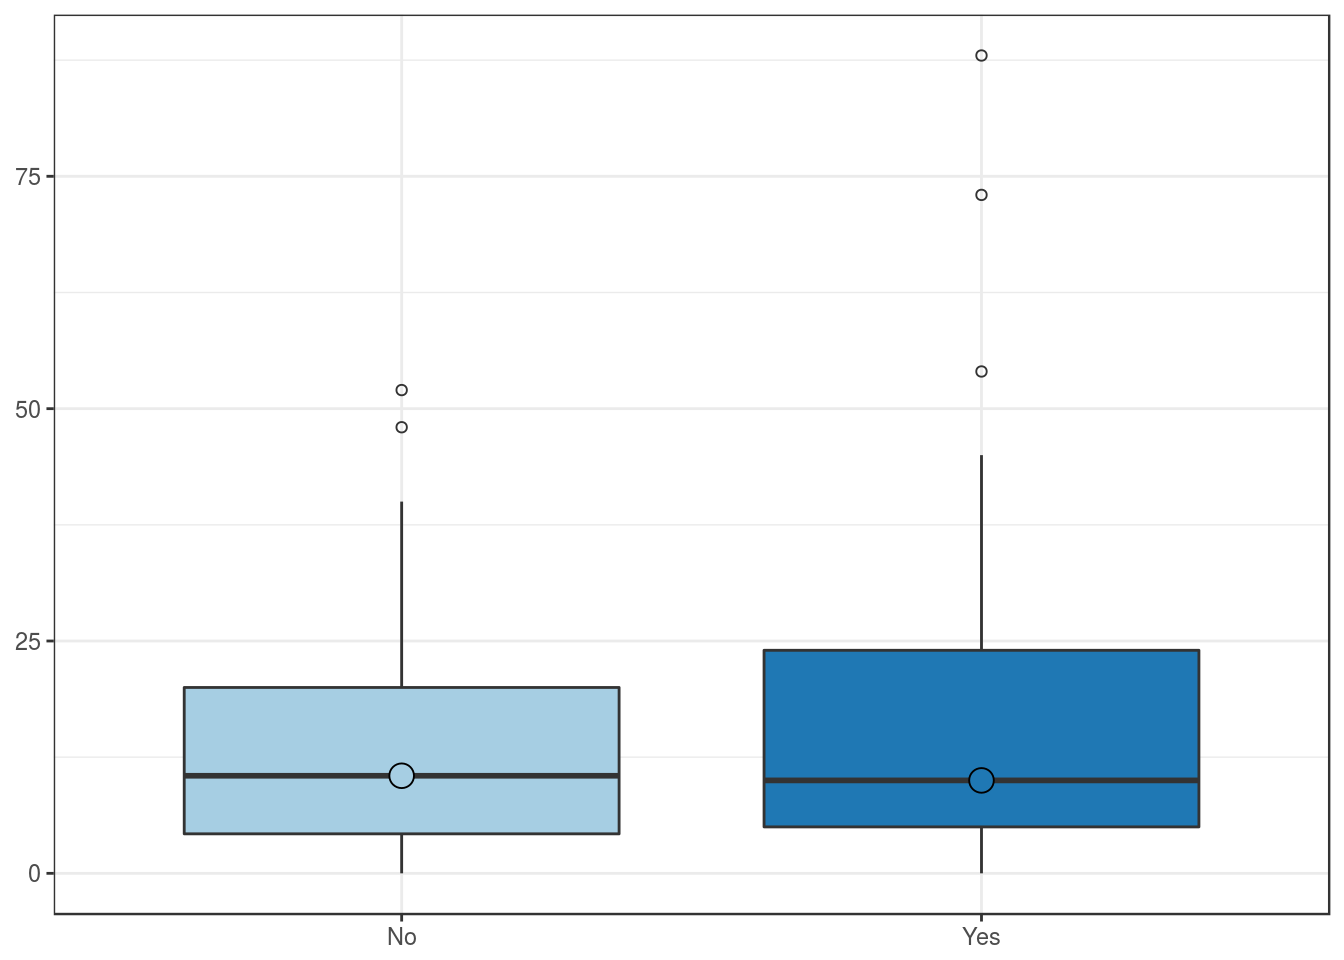
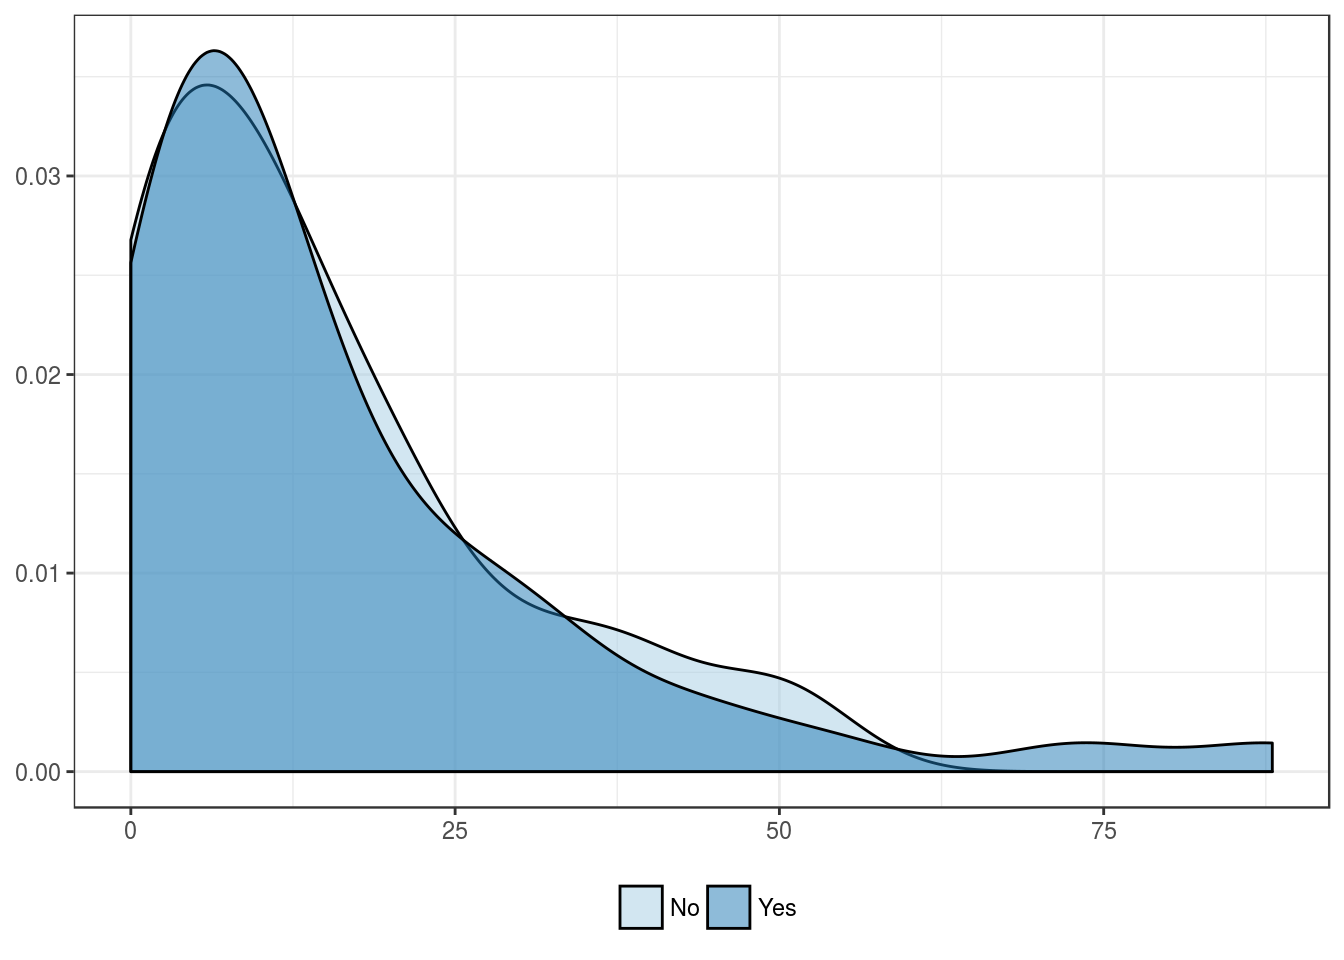
Expression by lymph node metastasis
| No | Yes | |
|---|---|---|
| Mean | 16.4 | 6.8 |
| Standard deviation | 17.0 | 5.8 |
| Median | 11.5 | 5.0 |
| Interquartile range | 19.0 | 8.0 |
| Minimum | 0.0 | 0.0 |
| Maximum | 88.0 | 17.0 |
| Value | |
|---|---|
| U-statistic | 678 |
| P statistic | 5.4e-02 |
Outcome features
Expression by bladder recurrence
| No | Yes | |
|---|---|---|
| Mean | 14.4 | 16.6 |
| Standard deviation | 15.4 | 18.0 |
| Median | 10.0 | 12.0 |
| Interquartile range | 16.0 | 19.5 |
| Minimum | 0.0 | 0.0 |
| Maximum | 73.0 | 88.0 |
| Value | |
|---|---|
| U-statistic | 972 |
| P statistic | 6e-01 |
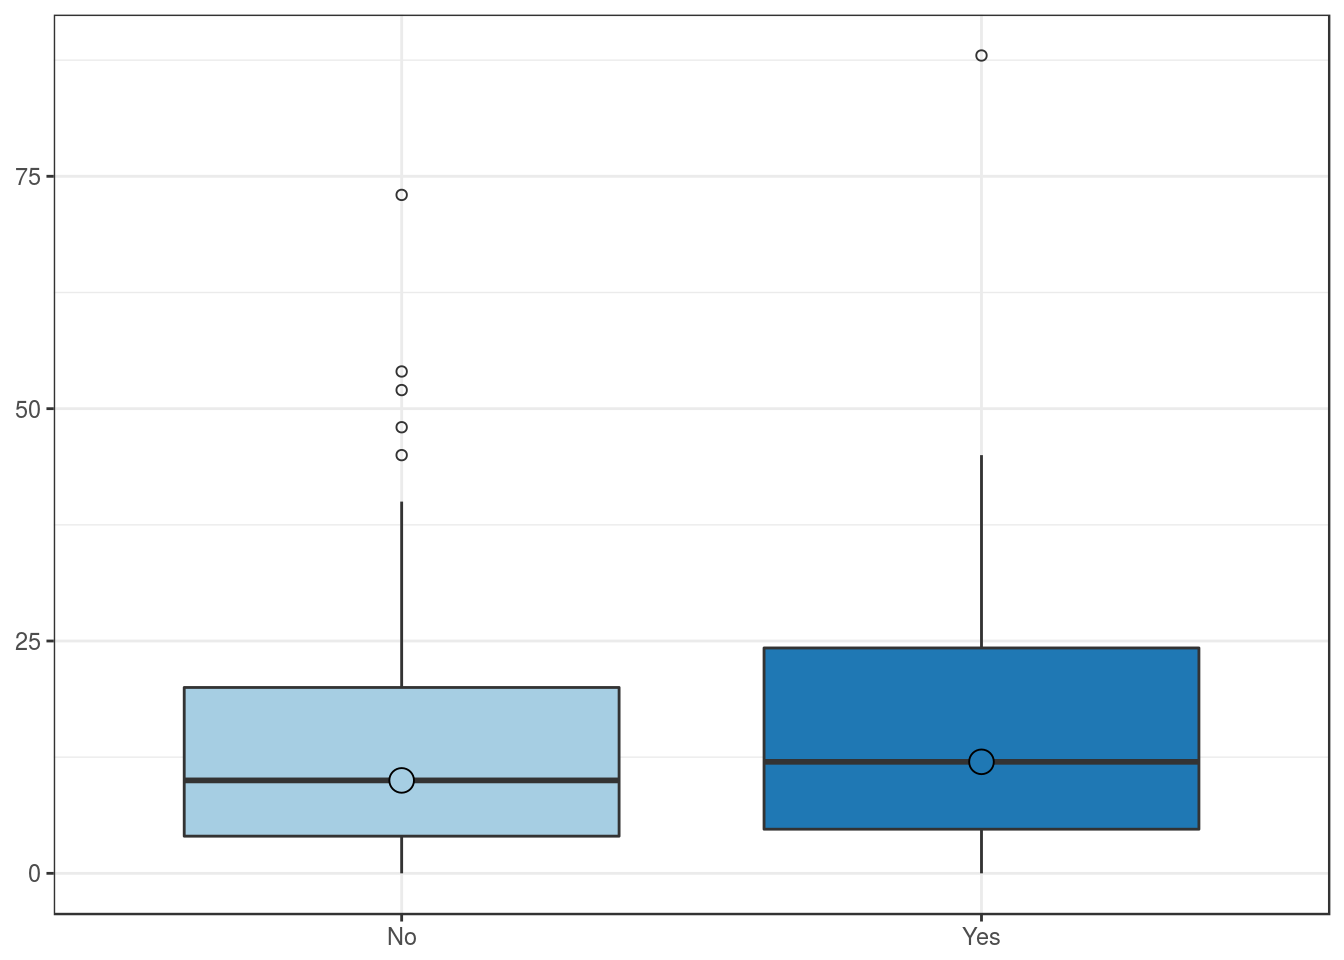
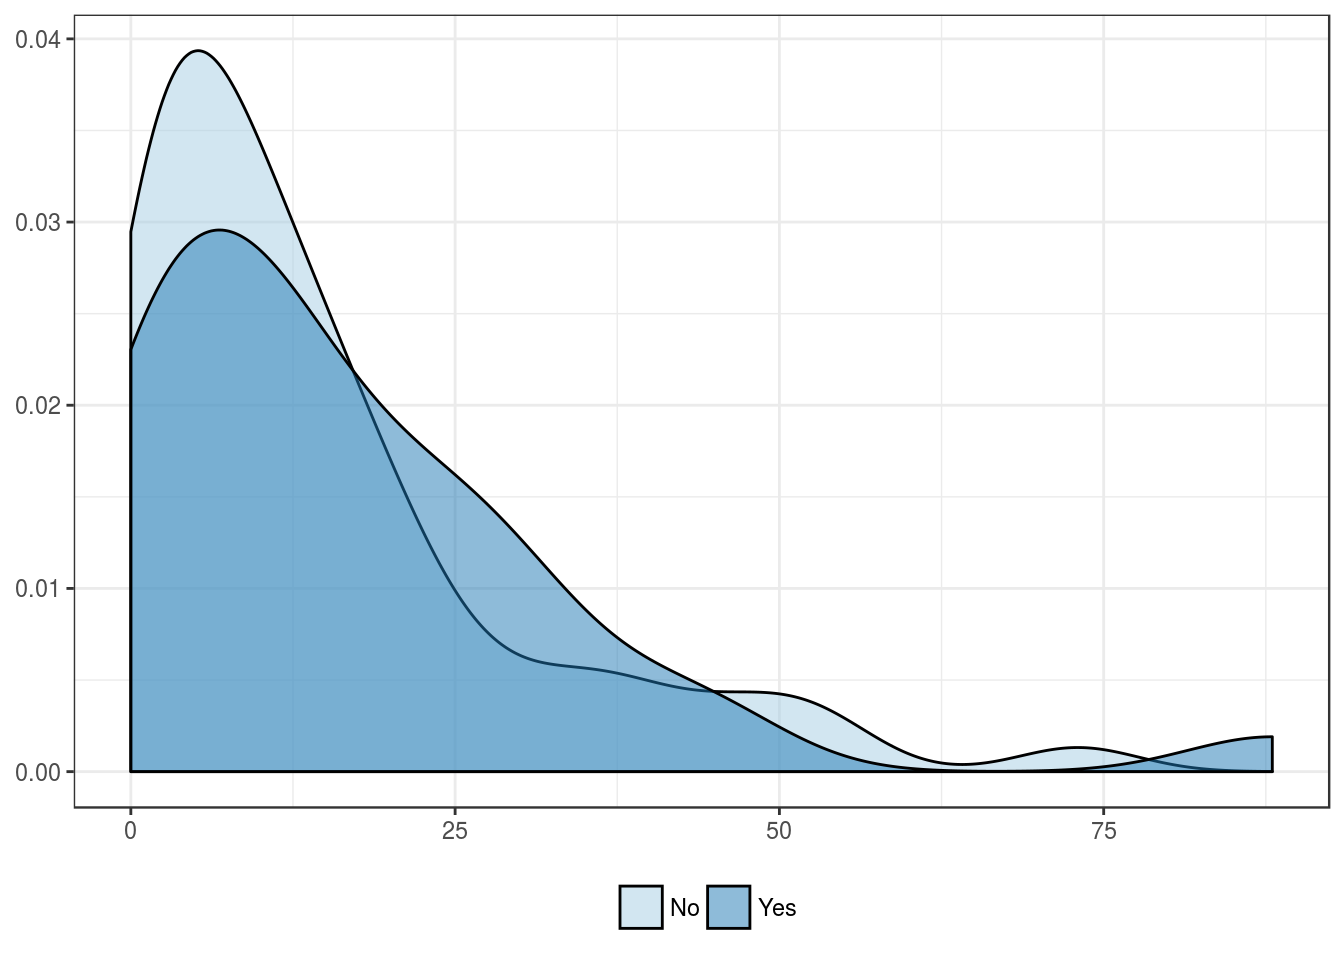
Expression by tumor progression
| No | Yes | |
|---|---|---|
| Mean | 14.7 | 16.3 |
| Standard deviation | 14.2 | 18.5 |
| Median | 10.5 | 10.0 |
| Interquartile range | 15.8 | 19.0 |
| Minimum | 0.0 | 0.0 |
| Maximum | 52.0 | 88.0 |
| Value | |
|---|---|
| U-statistic | 820 |
| P statistic | 9.1e-01 |
Expression by overall mortality
| ANED + AWD + DOC + LFU | DOD + DOC | |
|---|---|---|
| Mean | 14.3 | 16.4 |
| Standard deviation | 12.5 | 21.9 |
| Median | 10.5 | 7.0 |
| Interquartile range | 14.8 | 13.0 |
| Minimum | 0.0 | 0.0 |
| Maximum | 52.0 | 88.0 |
| Value | |
|---|---|
| U-statistic | 1212 |
| P statistic | 3.6e-01 |
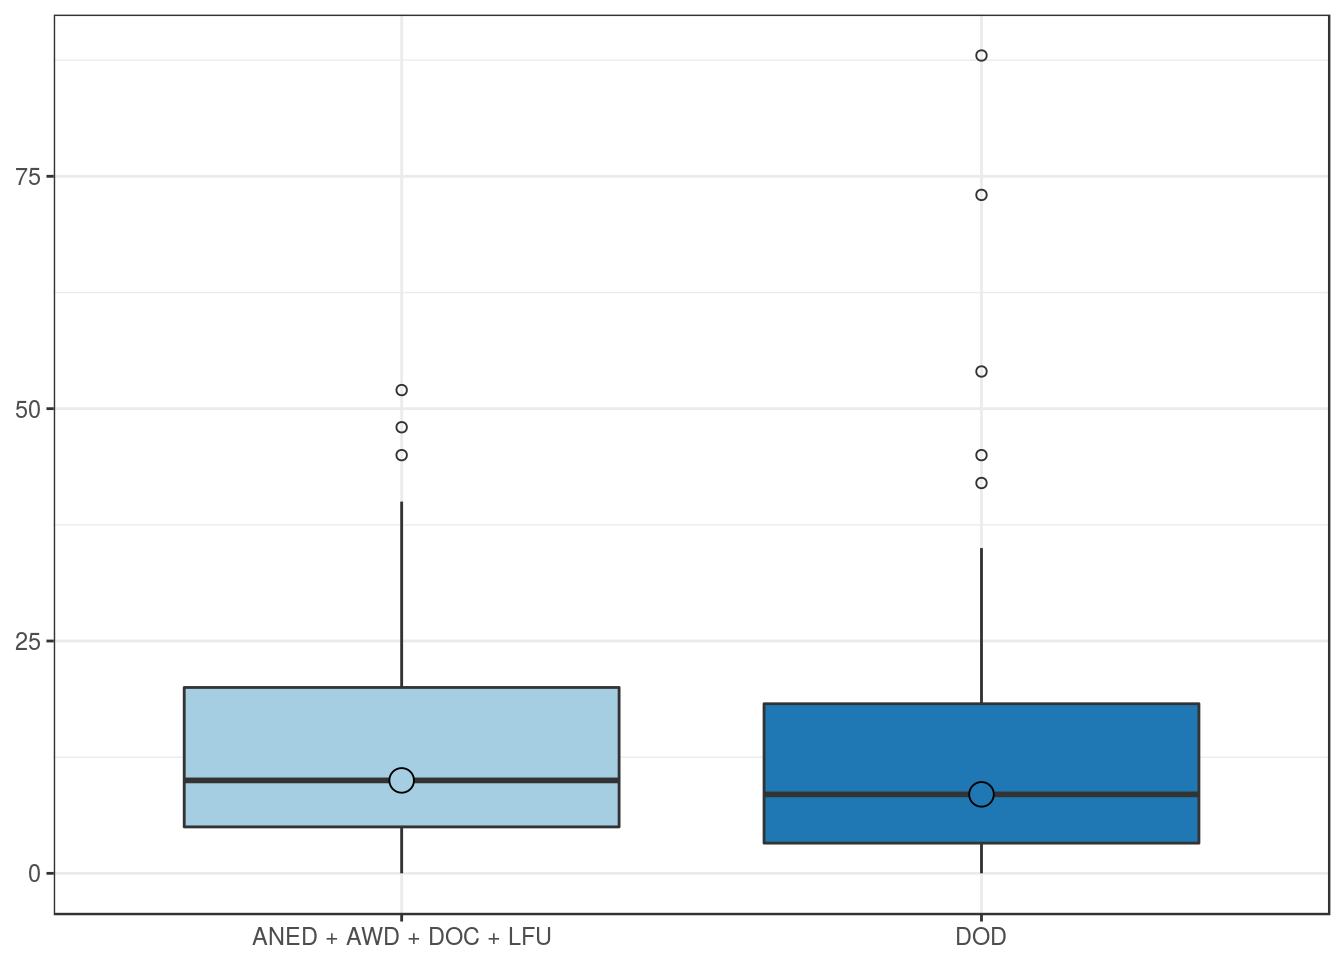
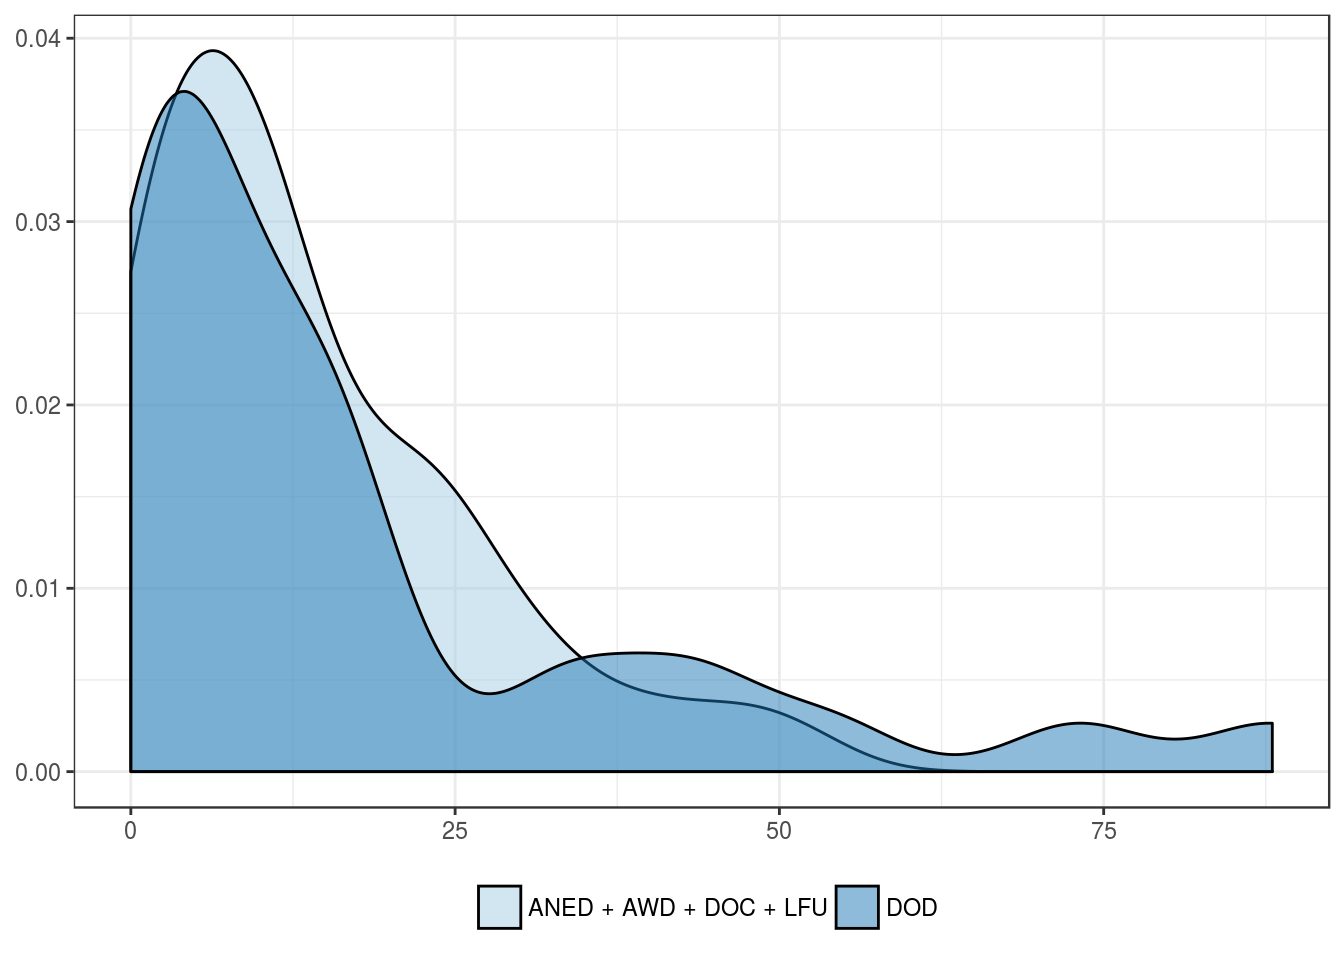
Expression by cancer-related mortality
| ANED + AWD + DOC + LFU | DOD | |
|---|---|---|
| Mean | 13.8 | 17.8 |
| Standard deviation | 12.5 | 22.4 |
| Median | 10.0 | 8.5 |
| Interquartile range | 15.0 | 15.0 |
| Minimum | 0.0 | 0.0 |
| Maximum | 52.0 | 88.0 |
| Value | |
|---|---|
| U-statistic | 1050 |
| P statistic | 9.1e-01 |