PD-L1 positivity in stromal lymphocytes
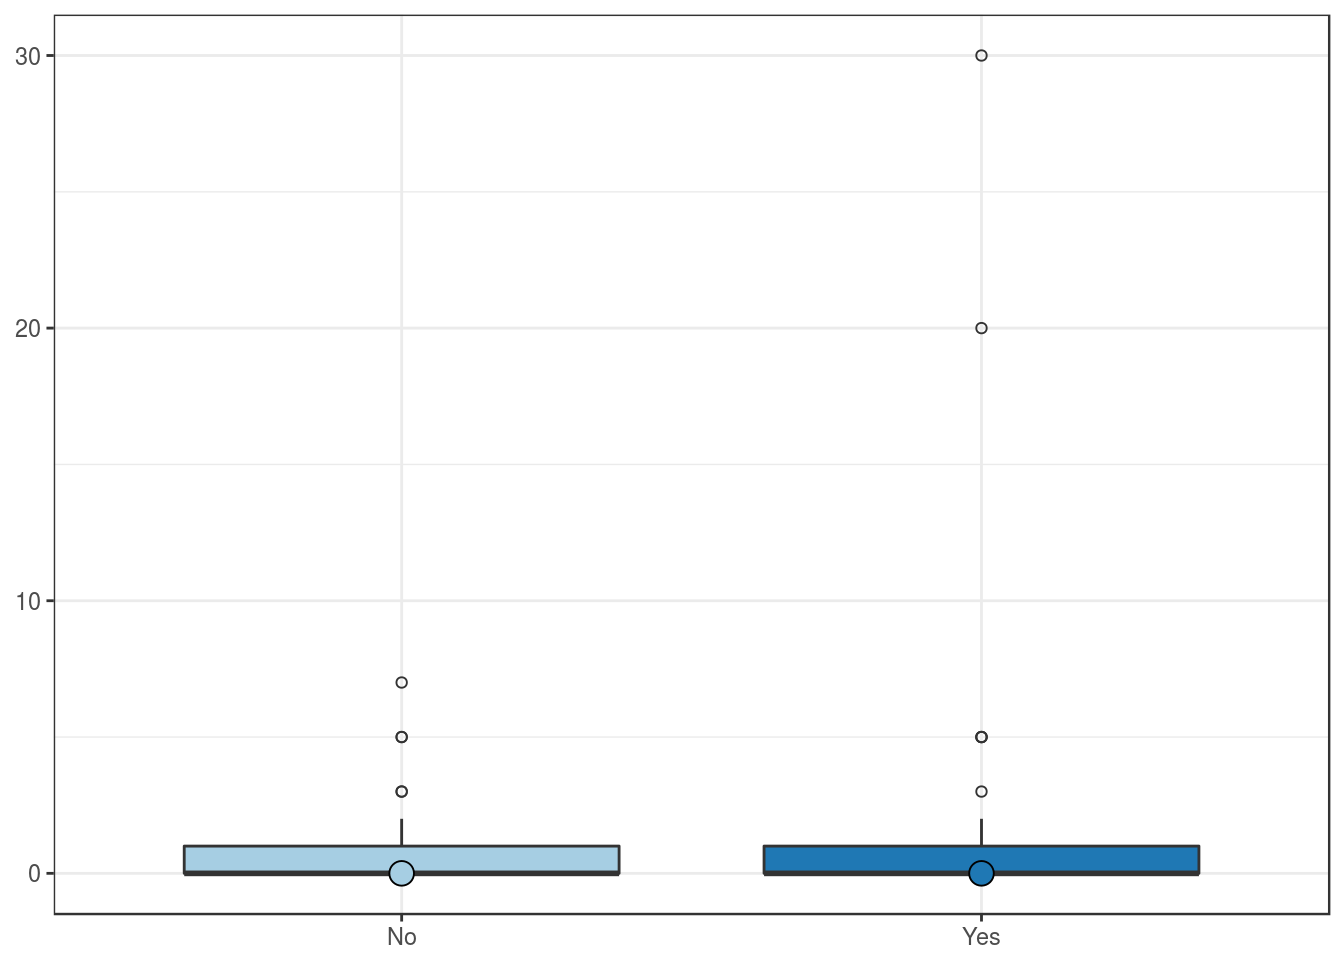
Clinical features
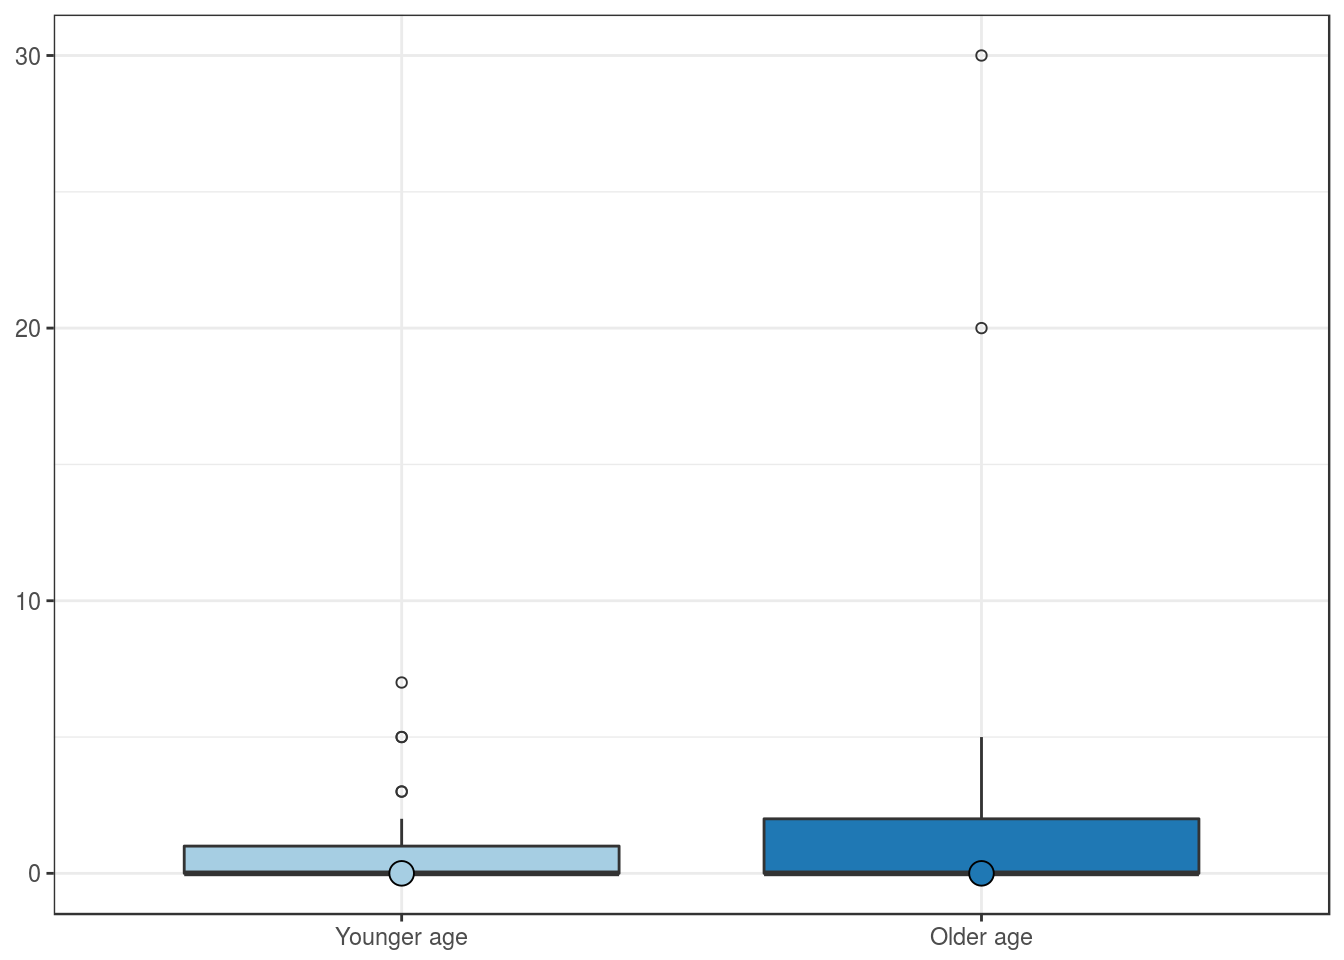
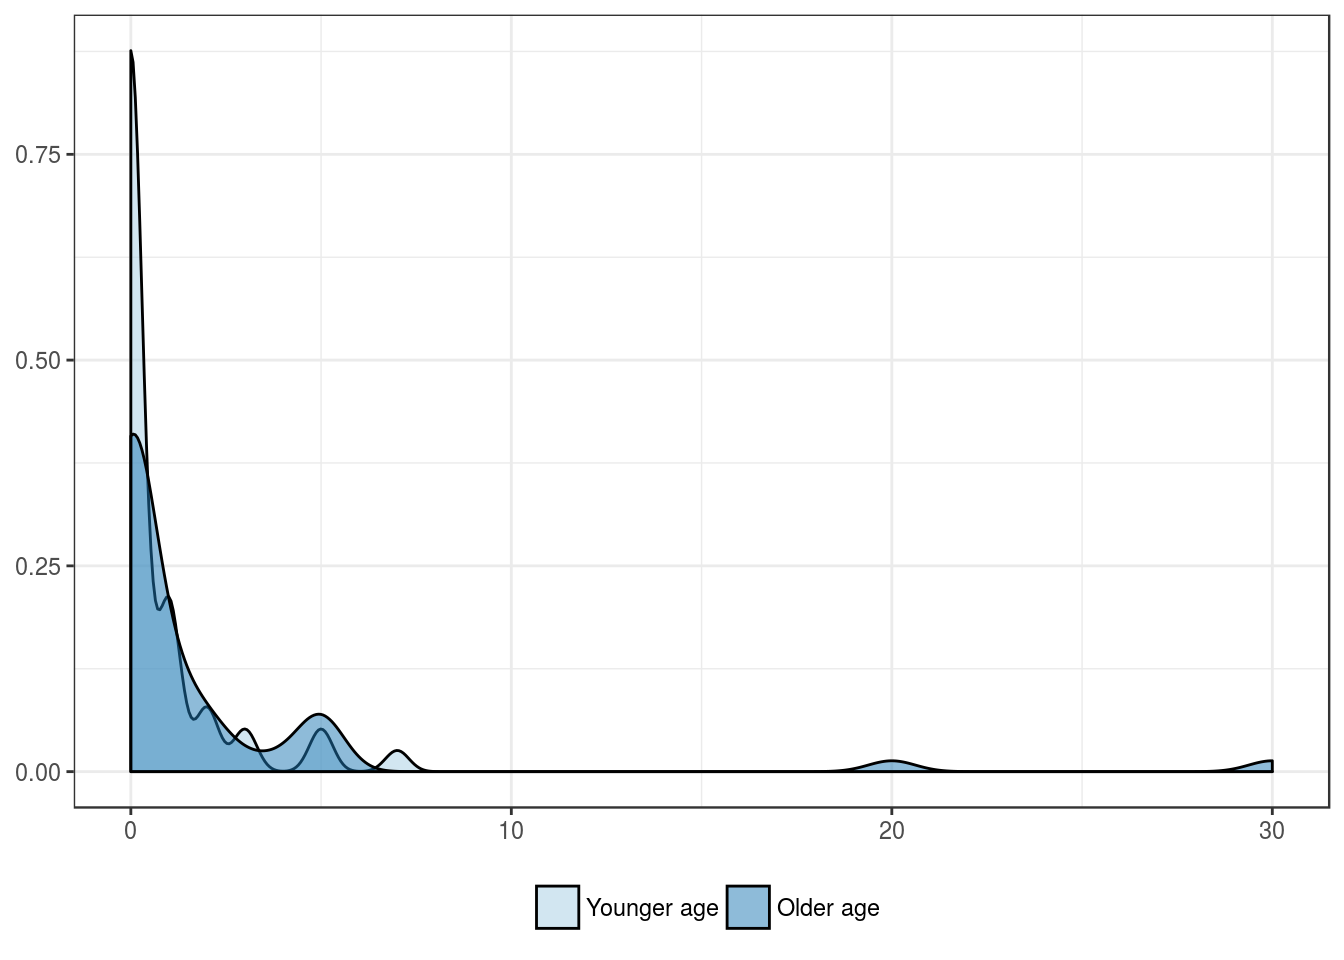
Expression by patient’s age group
| Younger age | Older age | |
|---|---|---|
| Mean | 0.7 | 2.0 |
| Standard deviation | 1.5 | 5.2 |
| Median | 0.0 | 0.0 |
| Interquartile range | 1.0 | 2.0 |
| Minimum | 0.0 | 0.0 |
| Maximum | 7.0 | 30.0 |
| Value | |
|---|---|
| U-statistic | 1084 |
| P statistic | 2.5e-01 |
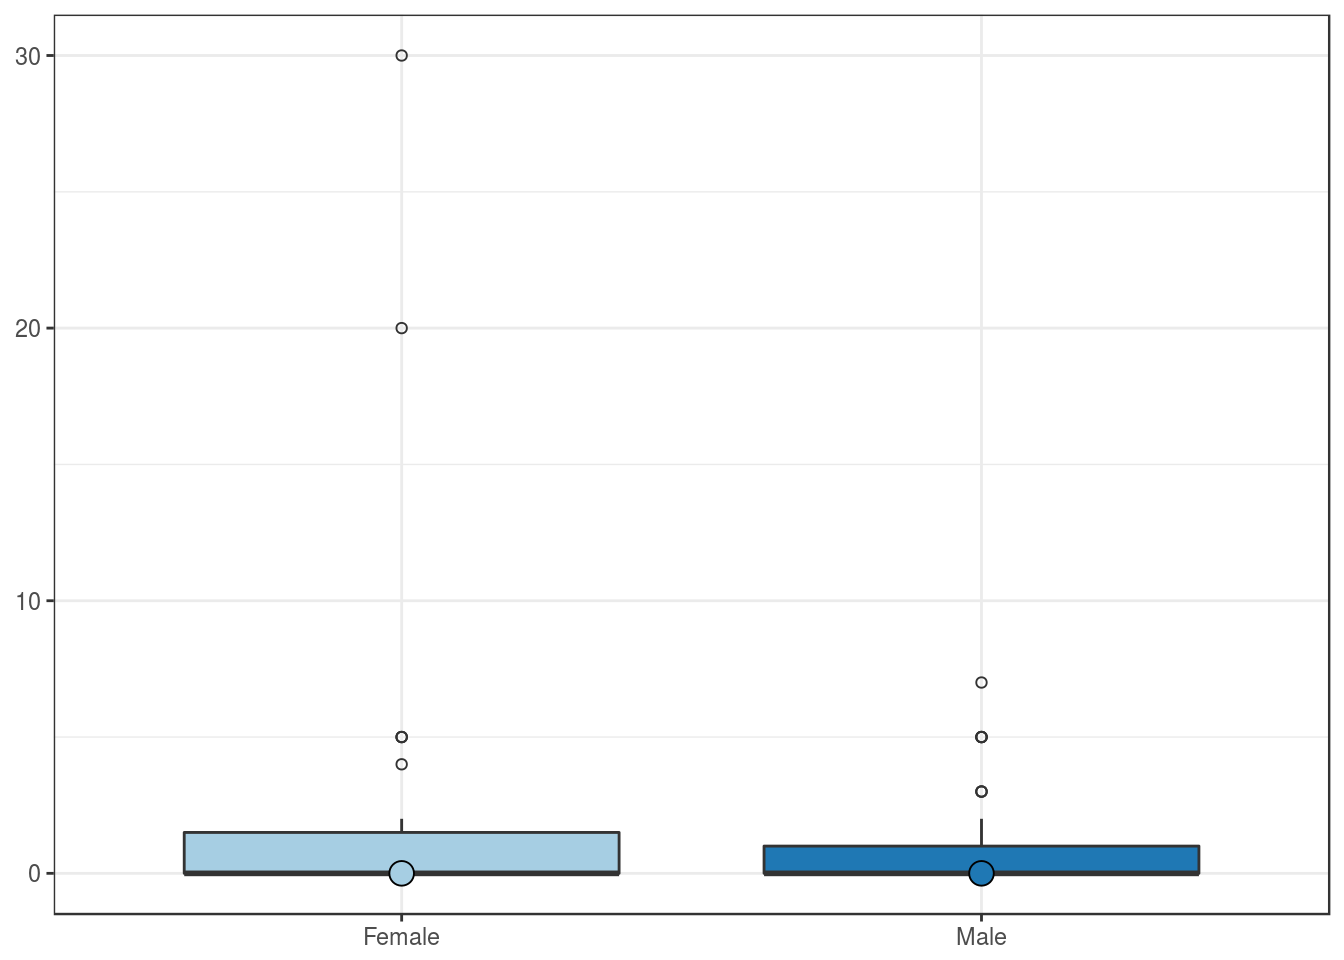
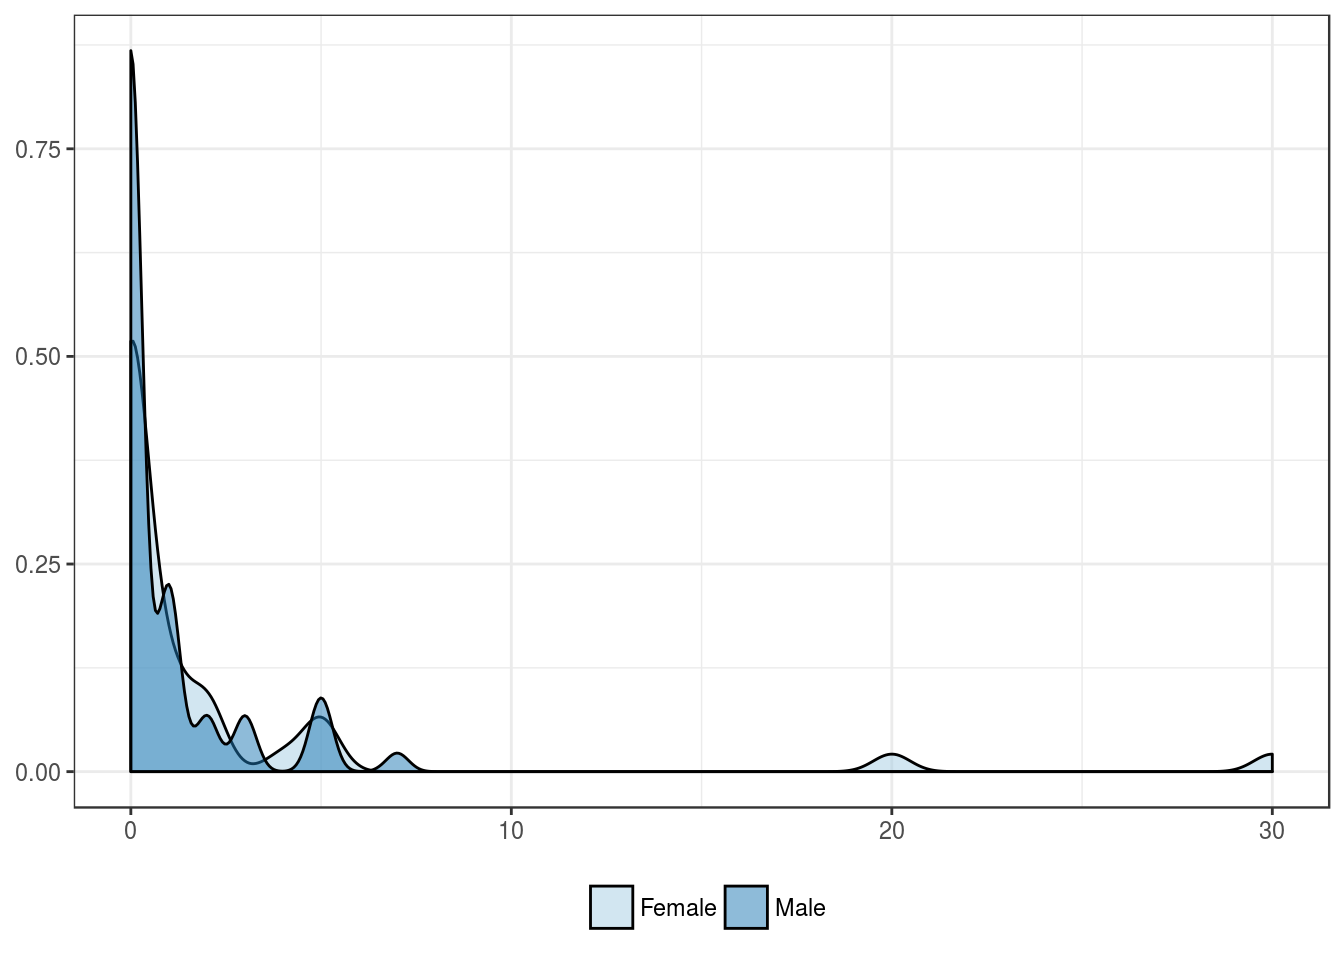
Expression by patient’s sex
| Female | Male | |
|---|---|---|
| Mean | 2.1 | 0.9 |
| Standard deviation | 5.7 | 1.6 |
| Median | 0.0 | 0.0 |
| Interquartile range | 1.5 | 1.0 |
| Minimum | 0.0 | 0.0 |
| Maximum | 30.0 | 7.0 |
| Value | |
|---|---|
| U-statistic | 1236 |
| P statistic | 5.9e-01 |
Pathologic features
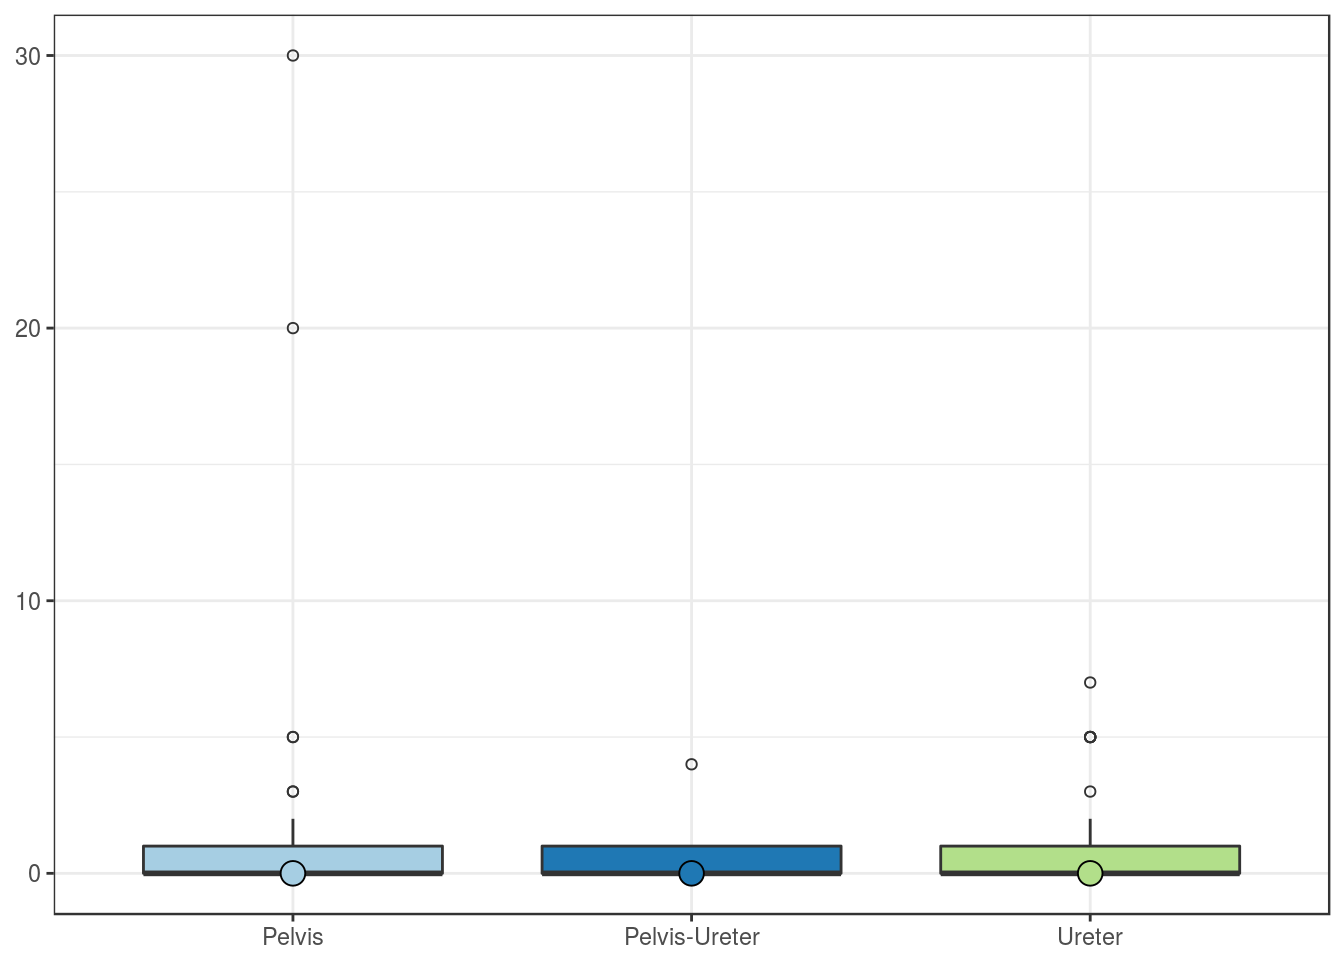
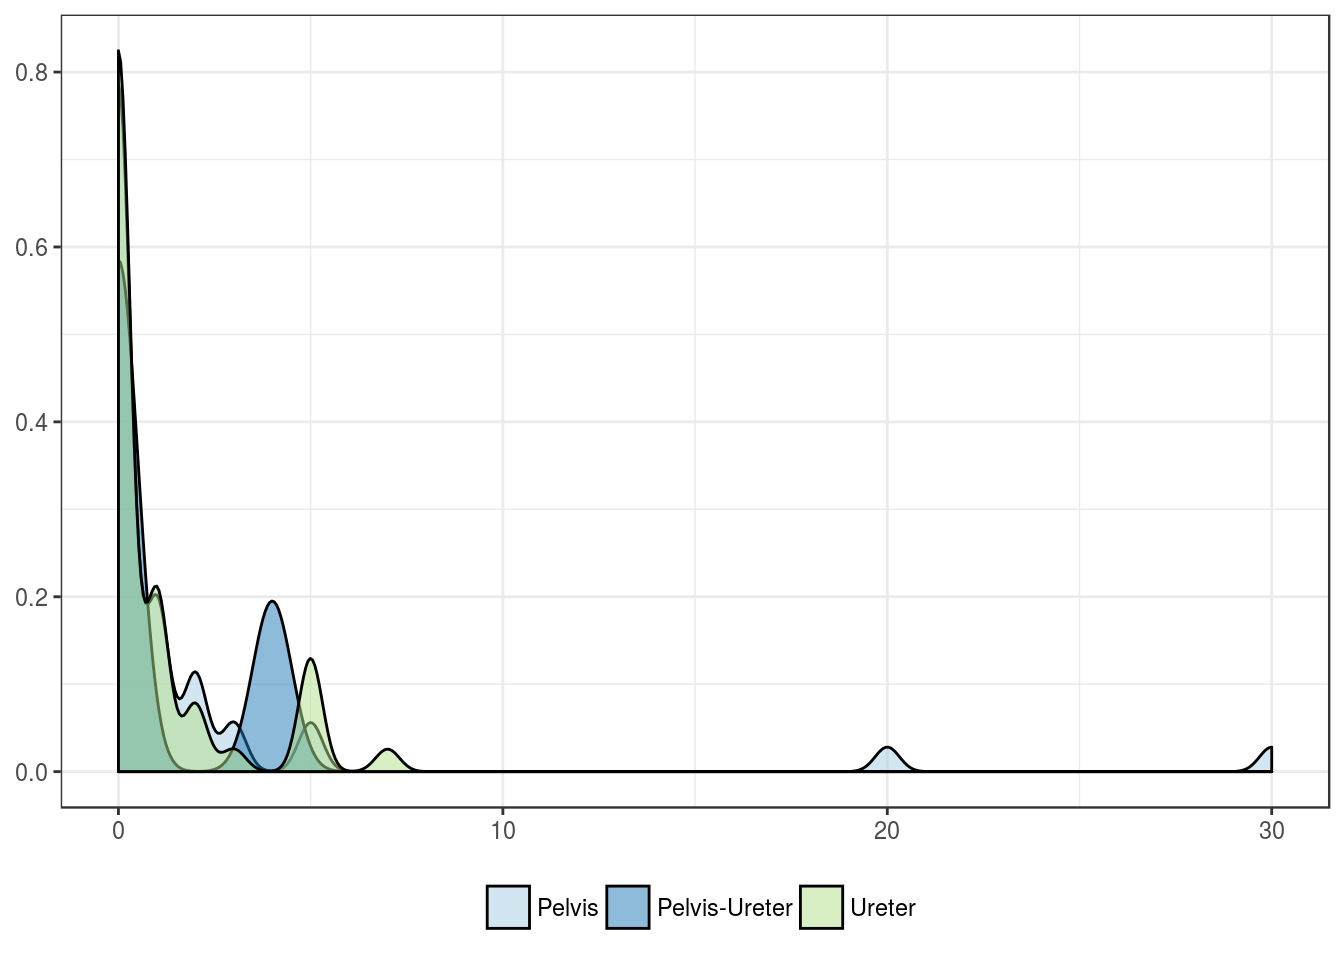
Expression by tumor location
| Pelvis | Pelvis-Ureter | Ureter | |
|---|---|---|---|
| Mean | 1.8 | 1 | 1.0 |
| Standard deviation | 5.3 | 2 | 1.8 |
| Median | 0.0 | 0 | 0.0 |
| Interquartile range | 1.0 | 1 | 1.0 |
| Minimum | 0.0 | 0 | 0.0 |
| Maximum | 30.0 | 4 | 7.0 |
| Value | |
|---|---|
| Statistic | 0.1265 |
| Parameter | 2 |
| P statistic | 0.94 |
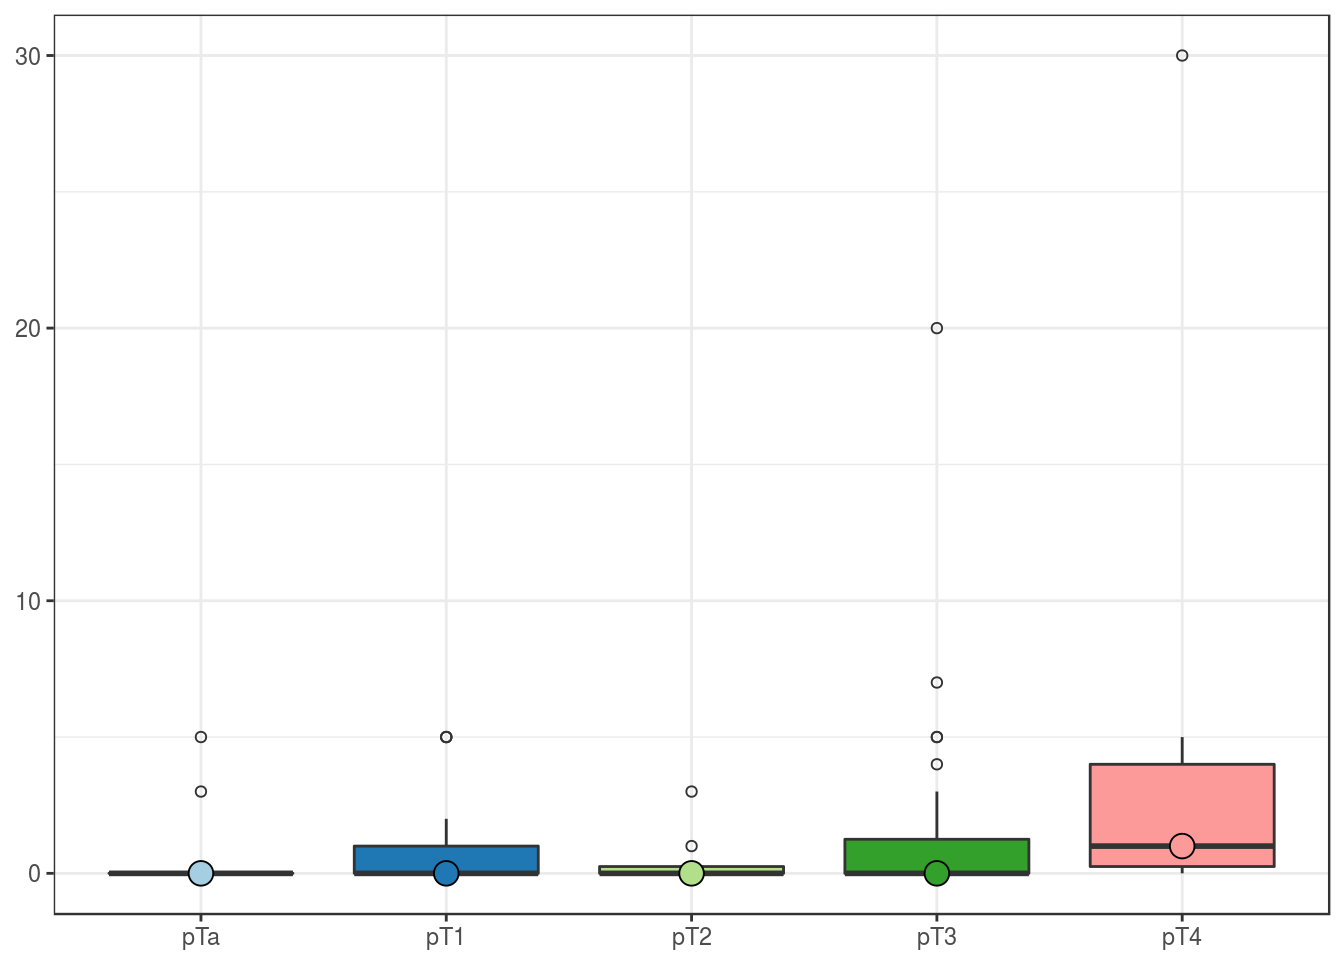
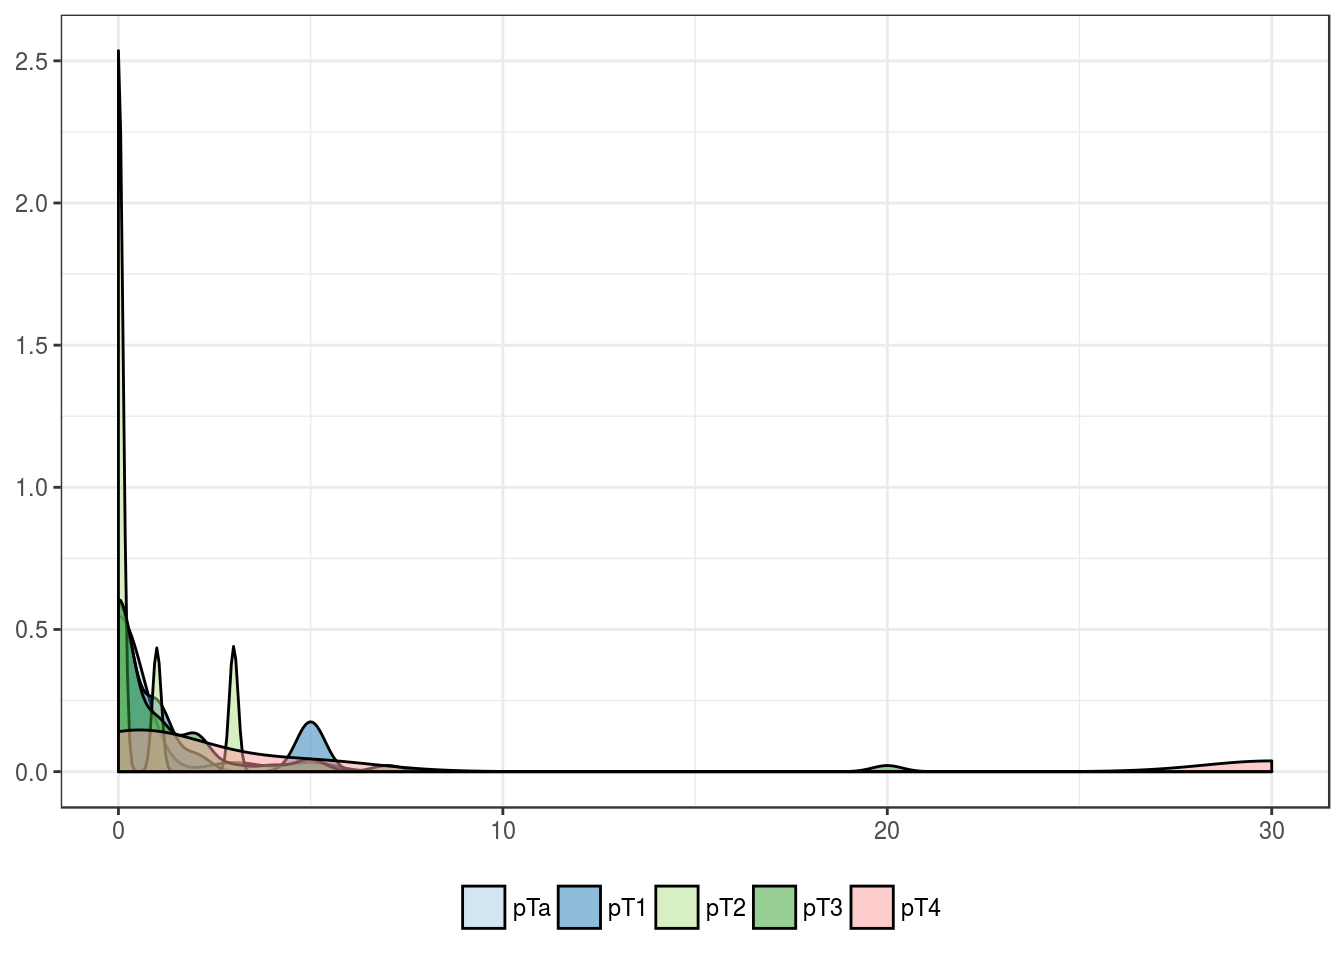
Expression by pT
| pTa | pT1 | pT2 | pT3 | pT4 | |
|---|---|---|---|---|---|
| Mean | 0.4 | 1.2 | 0.5 | 1.3 | 6.2 |
| Standard deviation | 1.3 | 1.9 | 1.1 | 3.2 | 11.8 |
| Median | 0.0 | 0.0 | 0.0 | 0.0 | 1.0 |
| Interquartile range | 0.0 | 1.0 | 0.2 | 1.2 | 3.8 |
| Minimum | 0.0 | 0.0 | 0.0 | 0.0 | 0.0 |
| Maximum | 5.0 | 5.0 | 3.0 | 20.0 | 30.0 |
| Value | |
|---|---|
| Statistic | 8.378 |
| Parameter | 4 |
| P statistic | 0.079 |
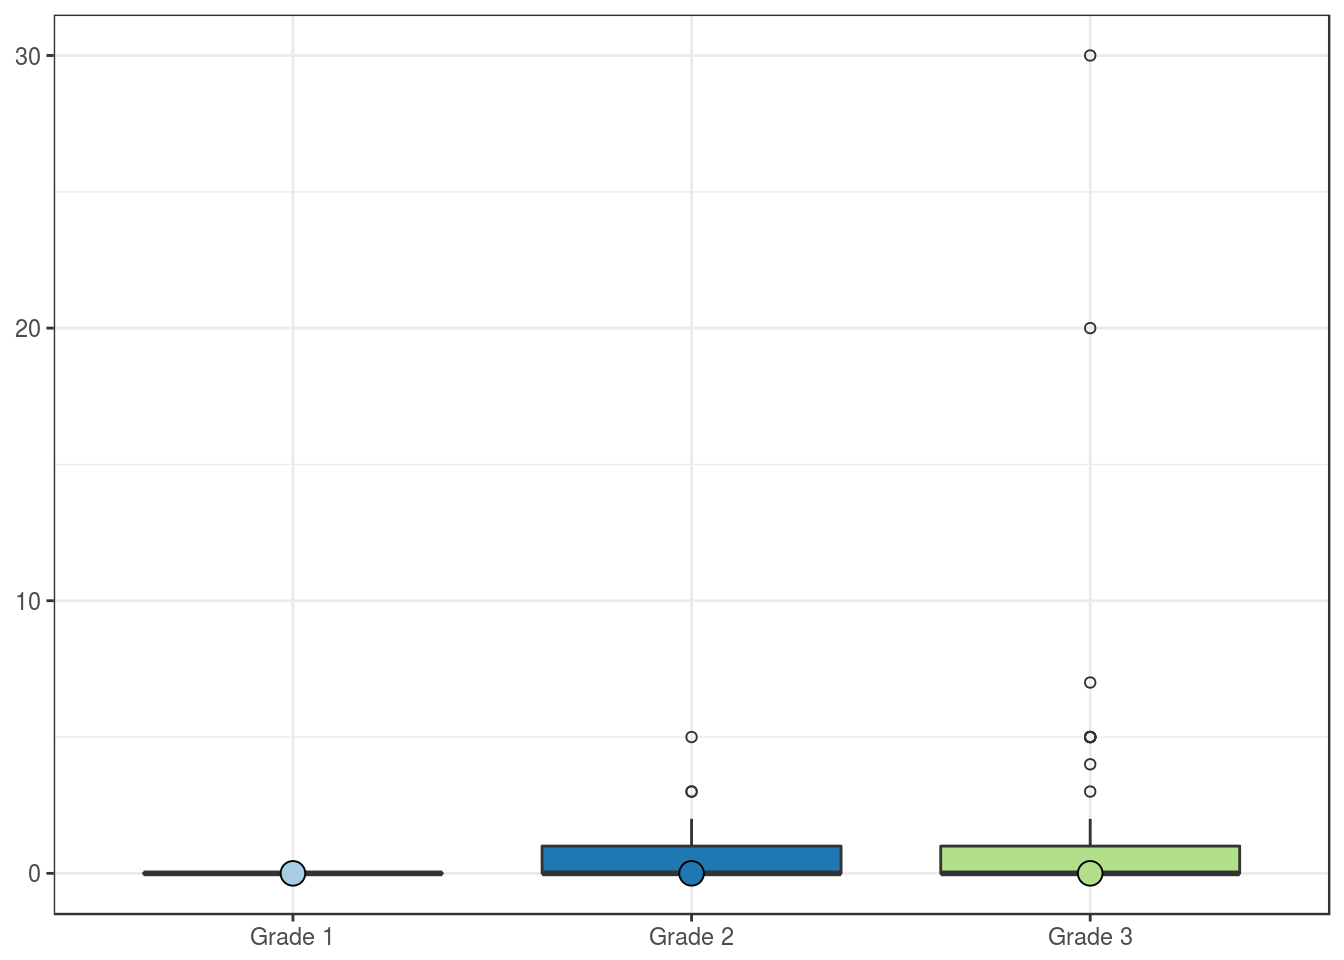
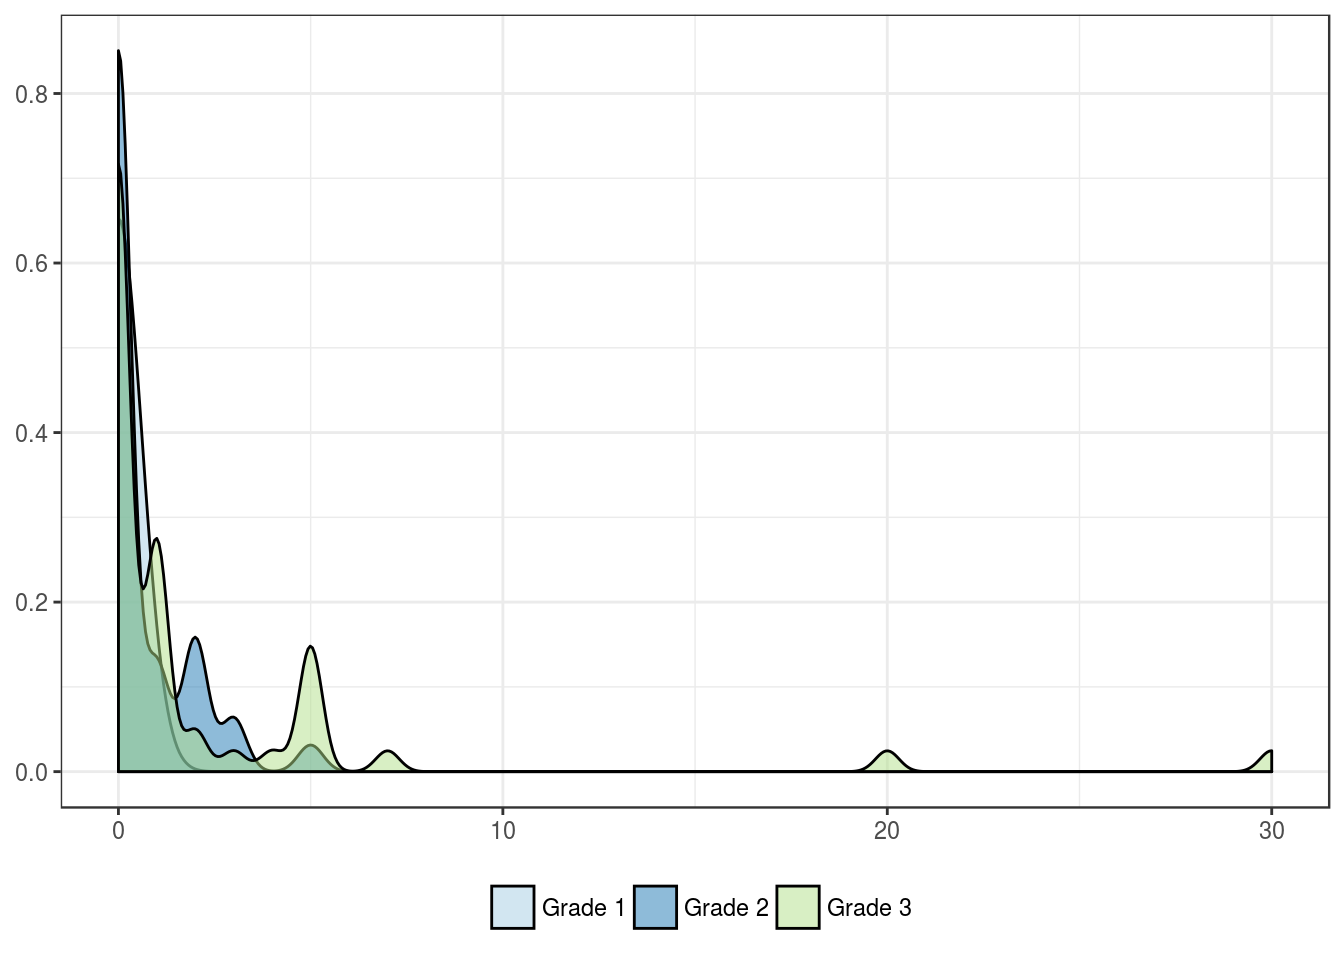
Expression by histologic grade
| Grade 1 | Grade 2 | Grade 3 | |
|---|---|---|---|
| Mean | 0 | 0.6 | 2.1 |
| Standard deviation | 0 | 1.2 | 5.0 |
| Median | 0 | 0.0 | 0.0 |
| Interquartile range | 0 | 1.0 | 1.0 |
| Minimum | 0 | 0.0 | 0.0 |
| Maximum | 0 | 5.0 | 30.0 |
| Value | |
|---|---|
| Statistic | 6.334 |
| Parameter | 2 |
| P statistic | 0.042 |
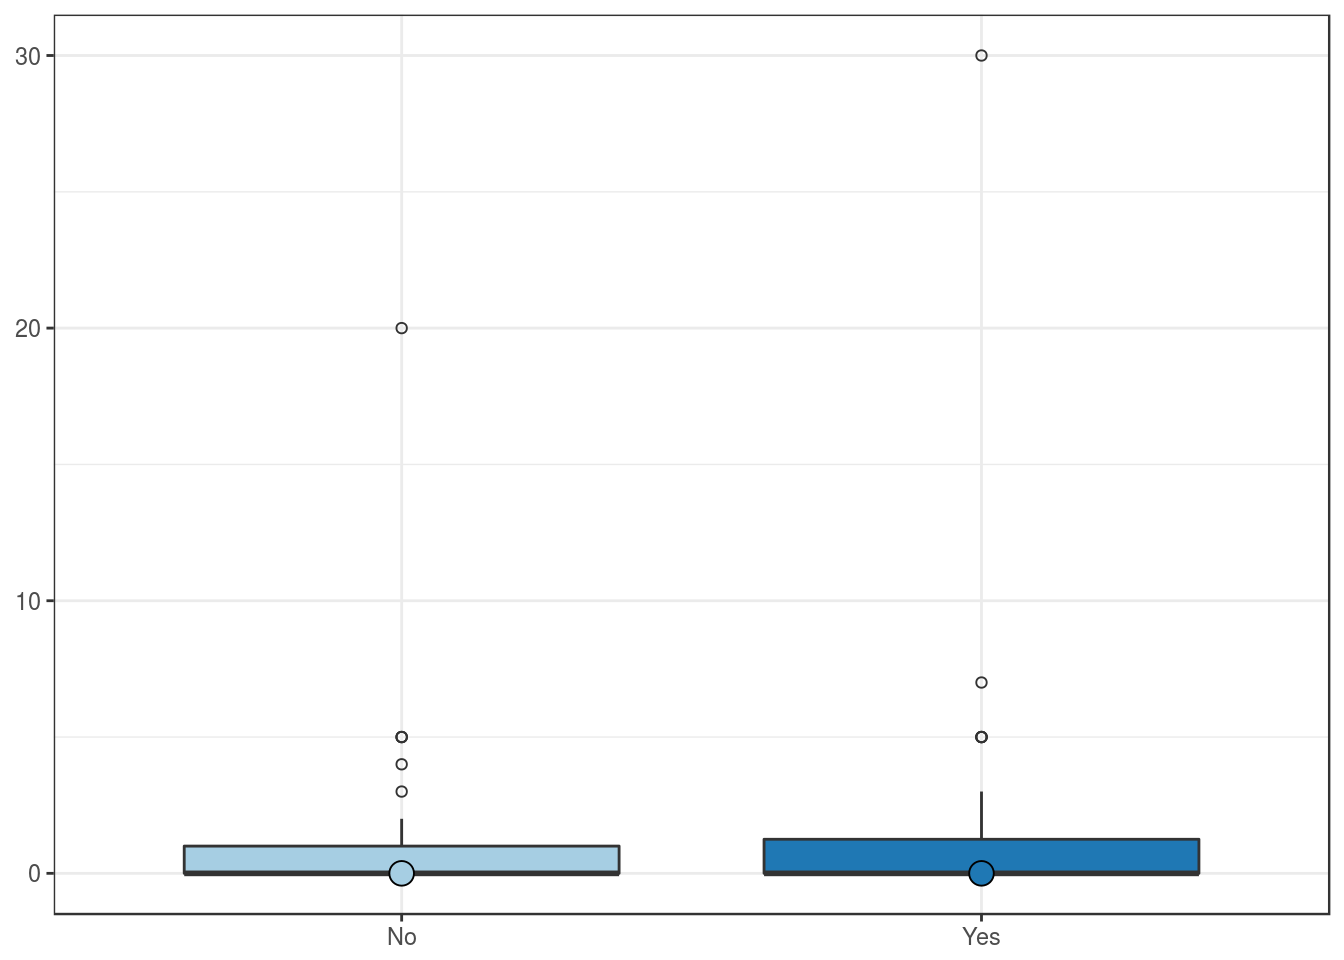
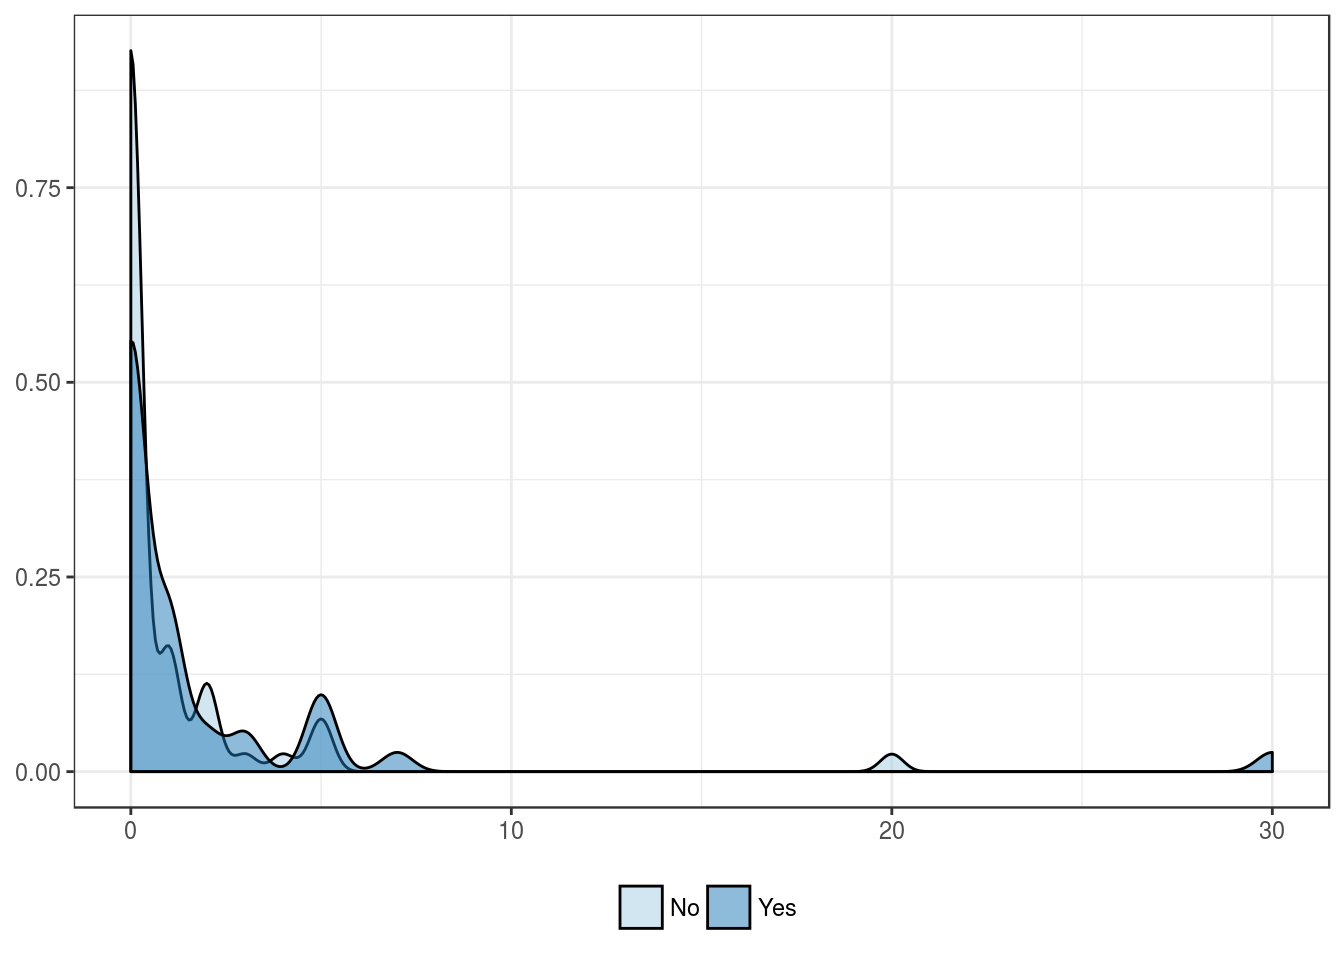
Expression by lymphovascular invasion
| No | Yes | |
|---|---|---|
| Mean | 1.0 | 1.9 |
| Standard deviation | 2.8 | 4.9 |
| Median | 0.0 | 0.0 |
| Interquartile range | 1.0 | 1.2 |
| Minimum | 0.0 | 0.0 |
| Maximum | 20.0 | 30.0 |
| Value | |
|---|---|
| U-statistic | 1002 |
| P statistic | 1.4e-01 |
Expression by lymph node metastasis
| No | Yes | |
|---|---|---|
| Mean | 1.5 | 0.3 |
| Standard deviation | 4.1 | 0.5 |
| Median | 0.0 | 0.0 |
| Interquartile range | 1.0 | 1.0 |
| Minimum | 0.0 | 0.0 |
| Maximum | 30.0 | 1.0 |
| Value | |
|---|---|
| U-statistic | 562 |
| P statistic | 4.6e-01 |
Outcome features
Expression by bladder recurrence
| No | Yes | |
|---|---|---|
| Mean | 1.4 | 1.4 |
| Standard deviation | 4.0 | 3.7 |
| Median | 0.0 | 0.0 |
| Interquartile range | 1.0 | 1.0 |
| Minimum | 0.0 | 0.0 |
| Maximum | 30.0 | 20.0 |
| Value | |
|---|---|
| U-statistic | 1026 |
| P statistic | 9e-01 |
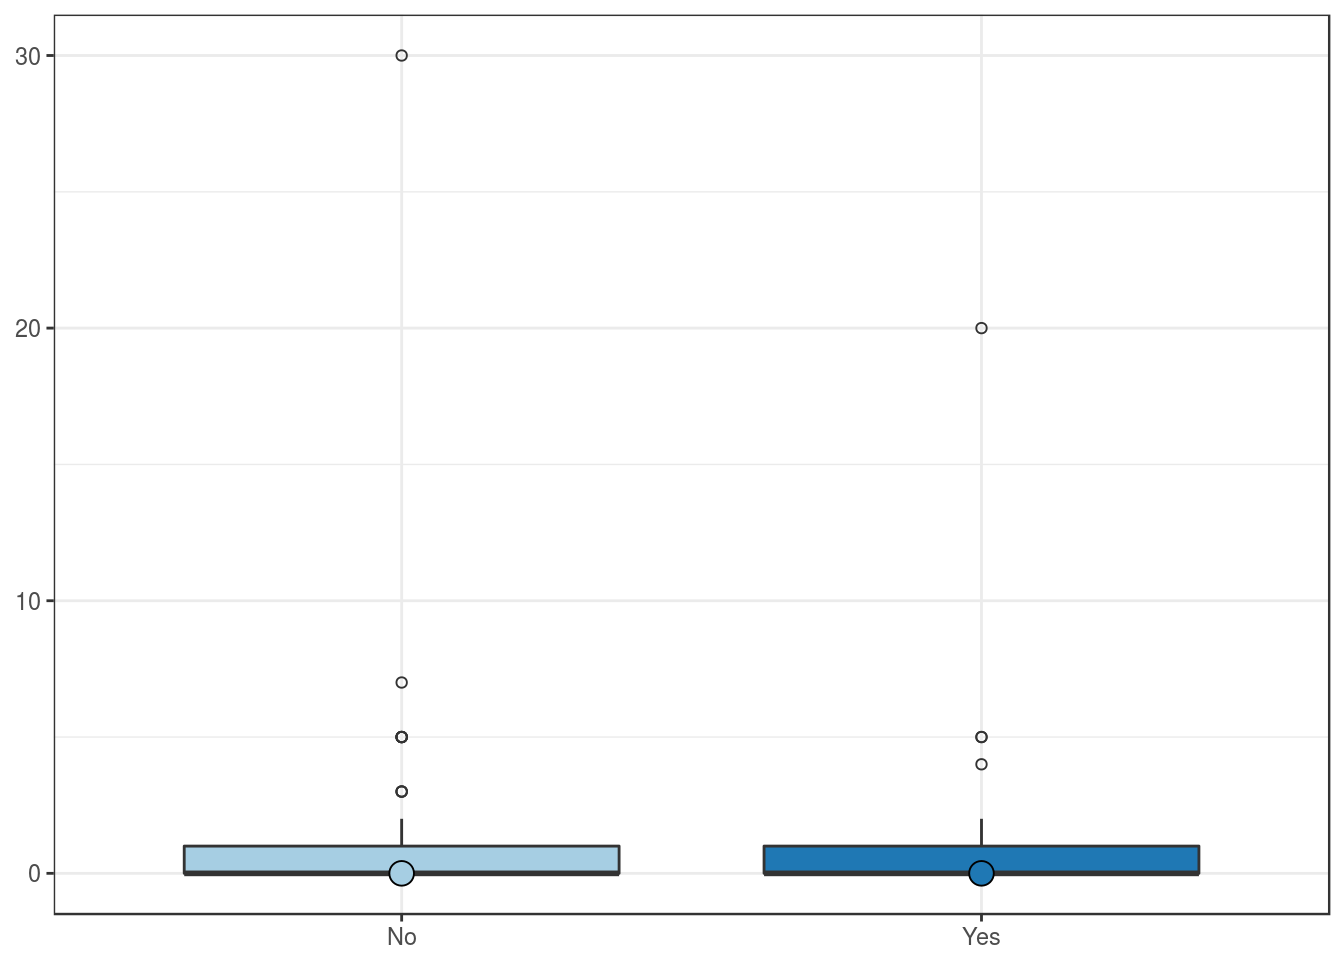
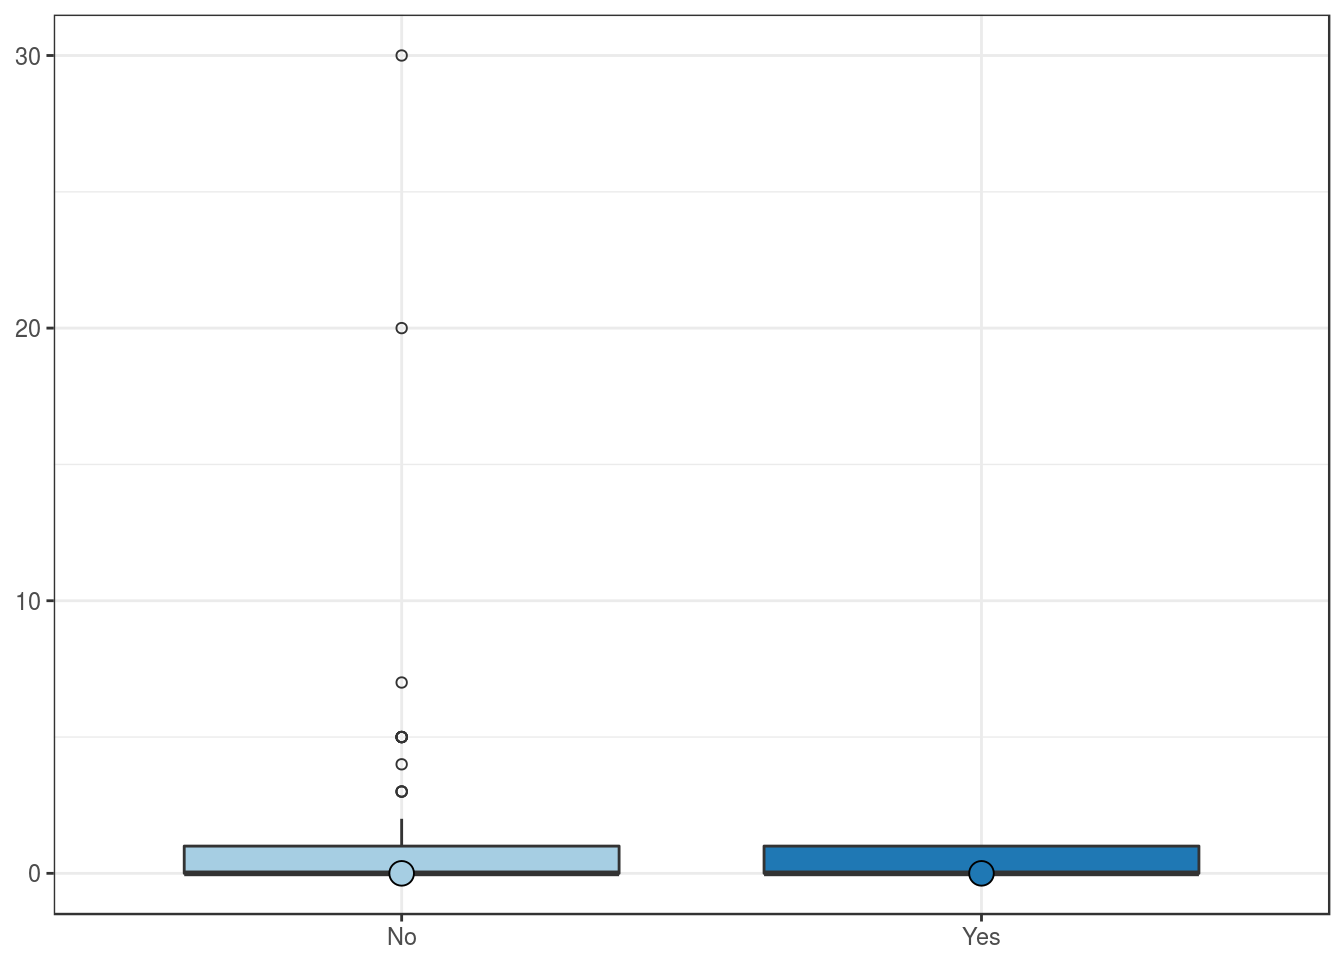
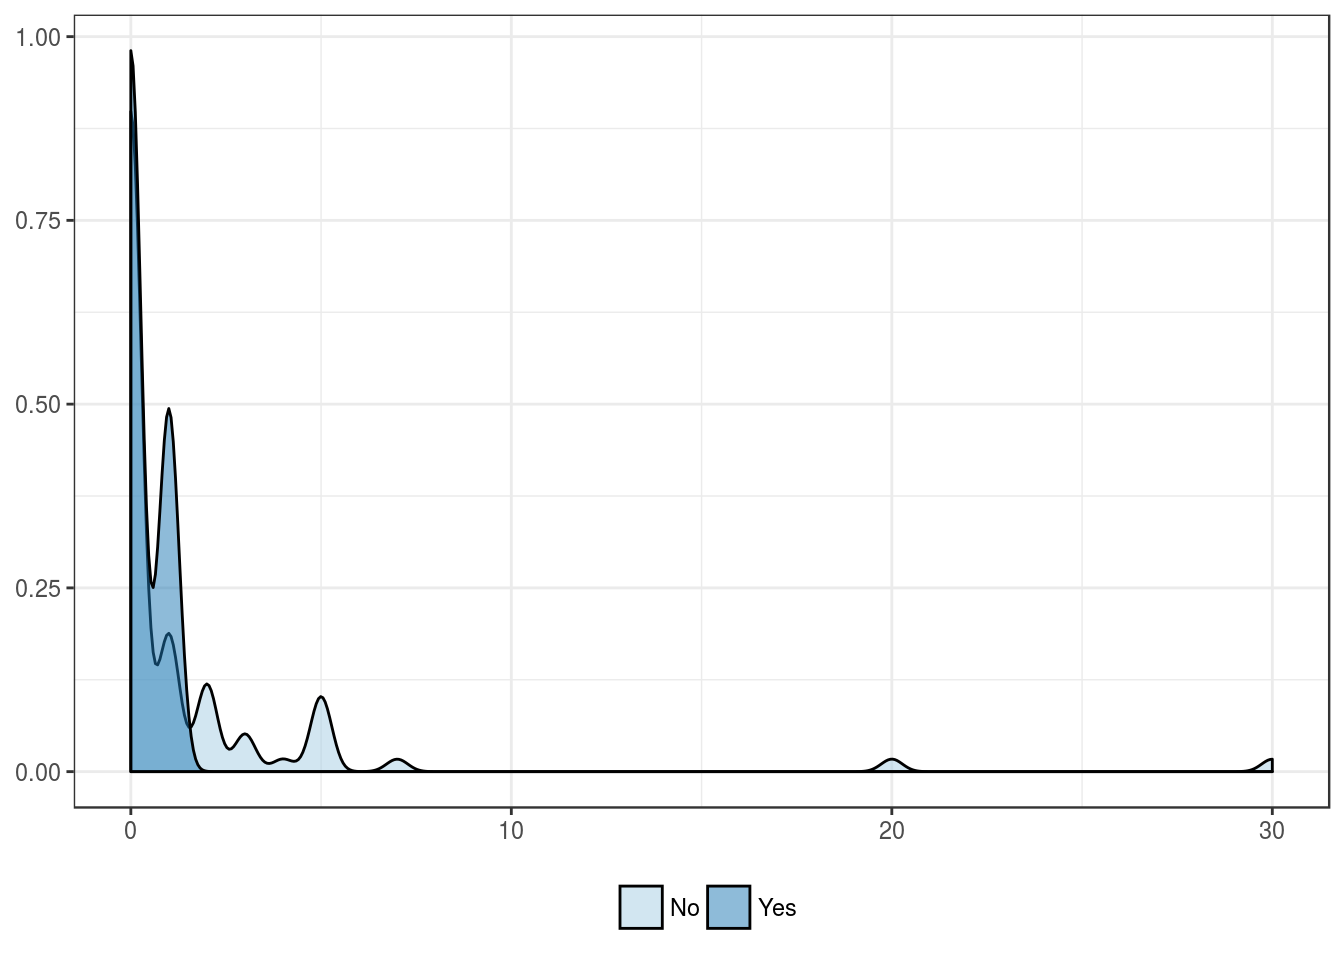
Expression by tumor progression
| No | Yes | |
|---|---|---|
| Mean | 0.9 | 1.8 |
| Standard deviation | 1.7 | 5.1 |
| Median | 0.0 | 0.0 |
| Interquartile range | 1.0 | 1.0 |
| Minimum | 0.0 | 0.0 |
| Maximum | 7.0 | 30.0 |
| Value | |
|---|---|
| U-statistic | 806 |
| P statistic | 7.8e-01 |
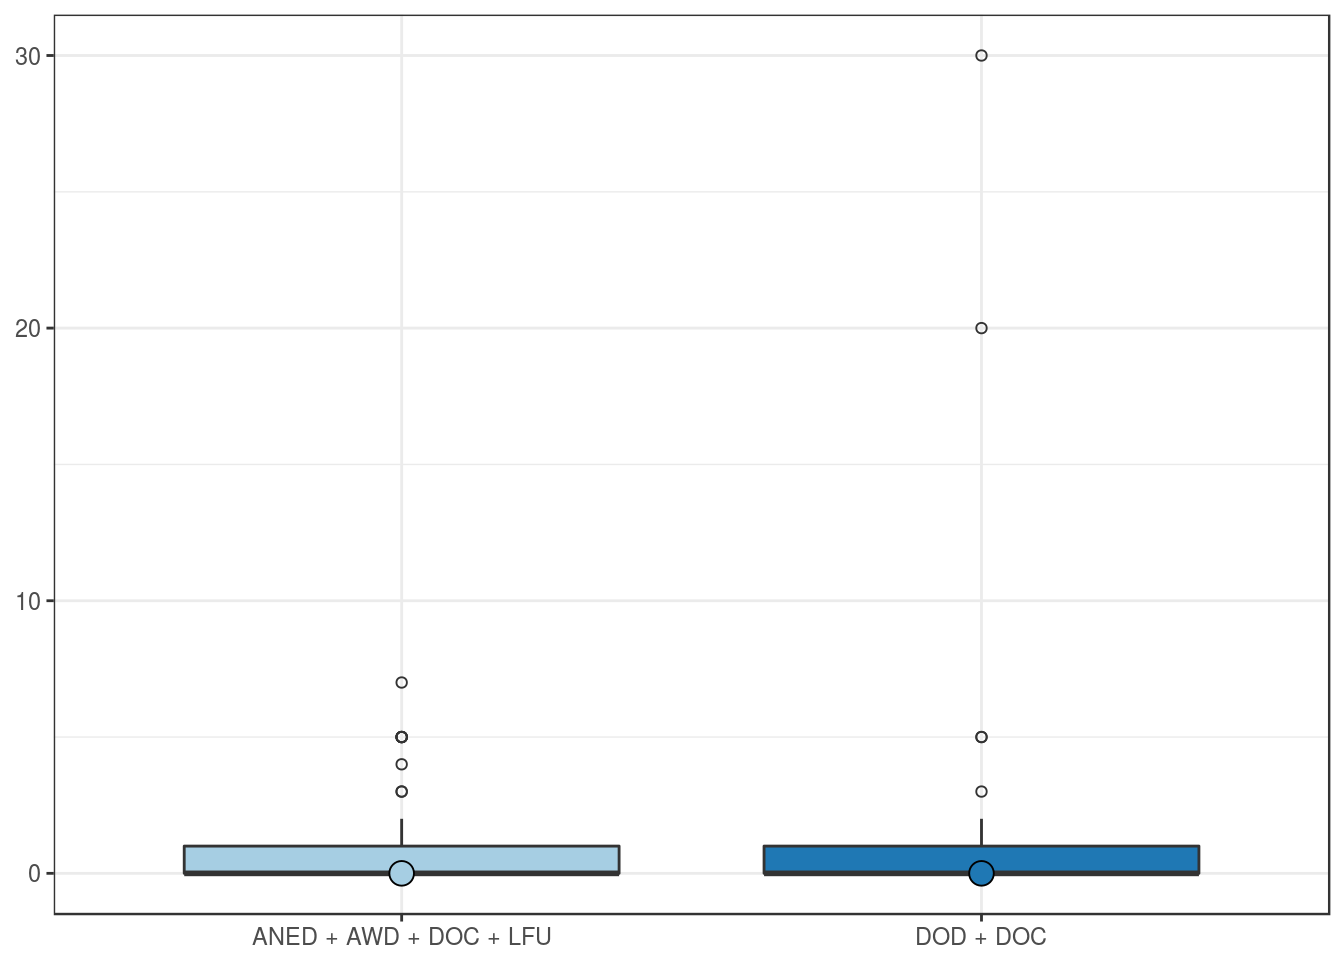
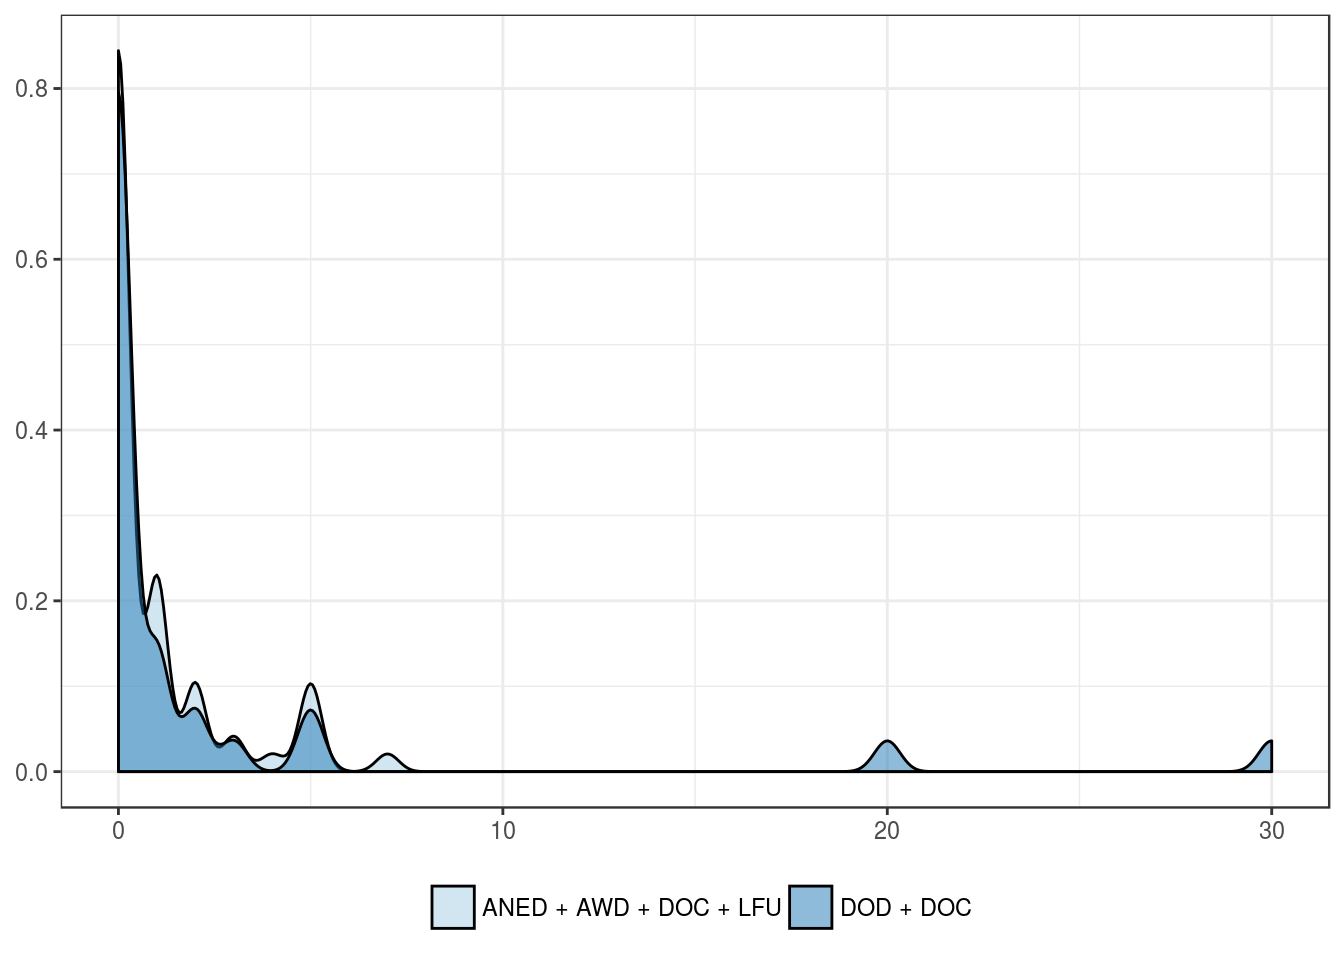
Expression by overall mortality
| ANED + AWD + DOC + LFU | DOD + DOC | |
|---|---|---|
| Mean | 1.0 | 2.2 |
| Standard deviation | 1.7 | 6.2 |
| Median | 0.0 | 0.0 |
| Interquartile range | 1.0 | 1.0 |
| Minimum | 0.0 | 0.0 |
| Maximum | 7.0 | 30.0 |
| Value | |
|---|---|
| U-statistic | 1117 |
| P statistic | 8.1e-01 |
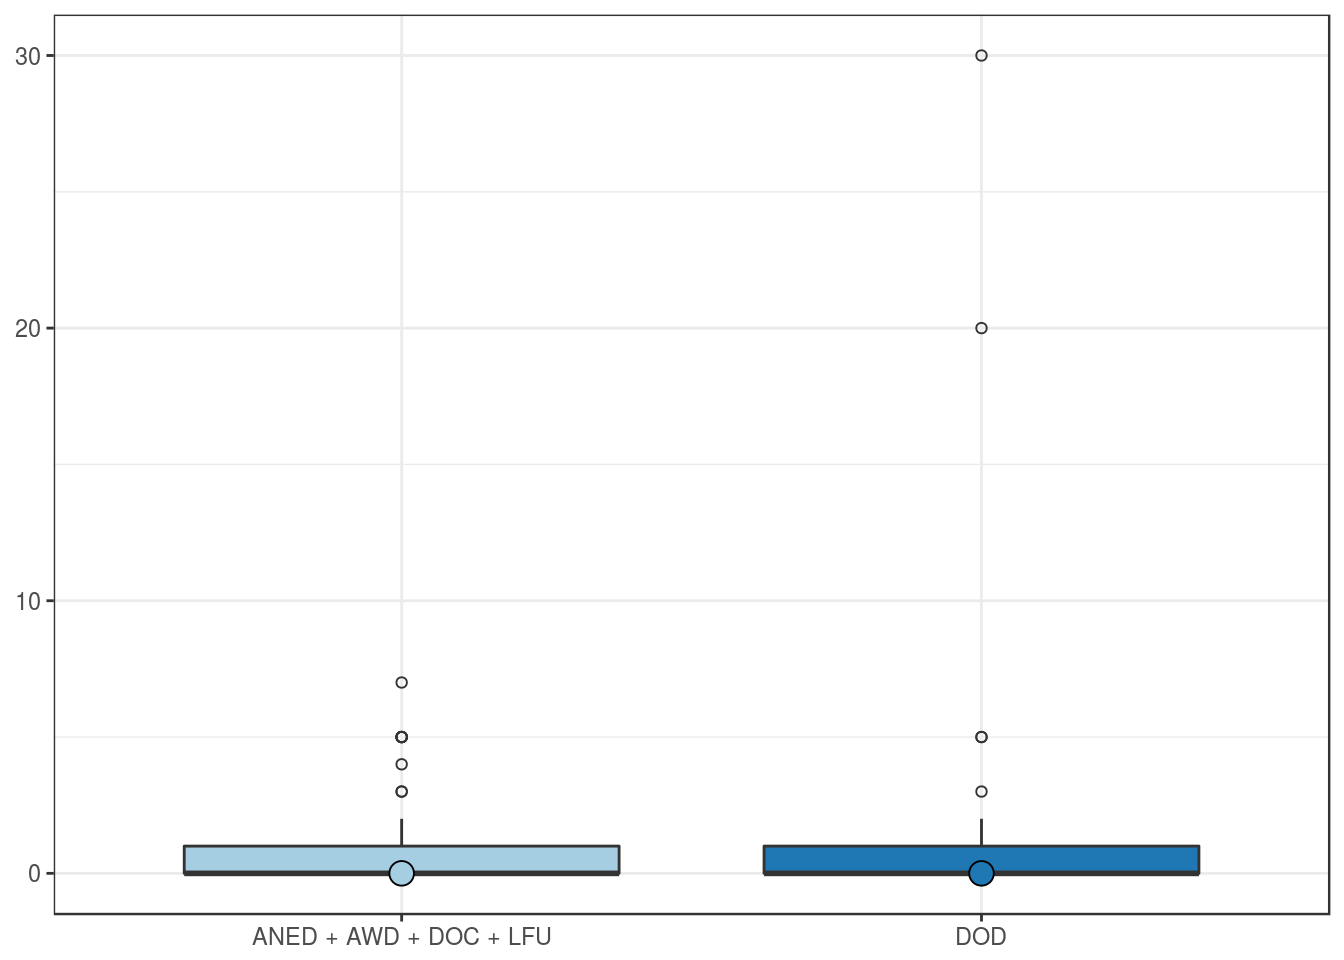
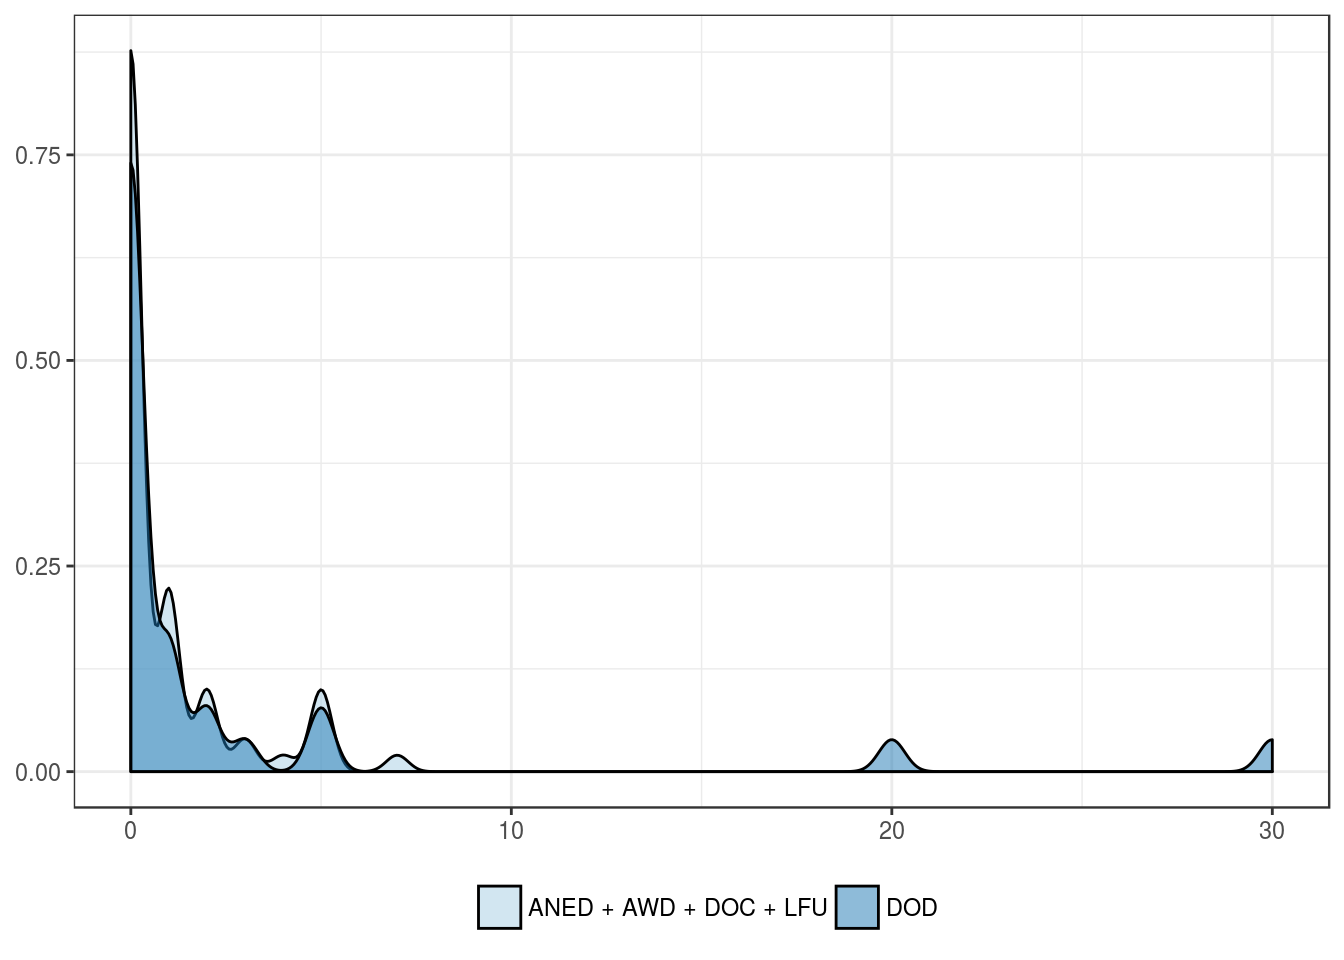
Expression by cancer-related mortality
| ANED + AWD + DOC + LFU | DOD | |
|---|---|---|
| Mean | 0.9 | 2.4 |
| Standard deviation | 1.6 | 6.4 |
| Median | 0.0 | 0.0 |
| Interquartile range | 1.0 | 1.0 |
| Minimum | 0.0 | 0.0 |
| Maximum | 7.0 | 30.0 |
| Value | |
|---|---|
| U-statistic | 1009 |
| P statistic | 8.2e-01 |