FOXP3 positivity in stromal lymphocytes
Clinical features
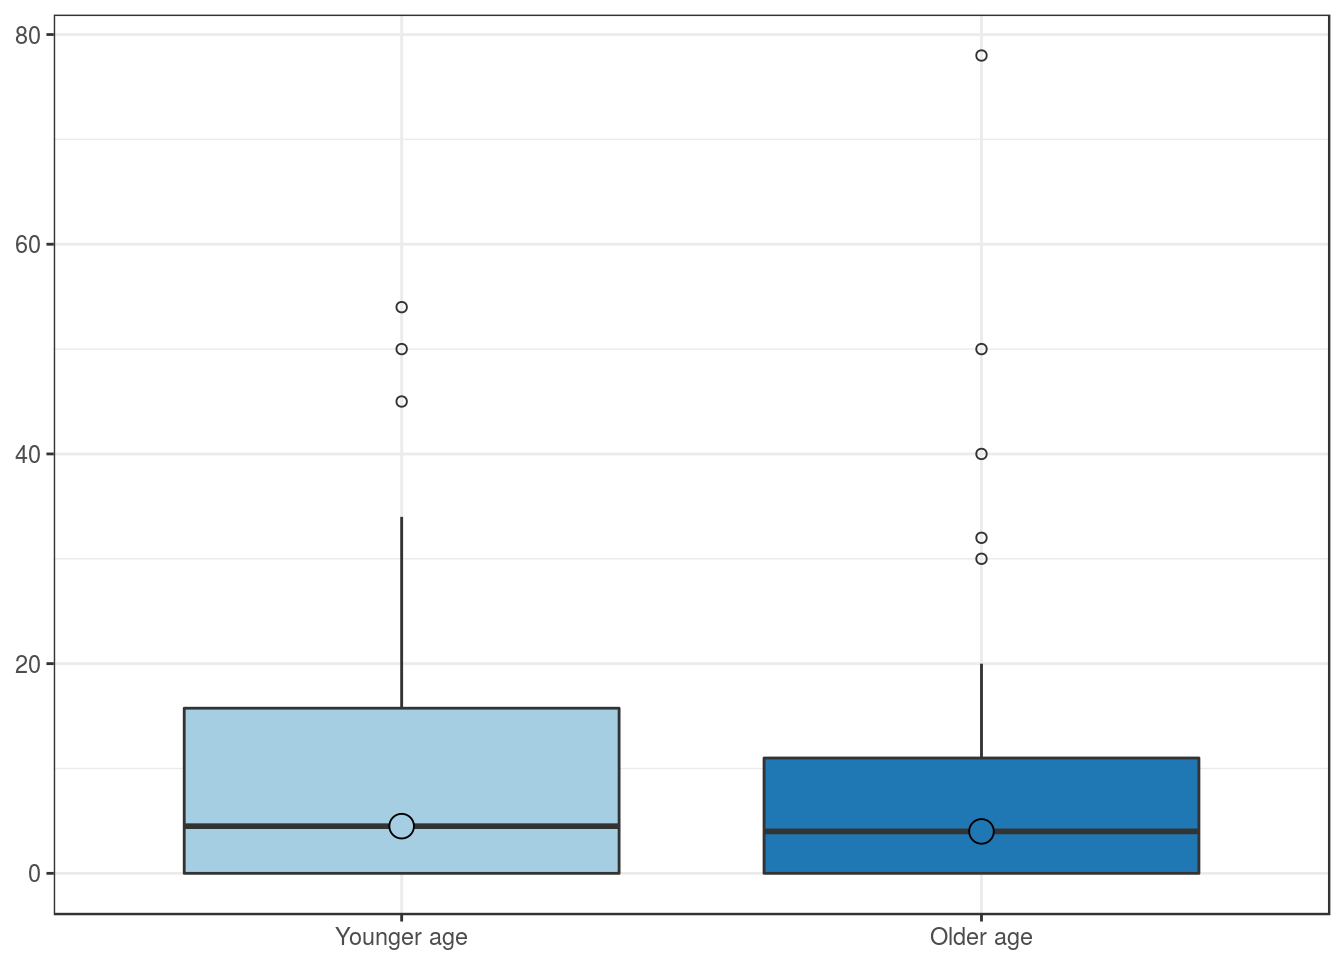
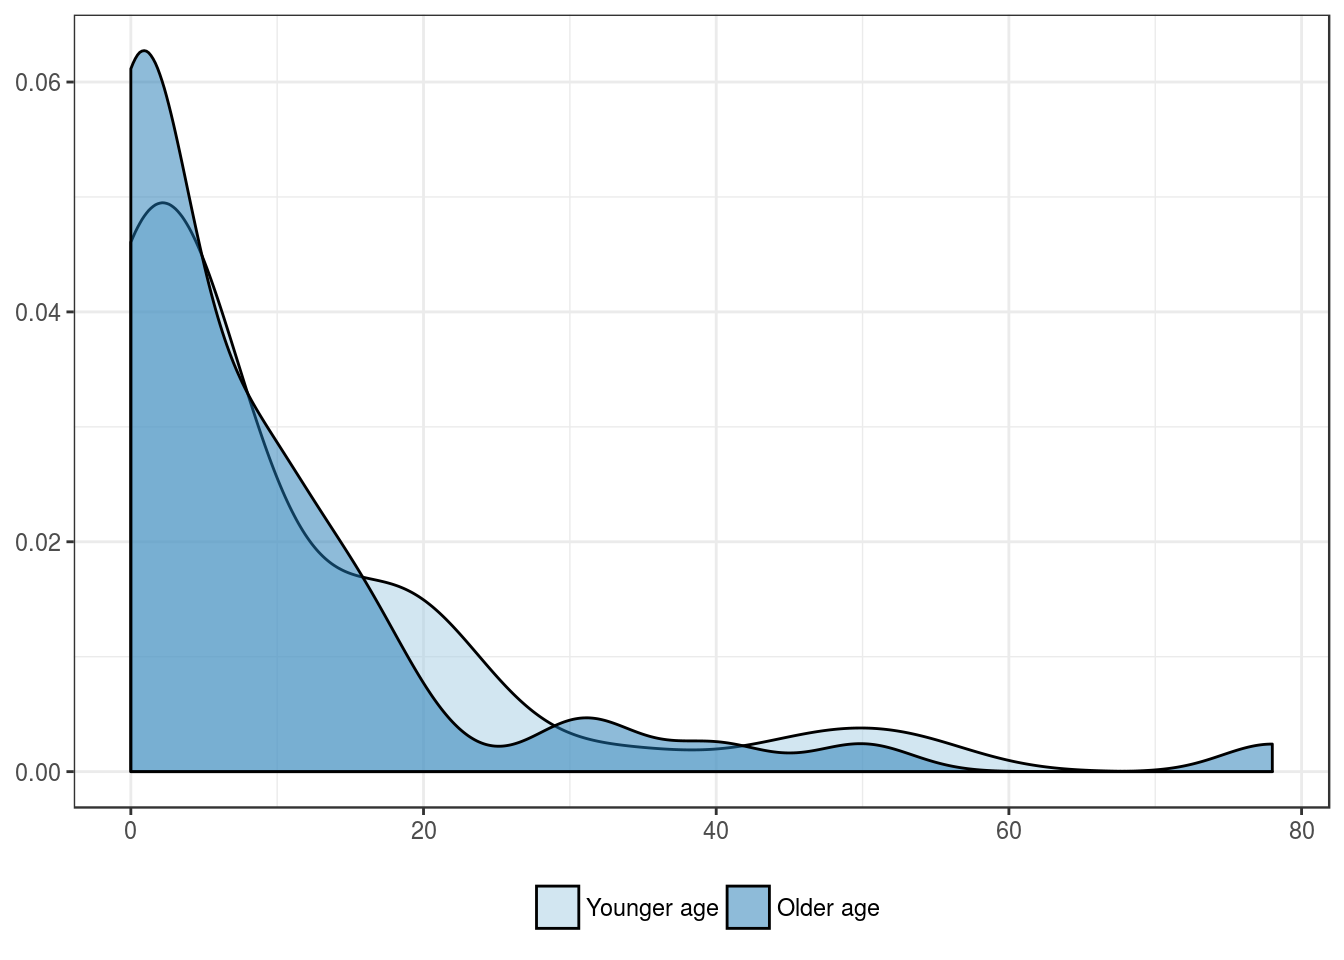
Expression by patient’s age group
| Younger age | Older age | |
|---|---|---|
| Mean | 9.5 | 9.1 |
| Standard deviation | 13.2 | 14.9 |
| Median | 4.5 | 4.0 |
| Interquartile range | 15.8 | 11.0 |
| Minimum | 0.0 | 0.0 |
| Maximum | 54.0 | 78.0 |
| Value | |
|---|---|
| U-statistic | 1300 |
| P statistic | 5.9e-01 |
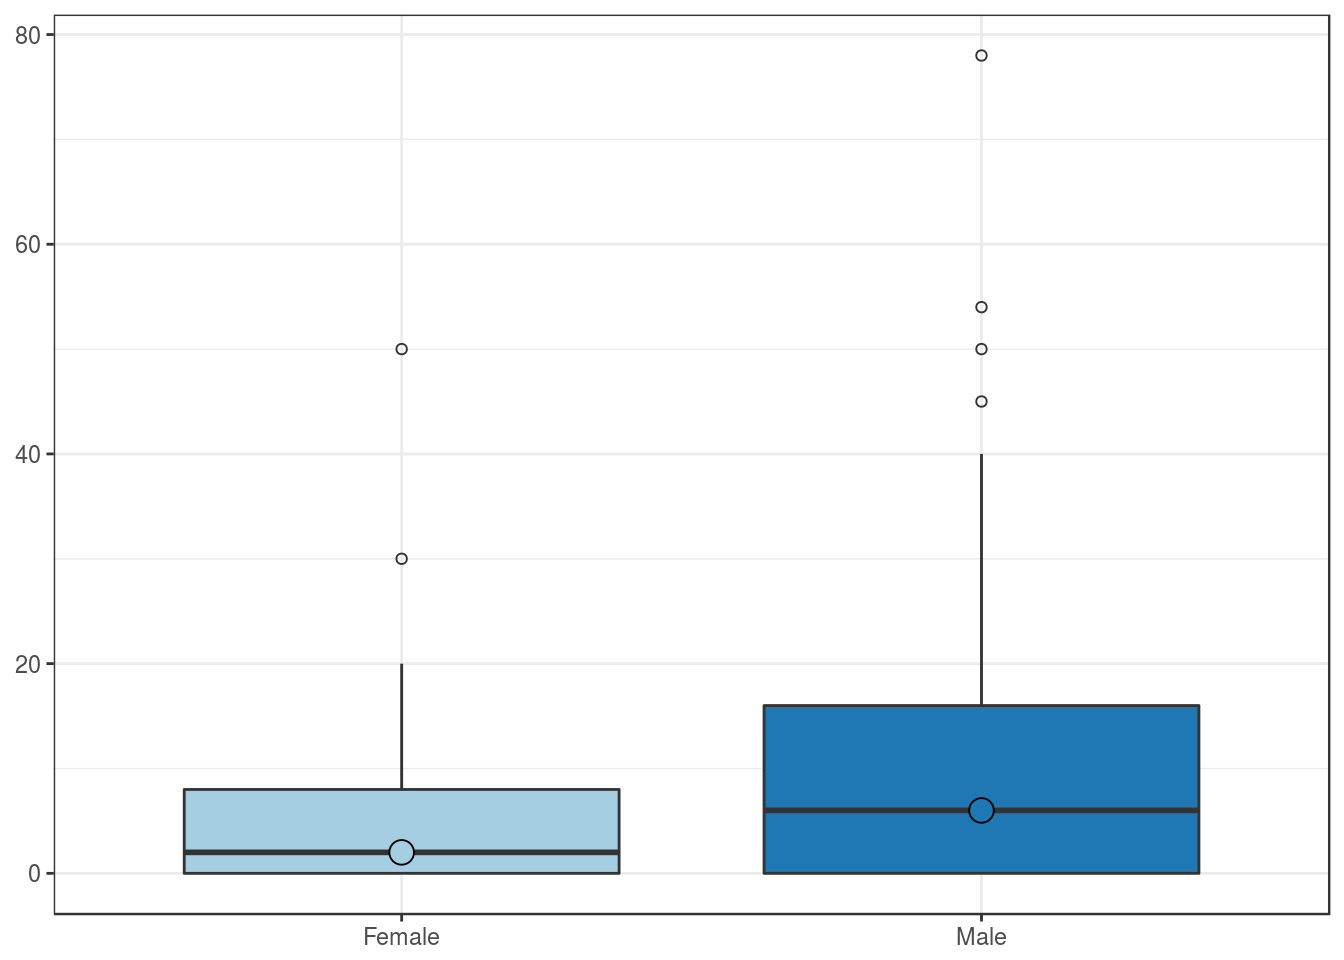
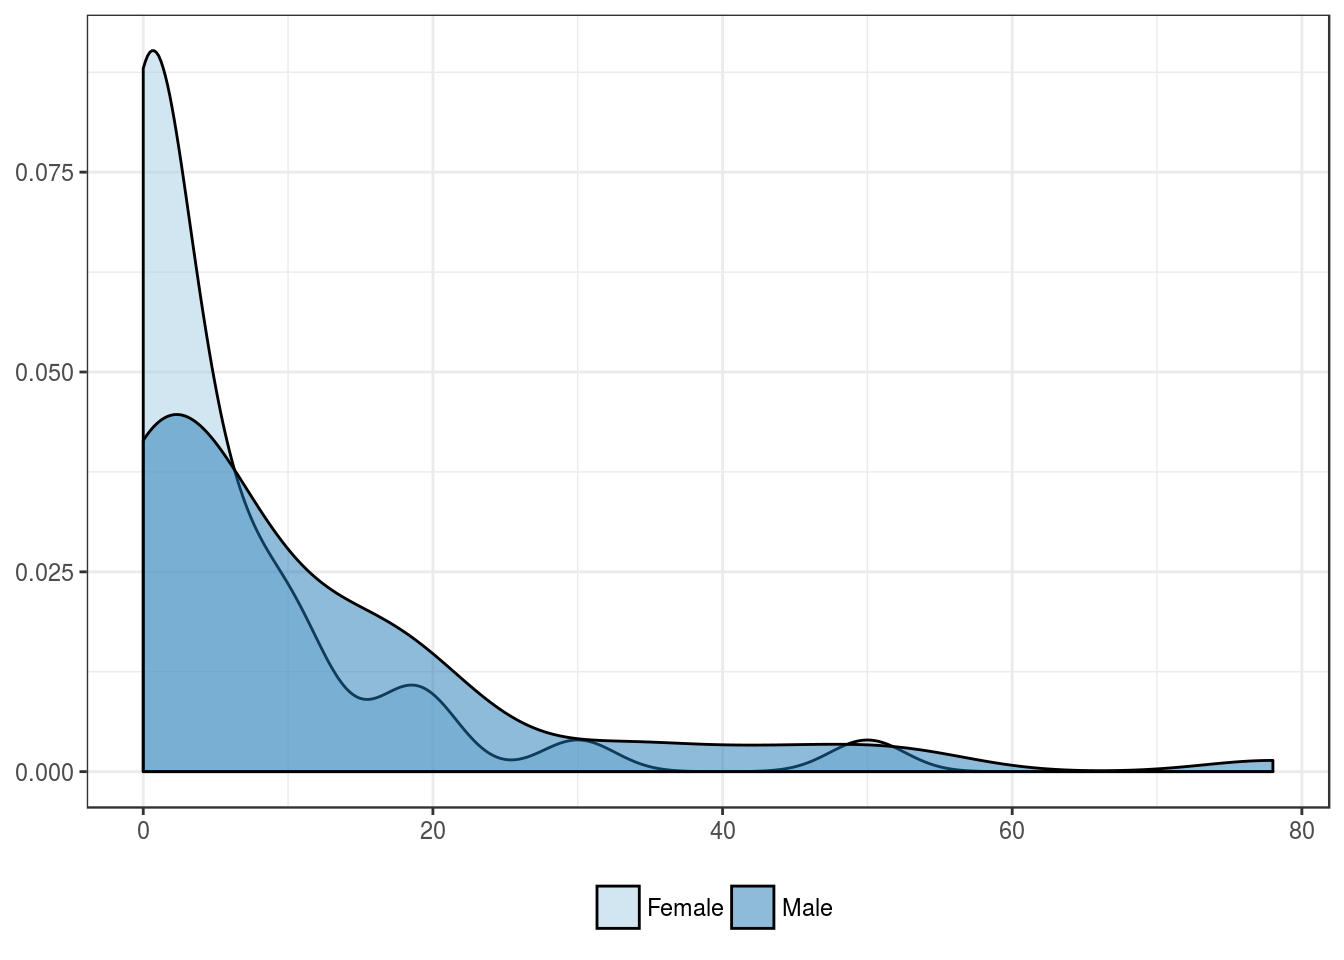
Expression by patient’s sex
| Female | Male | |
|---|---|---|
| Mean | 5.9 | 11.4 |
| Standard deviation | 10.0 | 15.7 |
| Median | 2.0 | 6.0 |
| Interquartile range | 8.0 | 16.0 |
| Minimum | 0.0 | 0.0 |
| Maximum | 50.0 | 78.0 |
| Value | |
|---|---|
| U-statistic | 896 |
| P statistic | 4.5e-02 |
Pathologic features
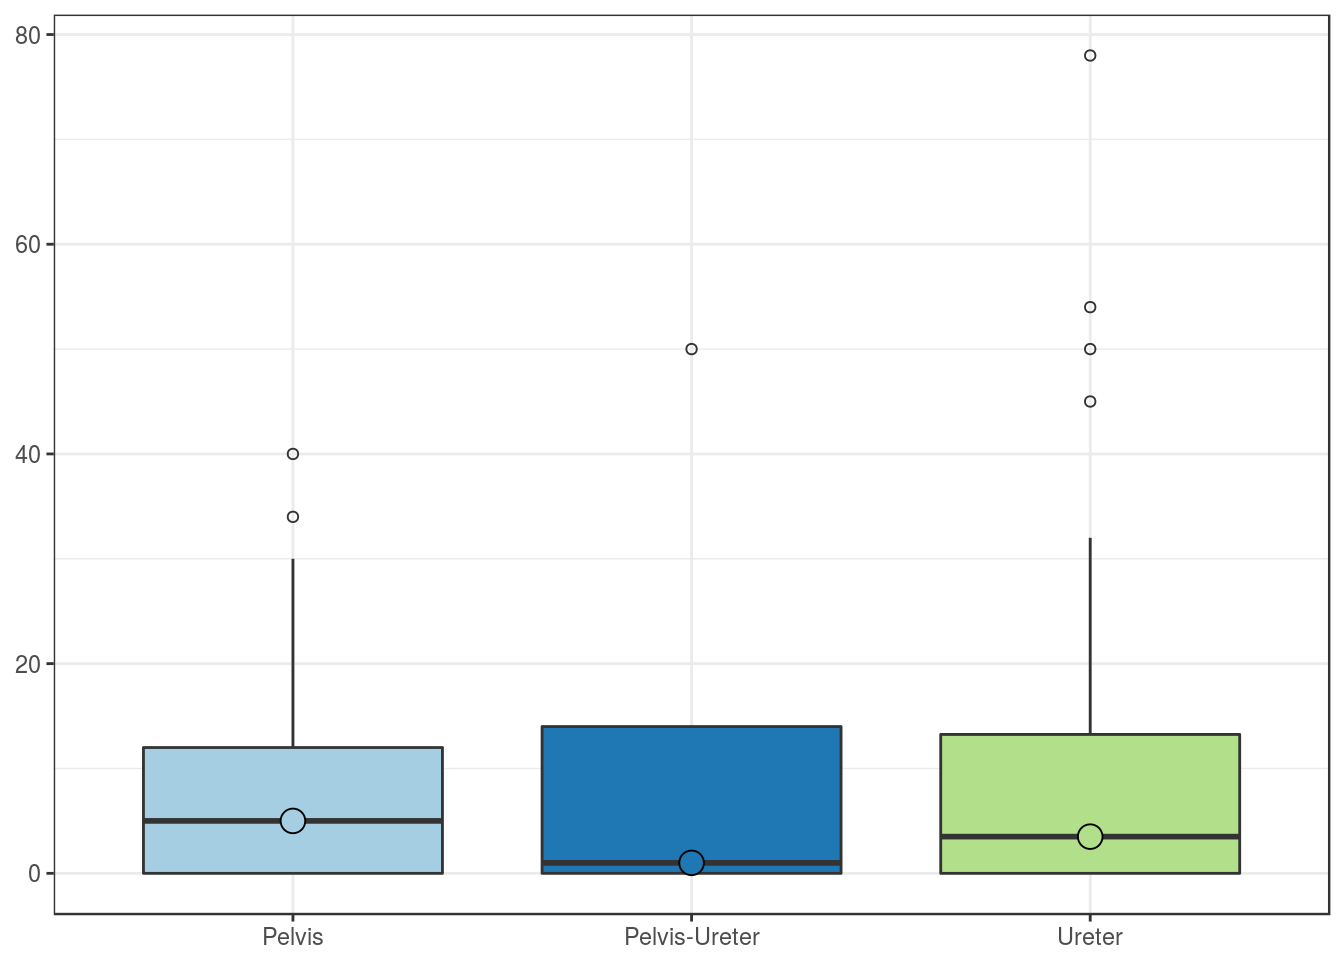
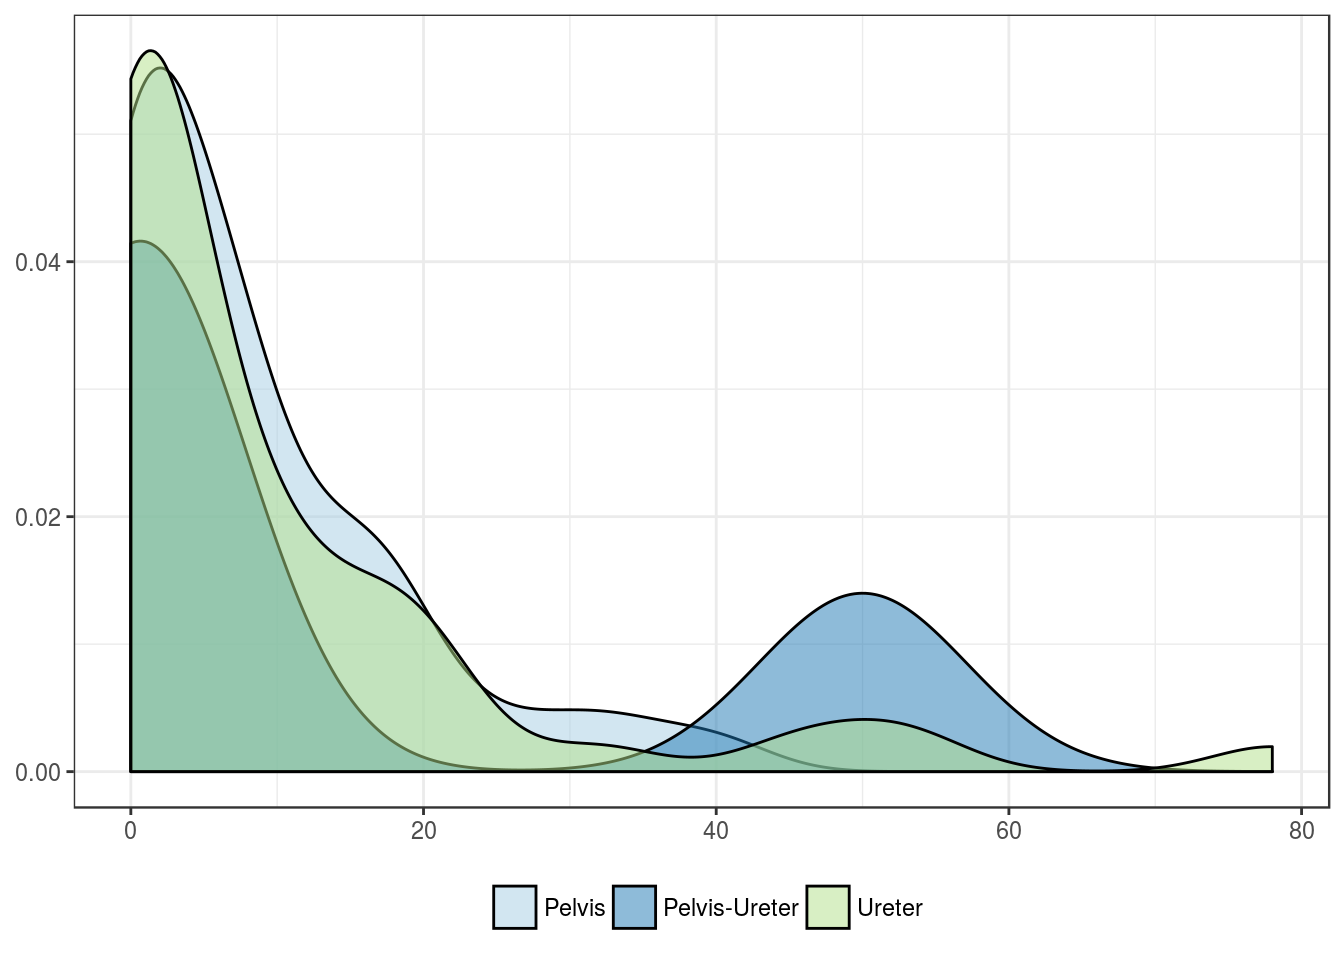
Expression by tumor location
| Pelvis | Pelvis-Ureter | Ureter | |
|---|---|---|---|
| Mean | 8.1 | 13.0 | 10.0 |
| Standard deviation | 9.8 | 24.7 | 16.2 |
| Median | 5.0 | 1.0 | 3.5 |
| Interquartile range | 12.0 | 14.0 | 13.2 |
| Minimum | 0.0 | 0.0 | 0.0 |
| Maximum | 40.0 | 50.0 | 78.0 |
| Value | |
|---|---|
| Statistic | 0.3225 |
| Parameter | 2 |
| P statistic | 0.85 |
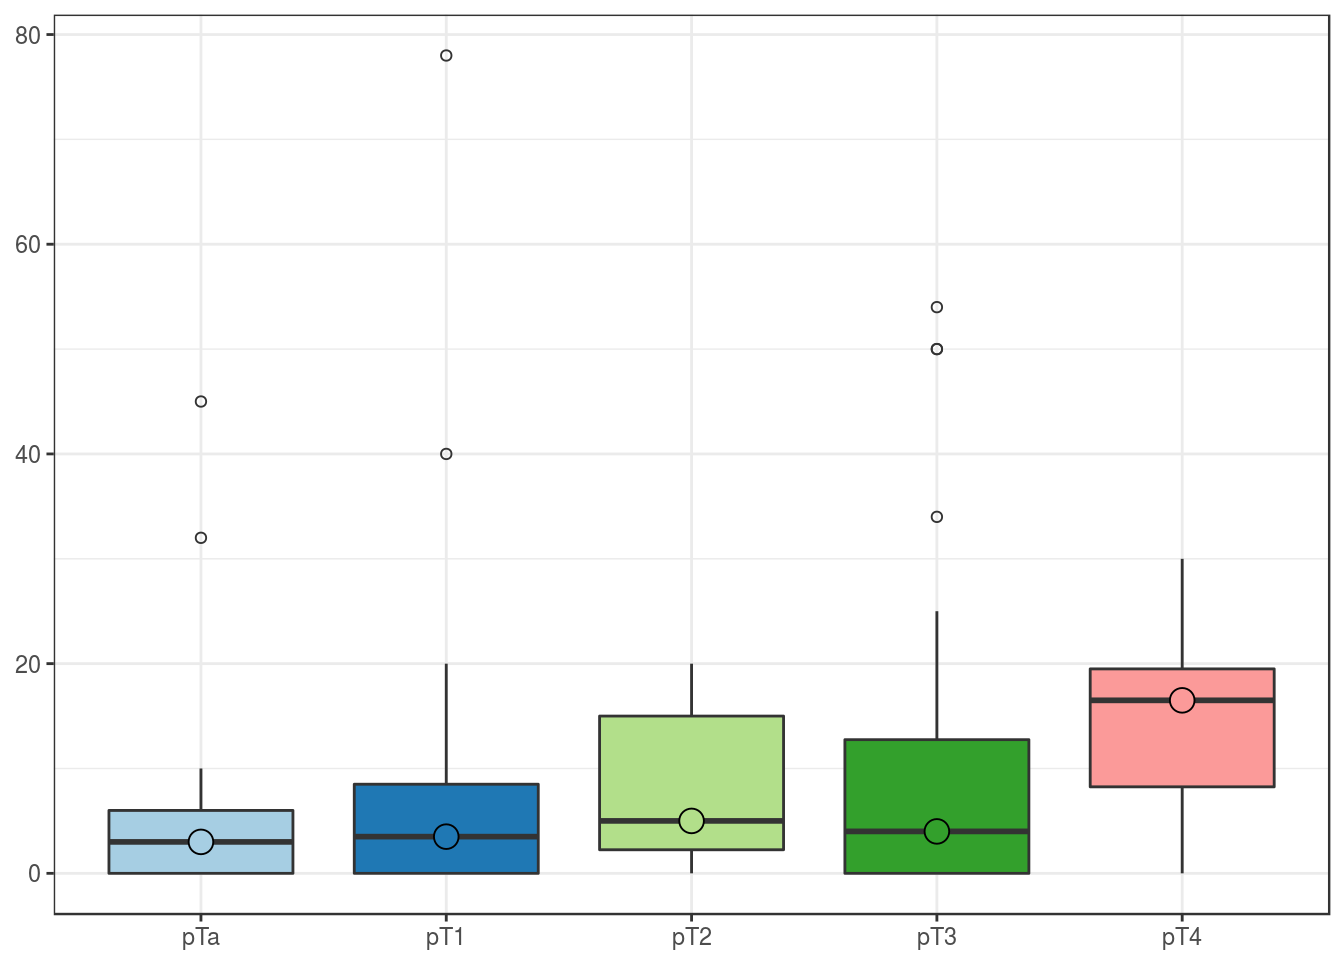
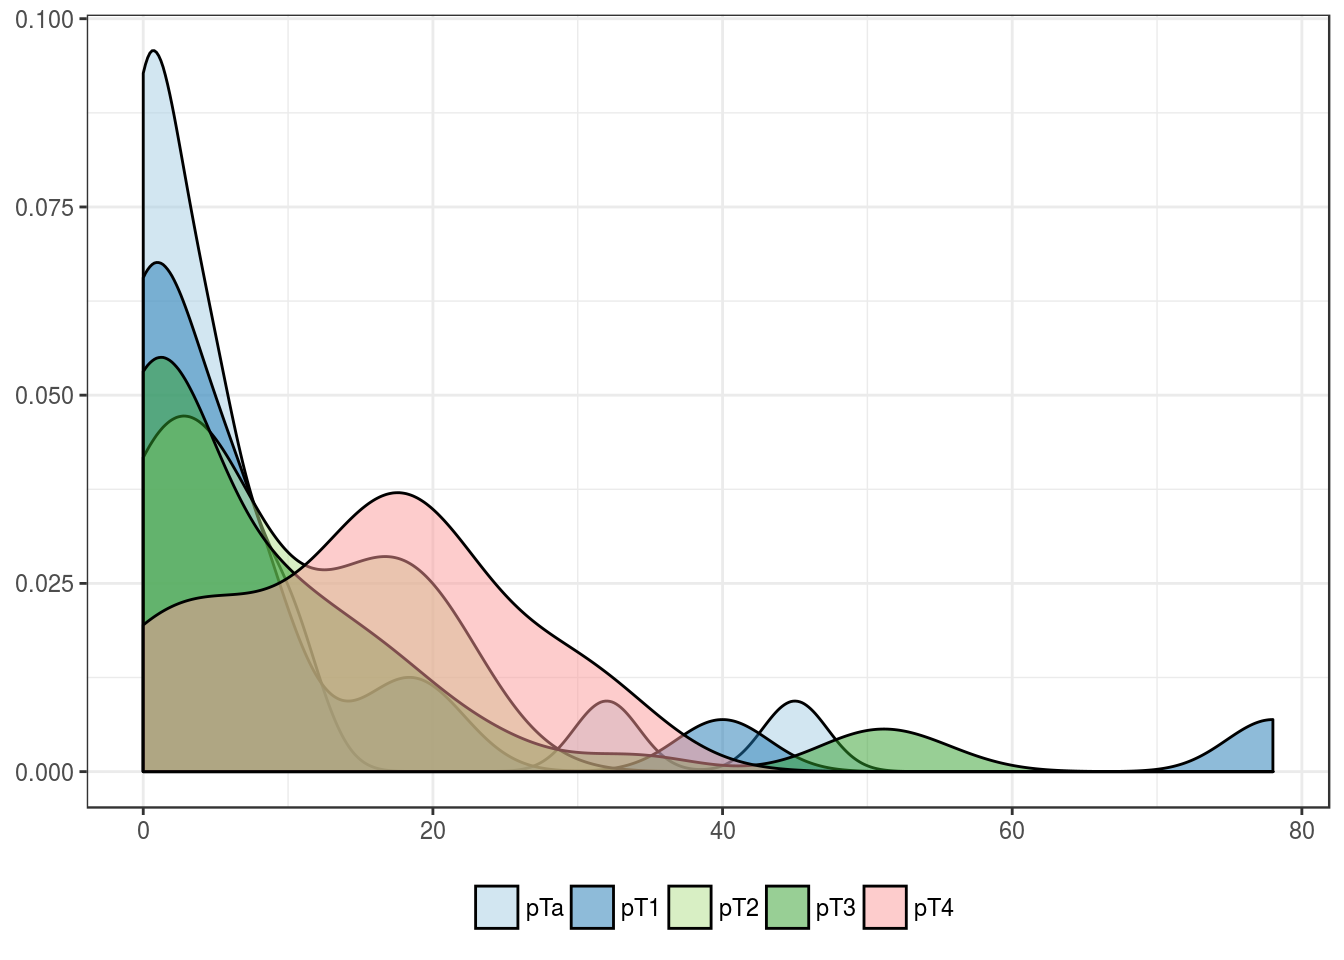
Expression by pT
| pTa | pT1 | pT2 | pT3 | pT4 | |
|---|---|---|---|---|---|
| Mean | 6.6 | 10.6 | 8.1 | 9.3 | 14.8 |
| Standard deviation | 11.9 | 19.7 | 8.0 | 13.5 | 10.6 |
| Median | 3.0 | 3.5 | 5.0 | 4.0 | 16.5 |
| Interquartile range | 6.0 | 8.5 | 12.8 | 12.8 | 11.2 |
| Minimum | 0.0 | 0.0 | 0.0 | 0.0 | 0.0 |
| Maximum | 45.0 | 78.0 | 20.0 | 54.0 | 30.0 |
| Value | |
|---|---|
| Statistic | 4.103 |
| Parameter | 4 |
| P statistic | 0.39 |
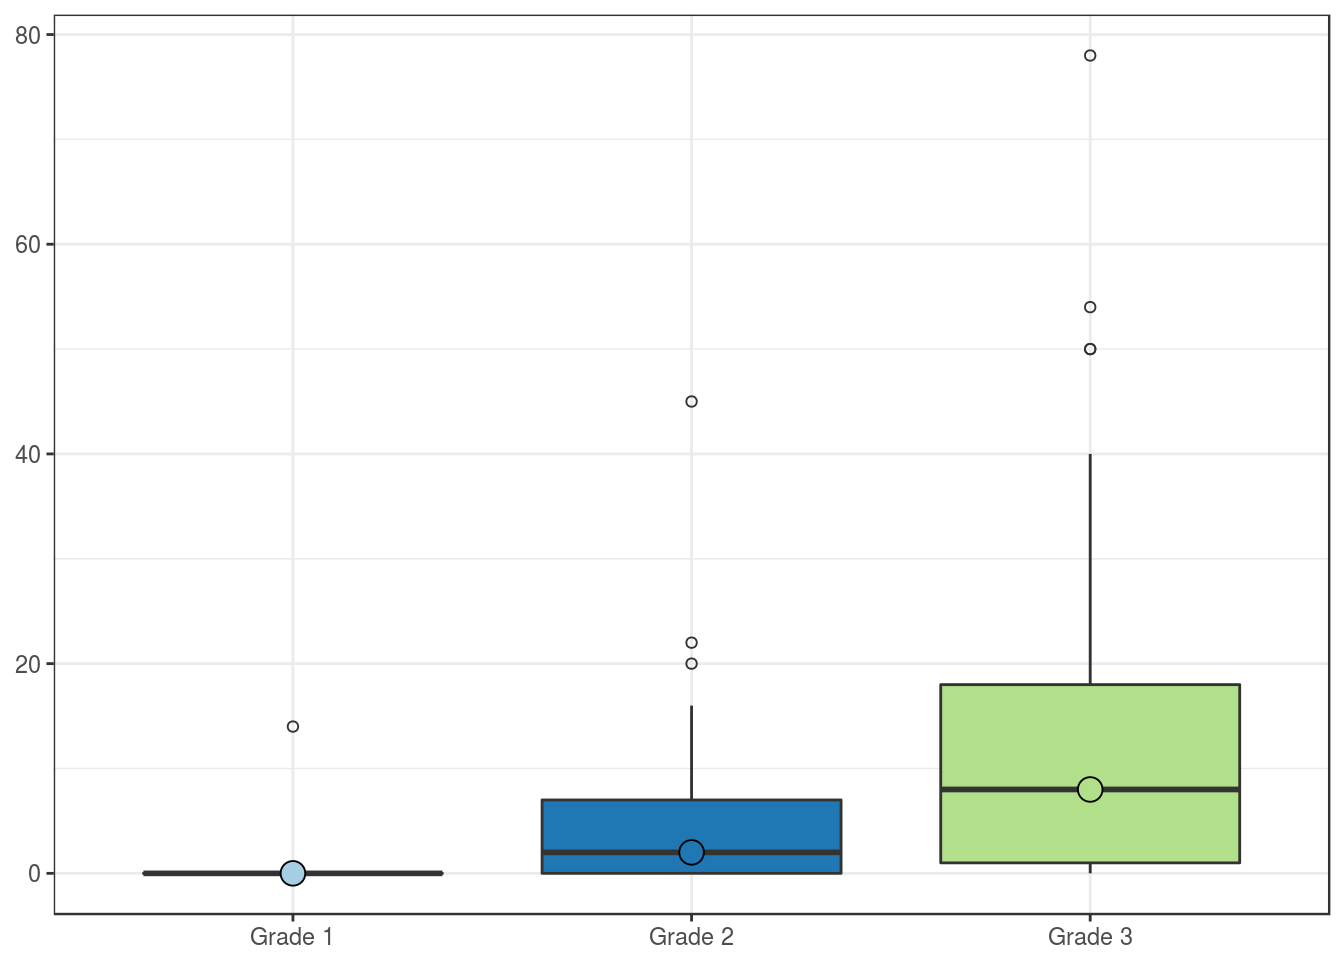
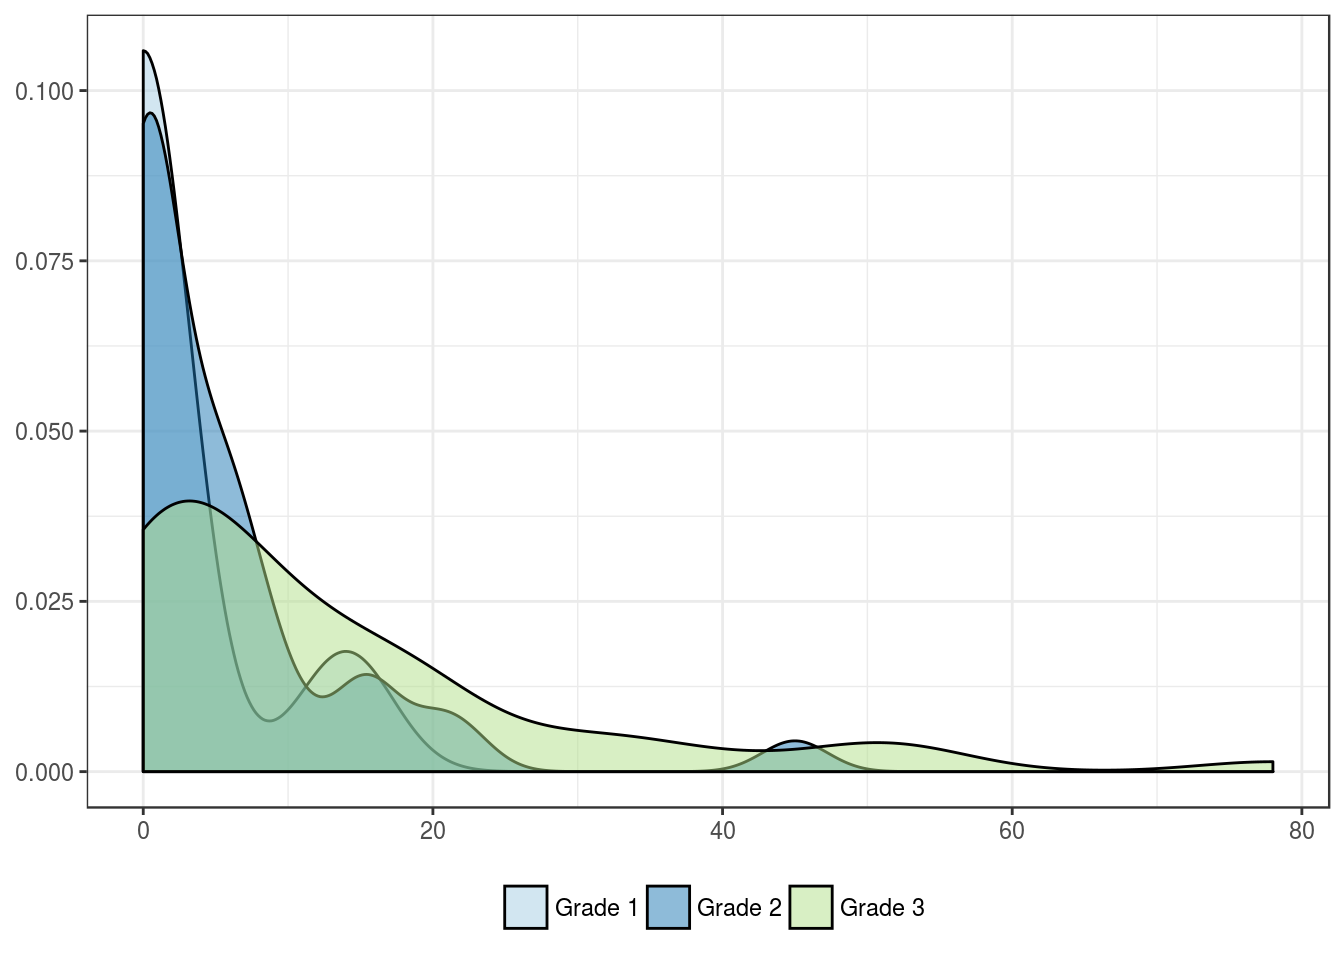
Expression by histologic grade
| Grade 1 | Grade 2 | Grade 3 | |
|---|---|---|---|
| Mean | 2.0 | 5.4 | 13.0 |
| Standard deviation | 5.3 | 8.8 | 16.6 |
| Median | 0.0 | 2.0 | 8.0 |
| Interquartile range | 0.0 | 7.0 | 17.0 |
| Minimum | 0.0 | 0.0 | 0.0 |
| Maximum | 14.0 | 45.0 | 78.0 |
| Value | |
|---|---|
| Statistic | 12.29 |
| Parameter | 2 |
| P statistic | 0.0021 |
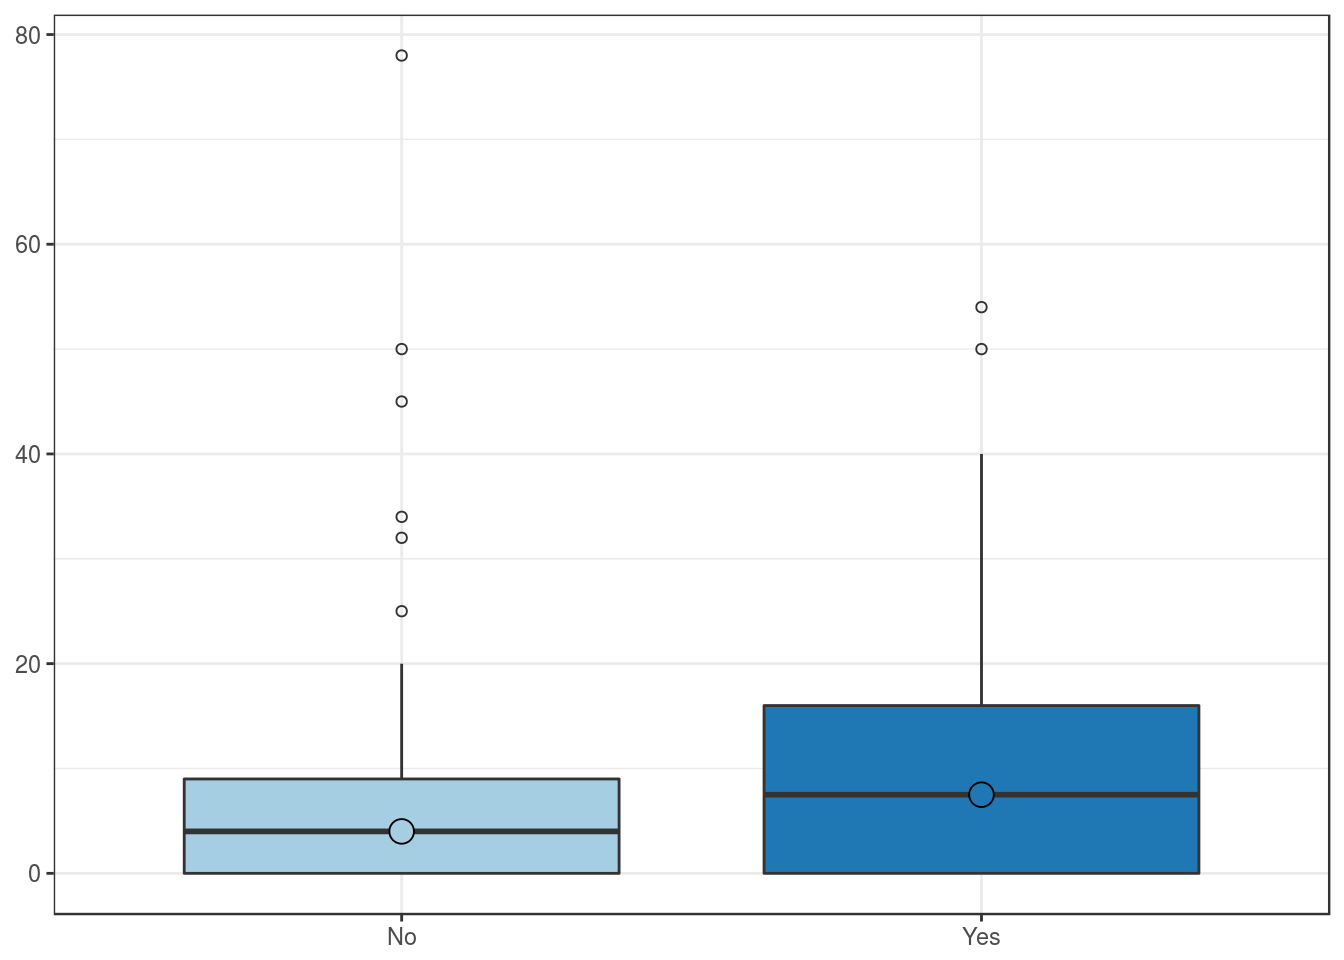
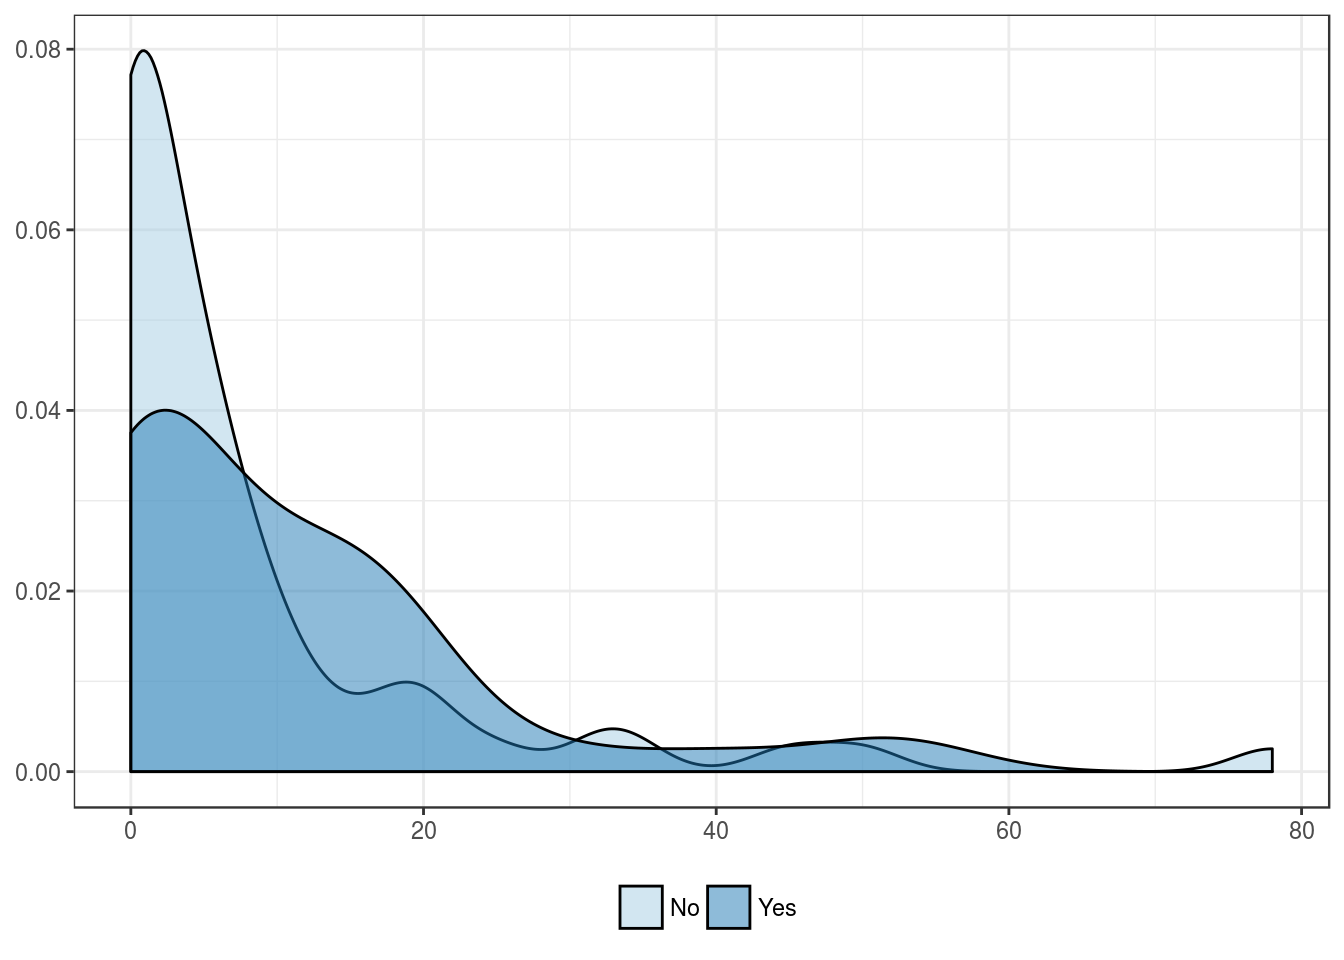
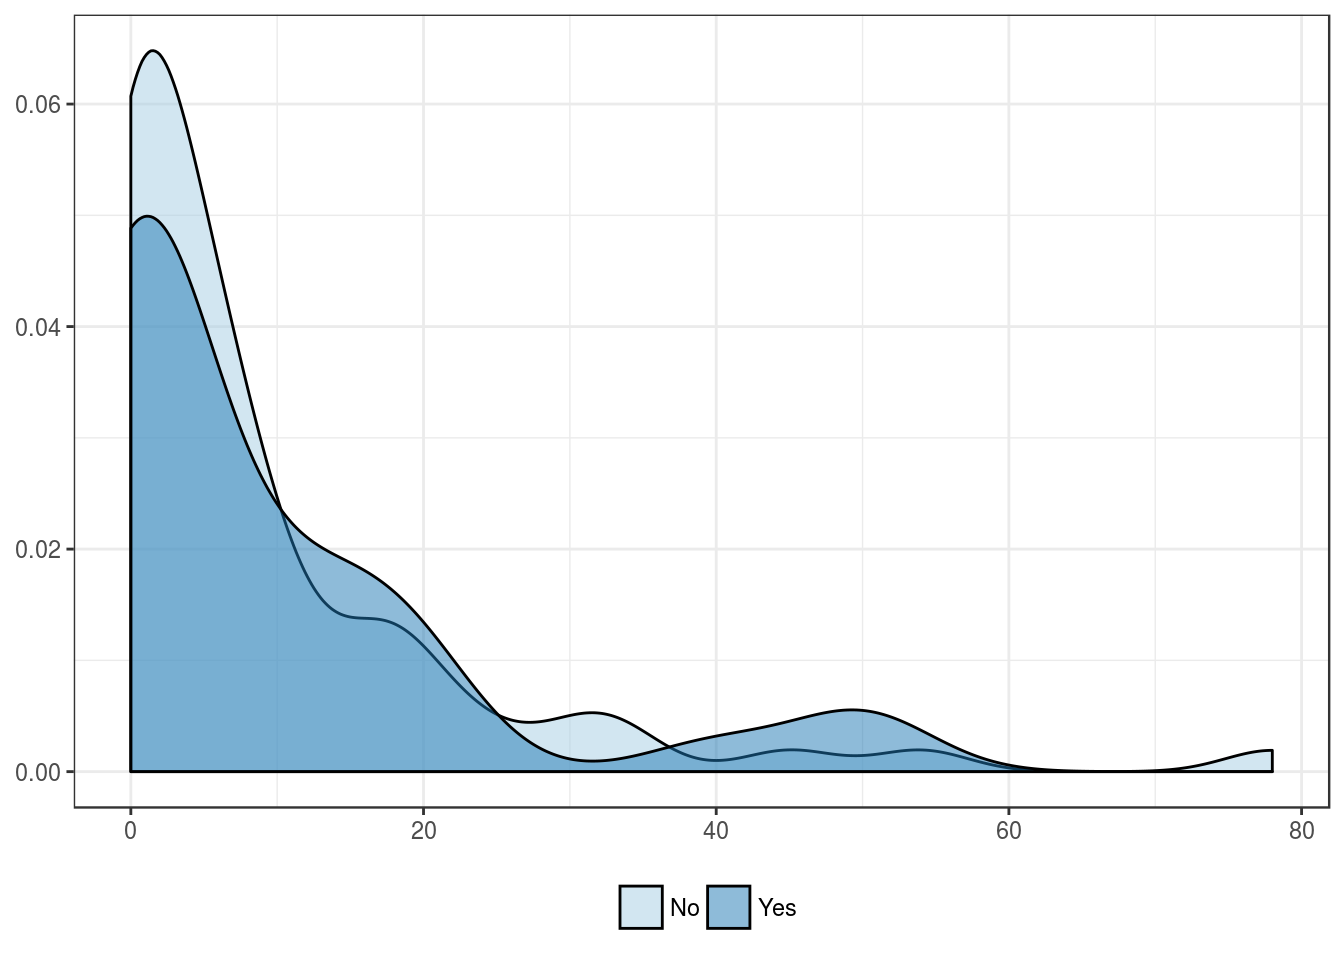
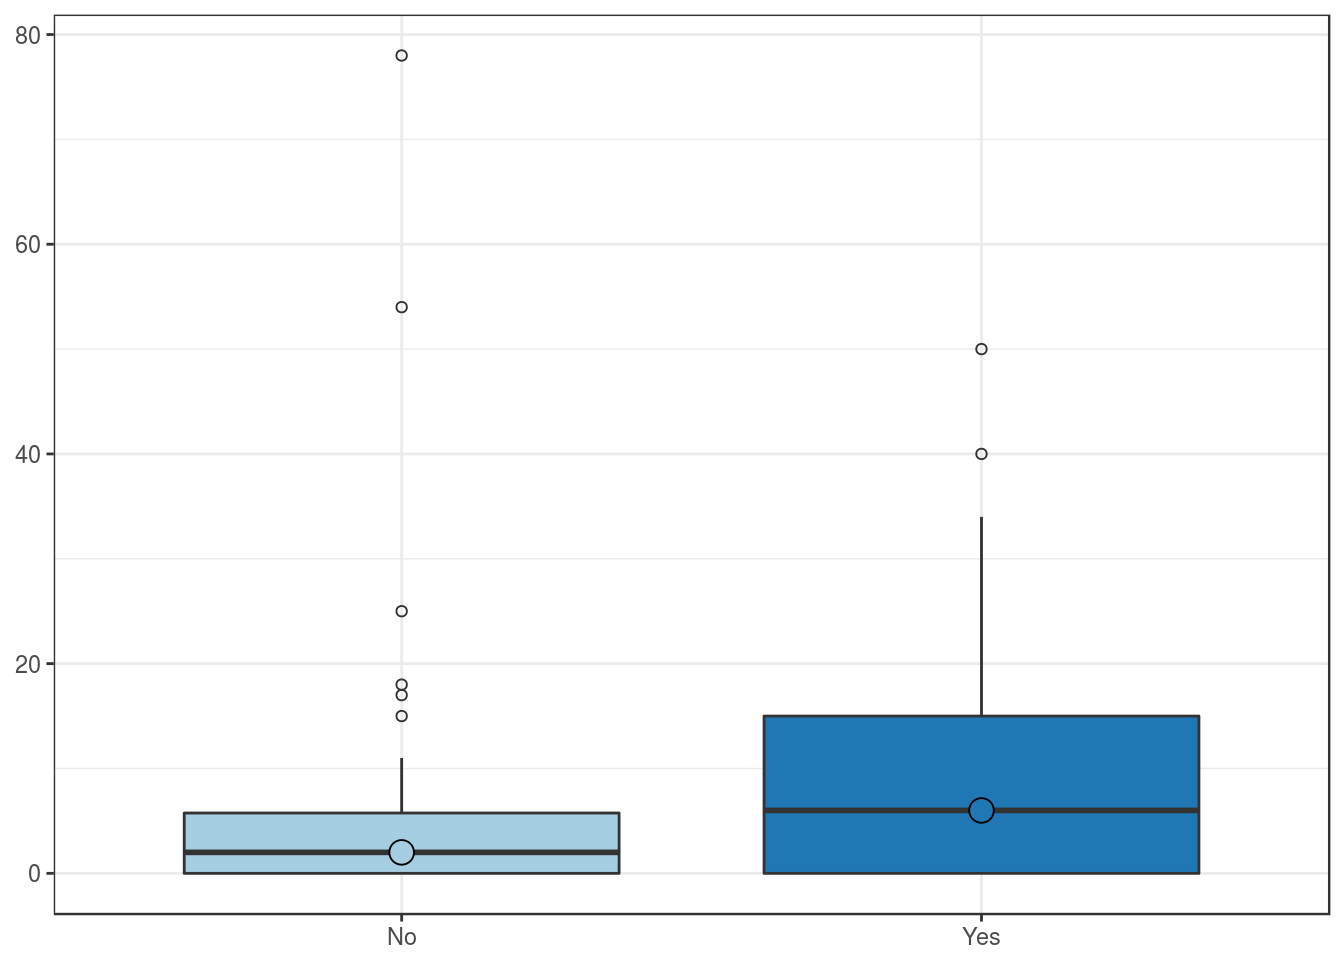
Expression by lymphovascular invasion
| No | Yes | |
|---|---|---|
| Mean | 8.2 | 10.8 |
| Standard deviation | 14.4 | 13.4 |
| Median | 4.0 | 7.5 |
| Interquartile range | 9.0 | 16.0 |
| Minimum | 0.0 | 0.0 |
| Maximum | 78.0 | 54.0 |
| Value | |
|---|---|
| U-statistic | 964 |
| P statistic | 1.1e-01 |
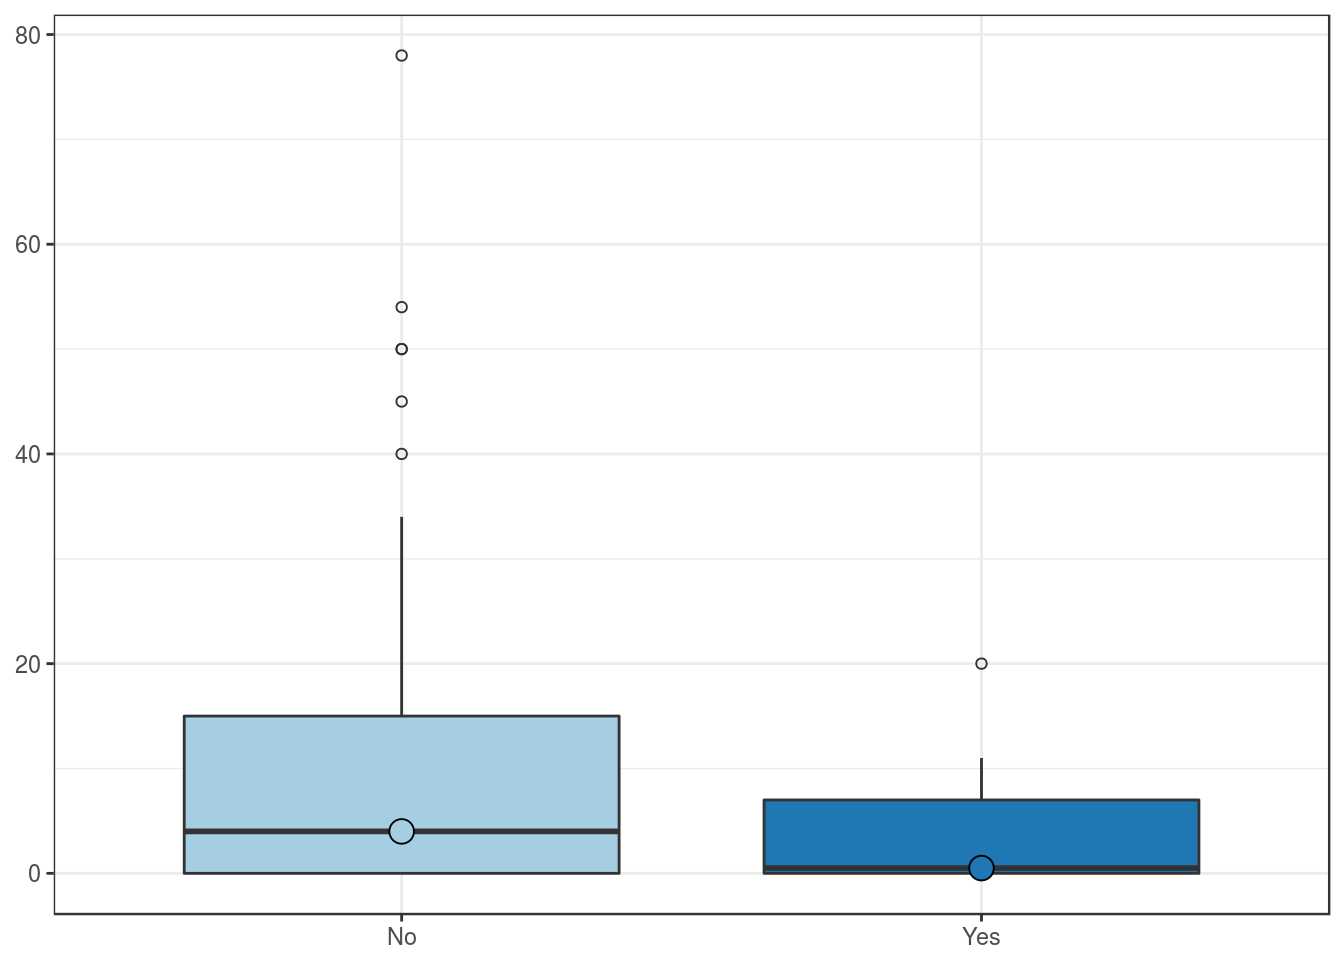
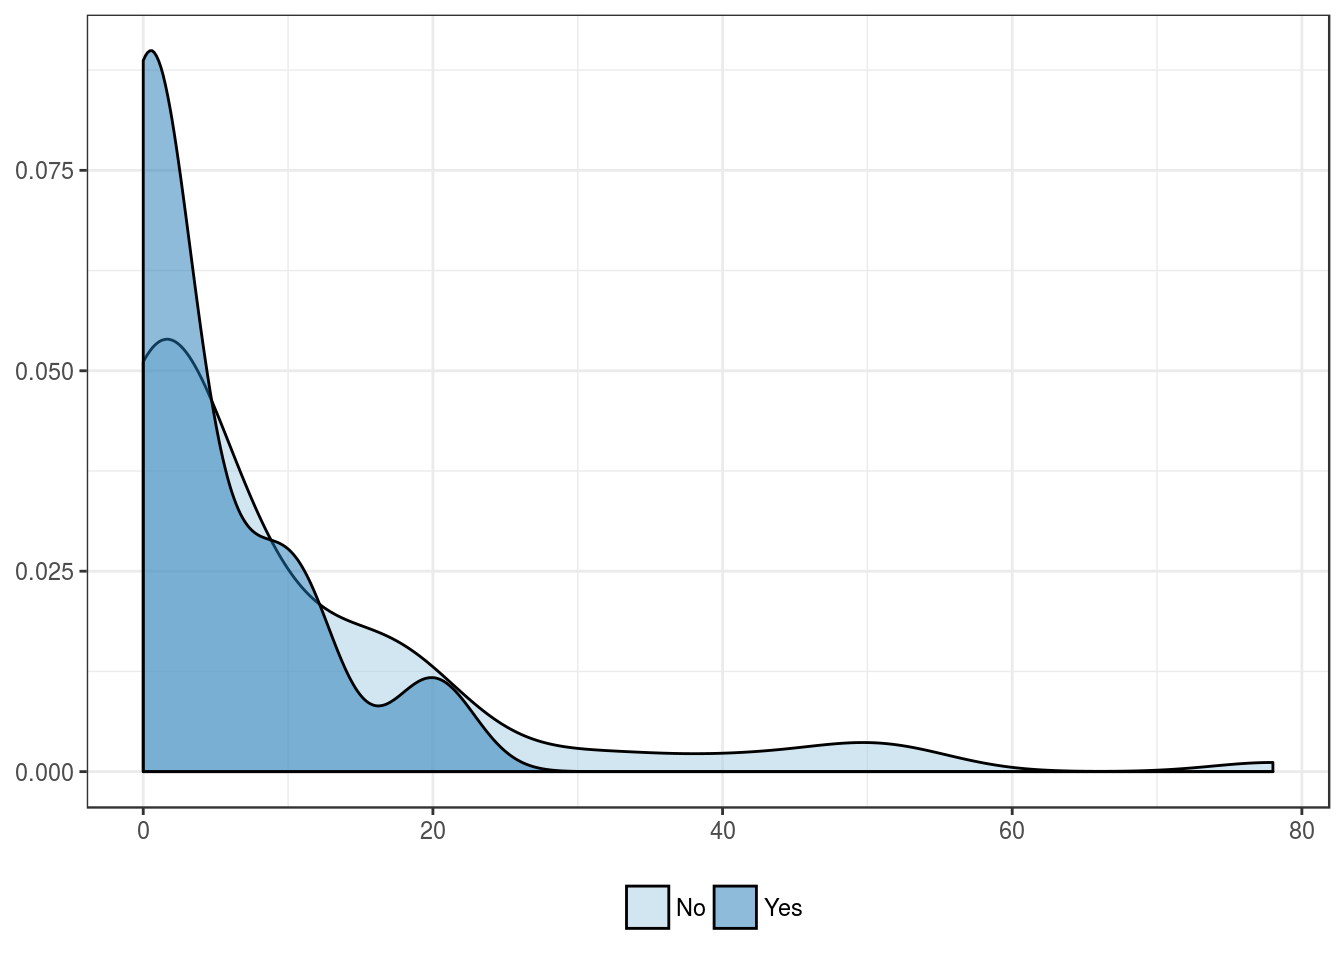
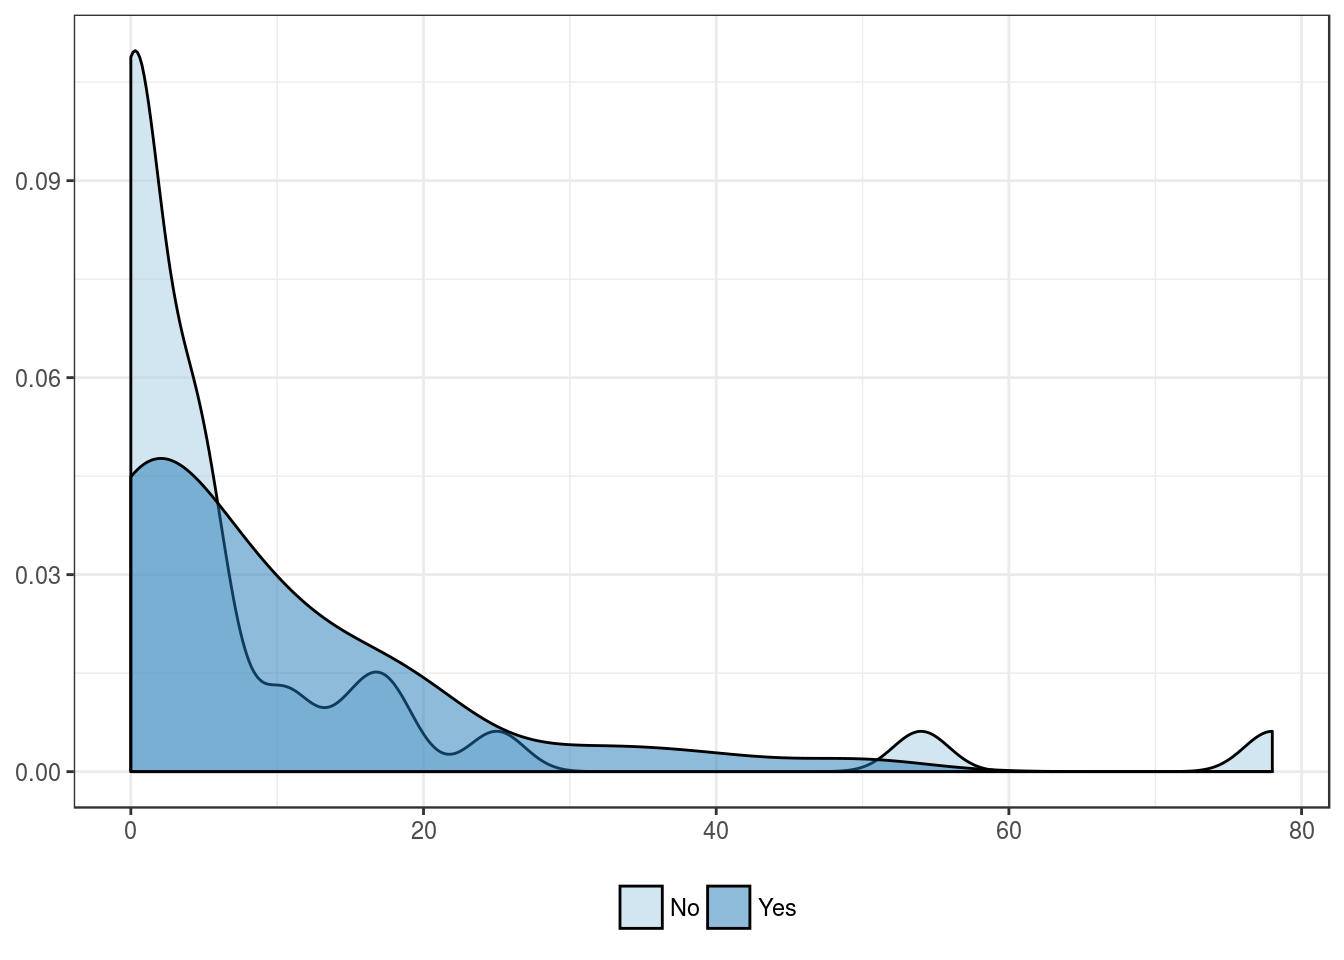
Expression by lymph node metastasis
| No | Yes | |
|---|---|---|
| Mean | 9.8 | 4.2 |
| Standard deviation | 14.7 | 6.4 |
| Median | 4.0 | 0.5 |
| Interquartile range | 15.0 | 7.0 |
| Minimum | 0.0 | 0.0 |
| Maximum | 78.0 | 20.0 |
| Value | |
|---|---|
| U-statistic | 607 |
| P statistic | 2.4e-01 |
Outcome features
Expression by bladder recurrence
| No | Yes | |
|---|---|---|
| Mean | 9.2 | 9.2 |
| Standard deviation | 14.2 | 14.0 |
| Median | 4.0 | 2.5 |
| Interquartile range | 11.0 | 14.2 |
| Minimum | 0.0 | 0.0 |
| Maximum | 78.0 | 50.0 |
| Value | |
|---|---|
| U-statistic | 1084 |
| P statistic | 7.3e-01 |

Expression by tumor progression
| No | Yes | |
|---|---|---|
| Mean | 7.9 | 8.9 |
| Standard deviation | 16.3 | 11.4 |
| Median | 2.0 | 6.0 |
| Interquartile range | 5.8 | 15.0 |
| Minimum | 0.0 | 0.0 |
| Maximum | 78.0 | 50.0 |
| Value | |
|---|---|
| U-statistic | 692 |
| P statistic | 1.8e-01 |
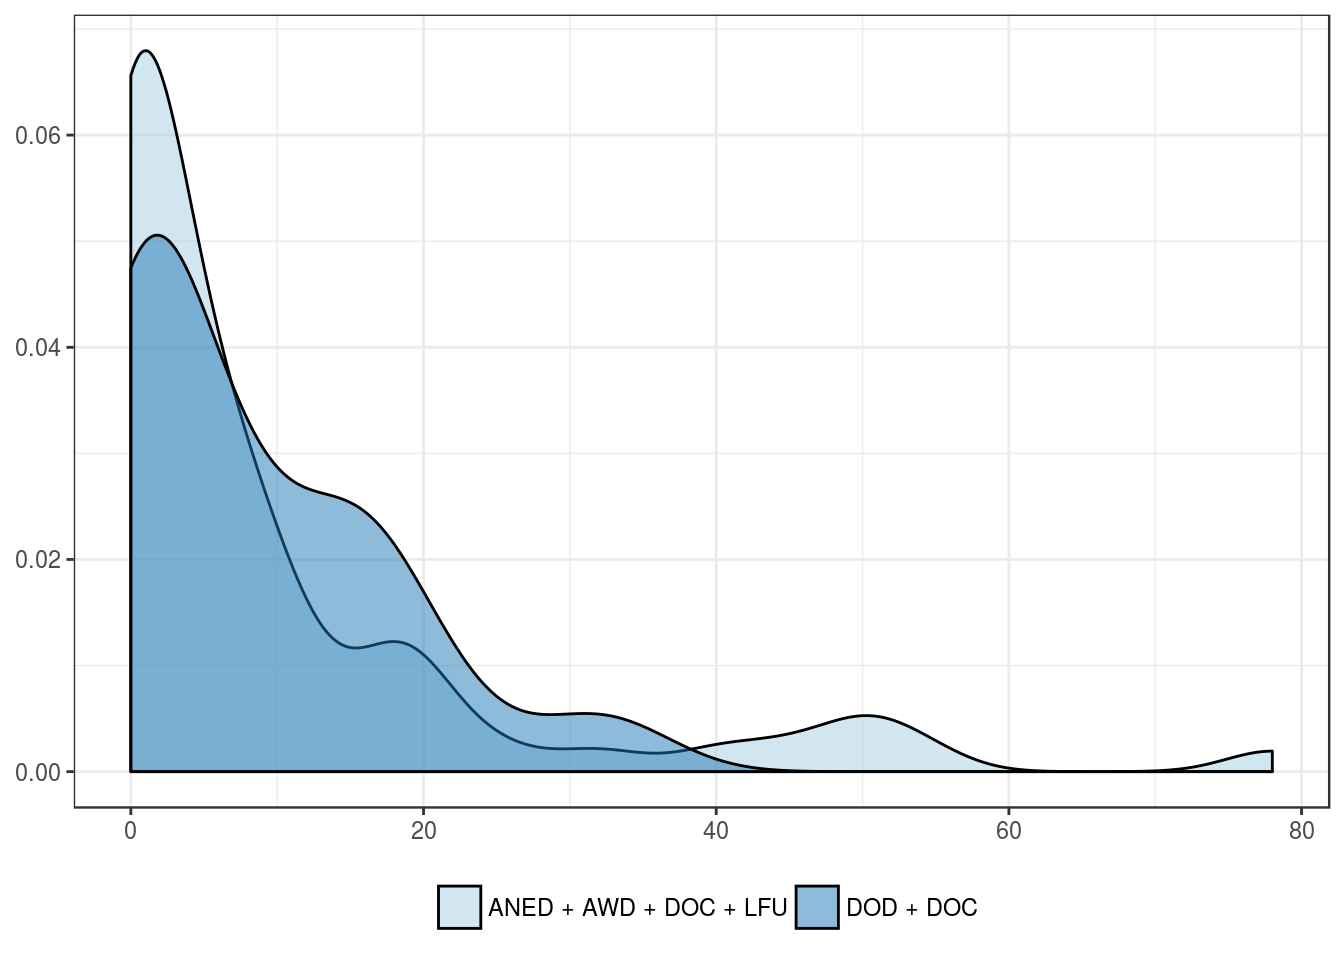
Expression by overall mortality
| ANED + AWD + DOC + LFU | DOD + DOC | |
|---|---|---|
| Mean | 9.8 | 8.3 |
| Standard deviation | 15.9 | 9.3 |
| Median | 4.0 | 5.0 |
| Interquartile range | 10.8 | 15.0 |
| Minimum | 0.0 | 0.0 |
| Maximum | 78.0 | 34.0 |
| Value | |
|---|---|
| U-statistic | 1004 |
| P statistic | 5.2e-01 |

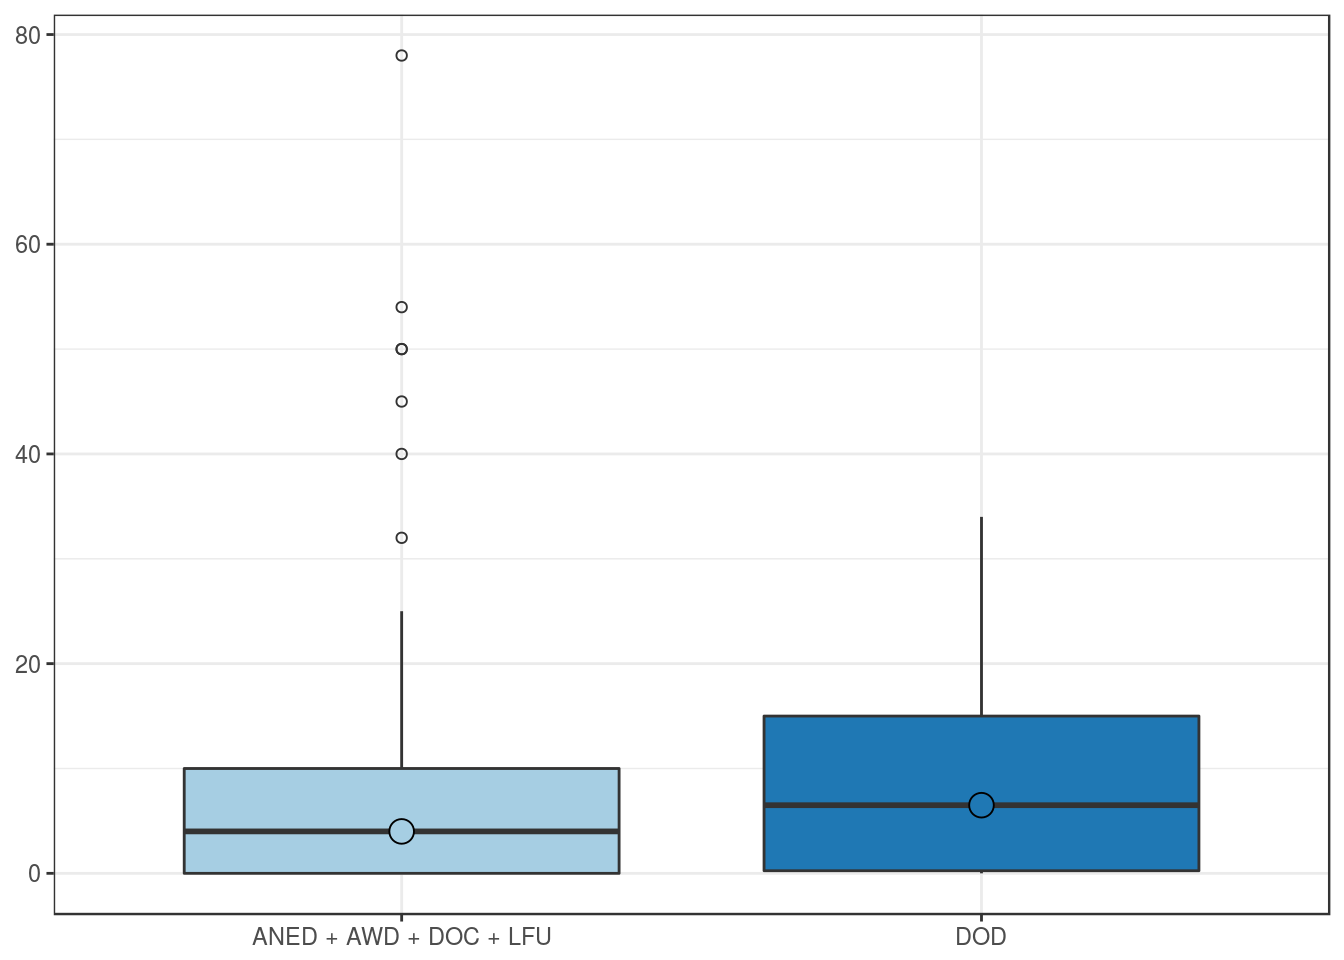
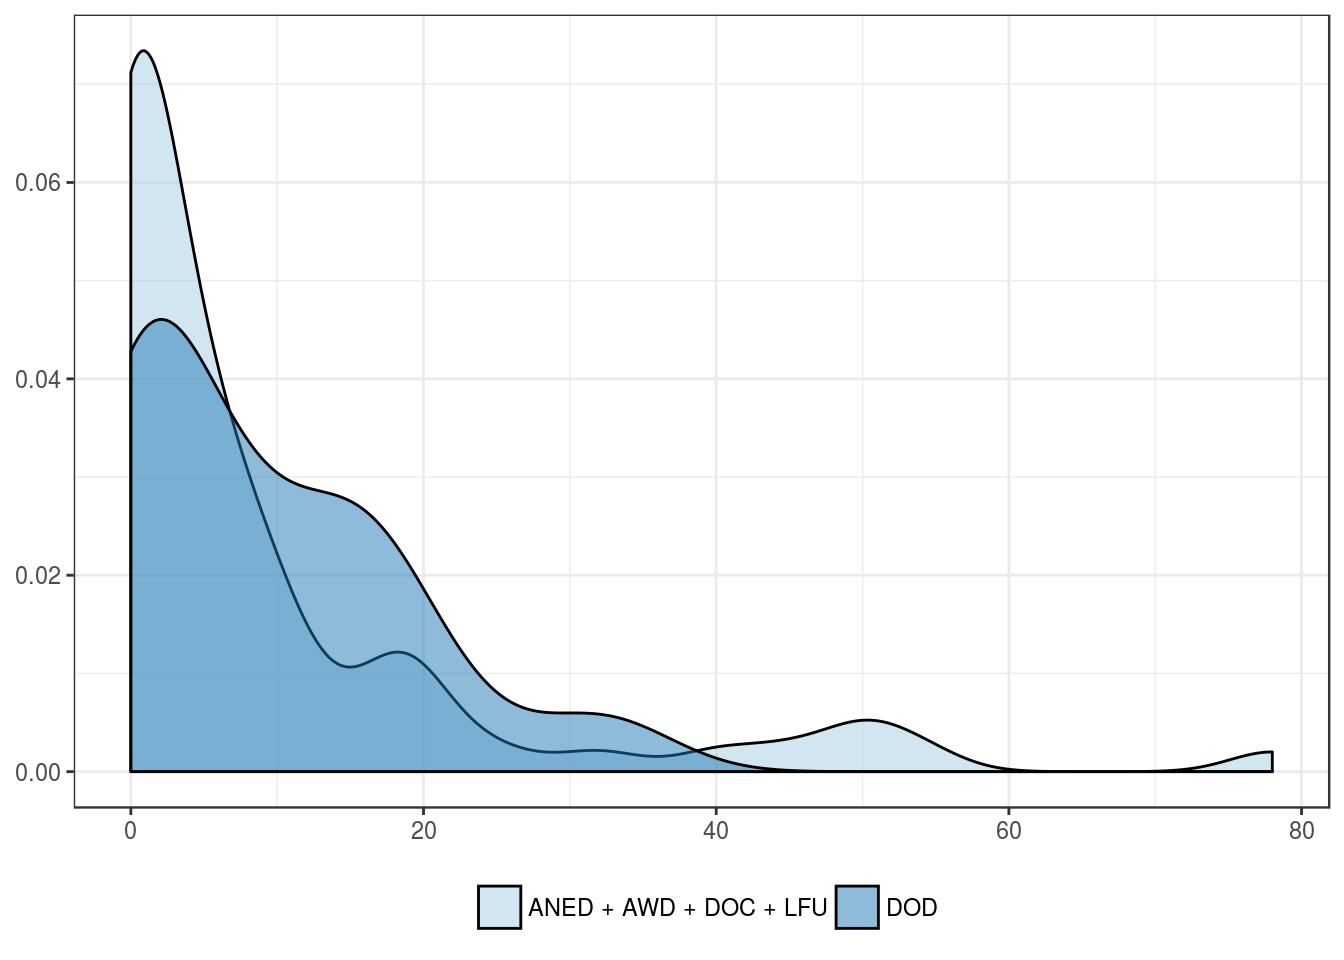
Expression by cancer-related mortality
| ANED + AWD + DOC + LFU | DOD | |
|---|---|---|
| Mean | 9.4 | 9.0 |
| Standard deviation | 15.6 | 9.4 |
| Median | 4.0 | 6.5 |
| Interquartile range | 10.0 | 14.8 |
| Minimum | 0.0 | 0.0 |
| Maximum | 78.0 | 34.0 |
| Value | |
|---|---|
| U-statistic | 887 |
| P statistic | 2.5e-01 |