Double CD8–Ki67 positivity in intratumoral lymphocytes
Clinical features
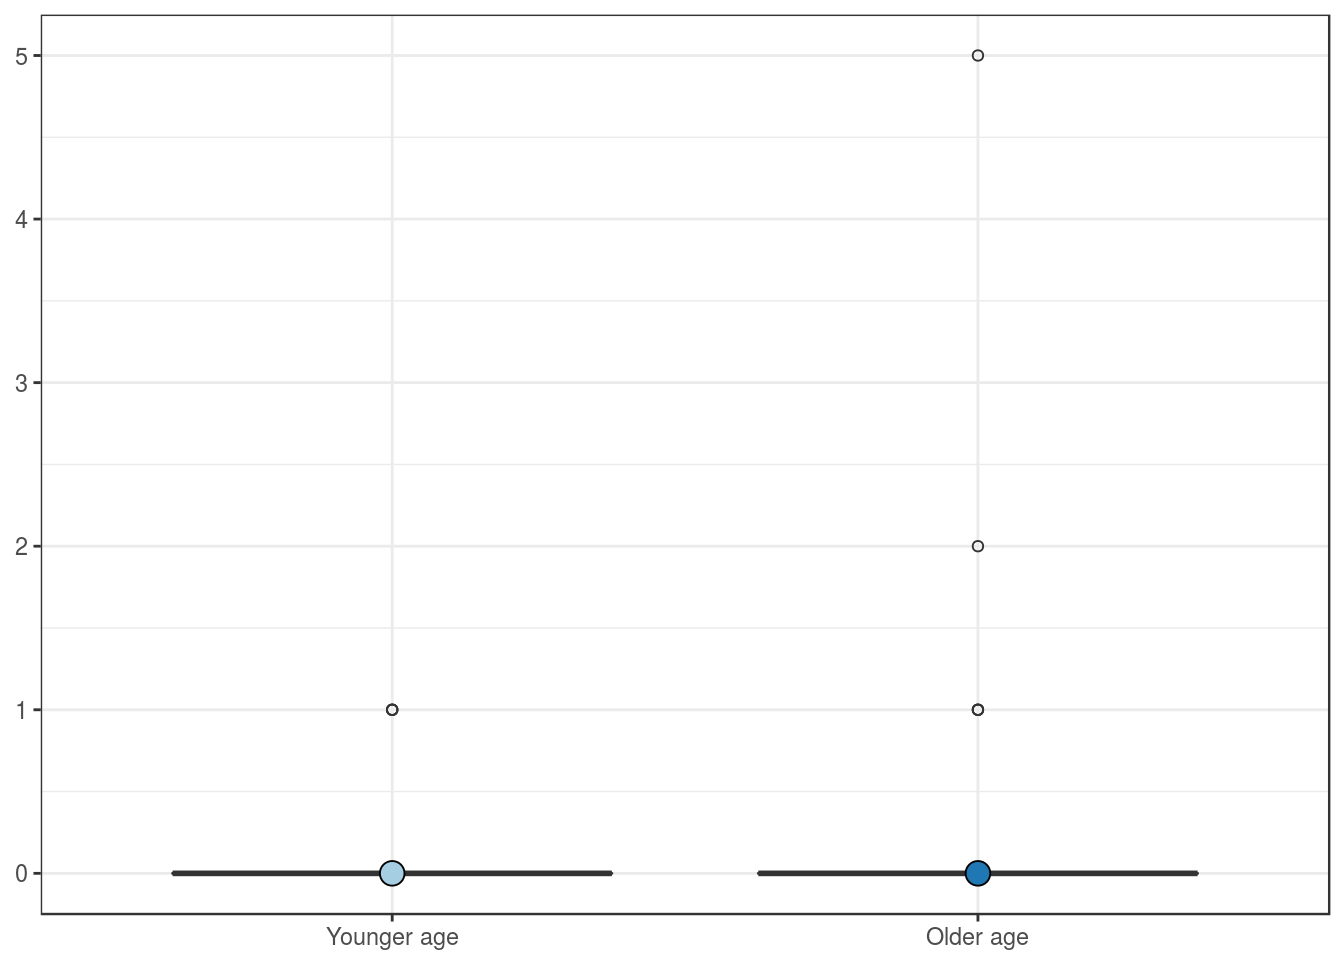
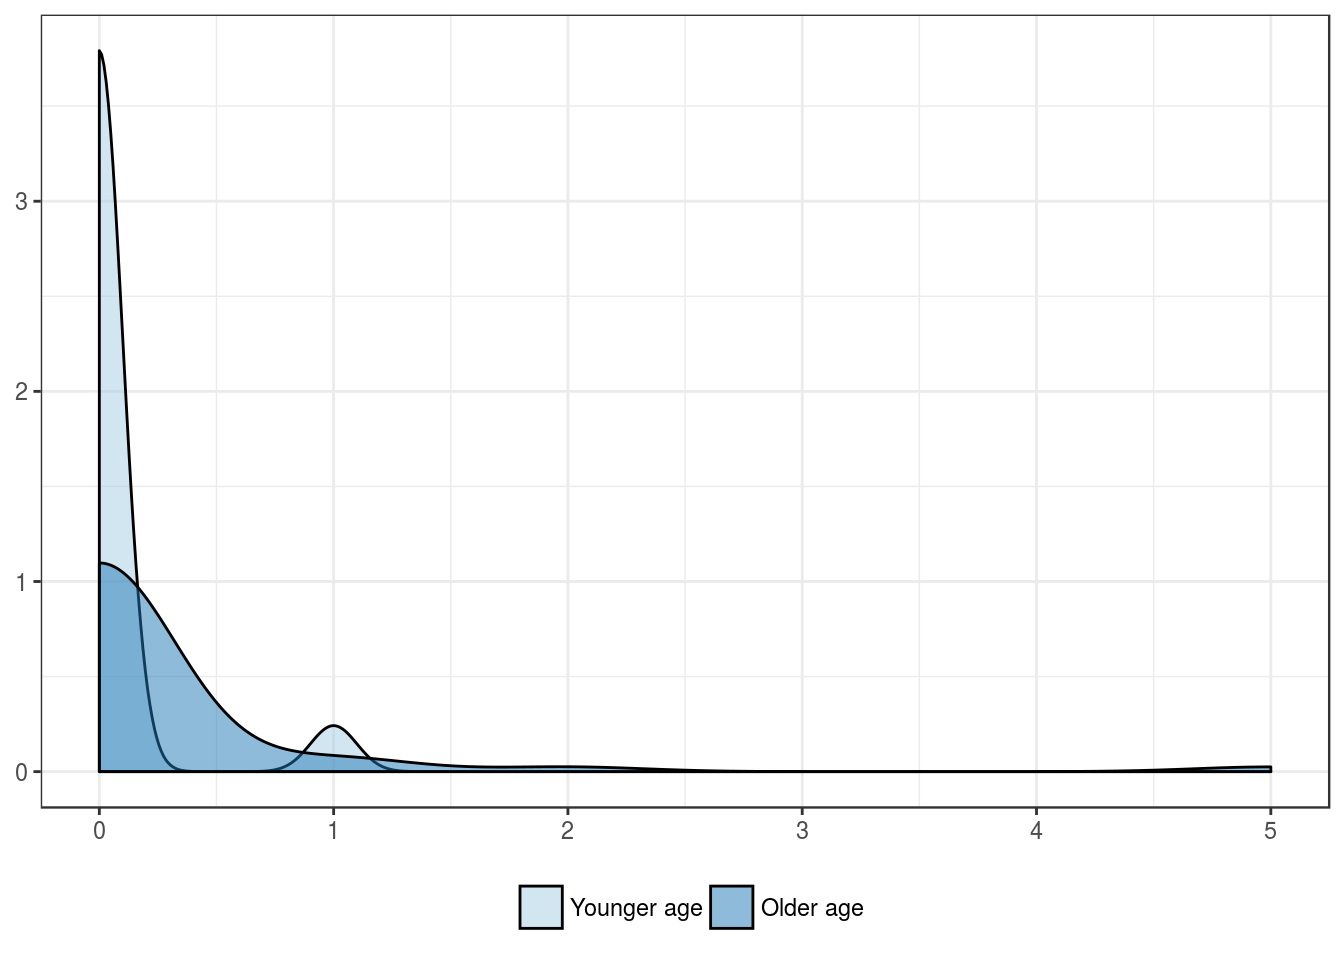
Expression by patient’s age group
| Younger age | Older age | |
|---|---|---|
| Mean | 0.1 | 0.2 |
| Standard deviation | 0.2 | 0.8 |
| Median | 0.0 | 0.0 |
| Interquartile range | 0.0 | 0.0 |
| Minimum | 0.0 | 0.0 |
| Maximum | 1.0 | 5.0 |
| Value | |
|---|---|
| U-statistic | 1170 |
| P statistic | 4.2e-01 |
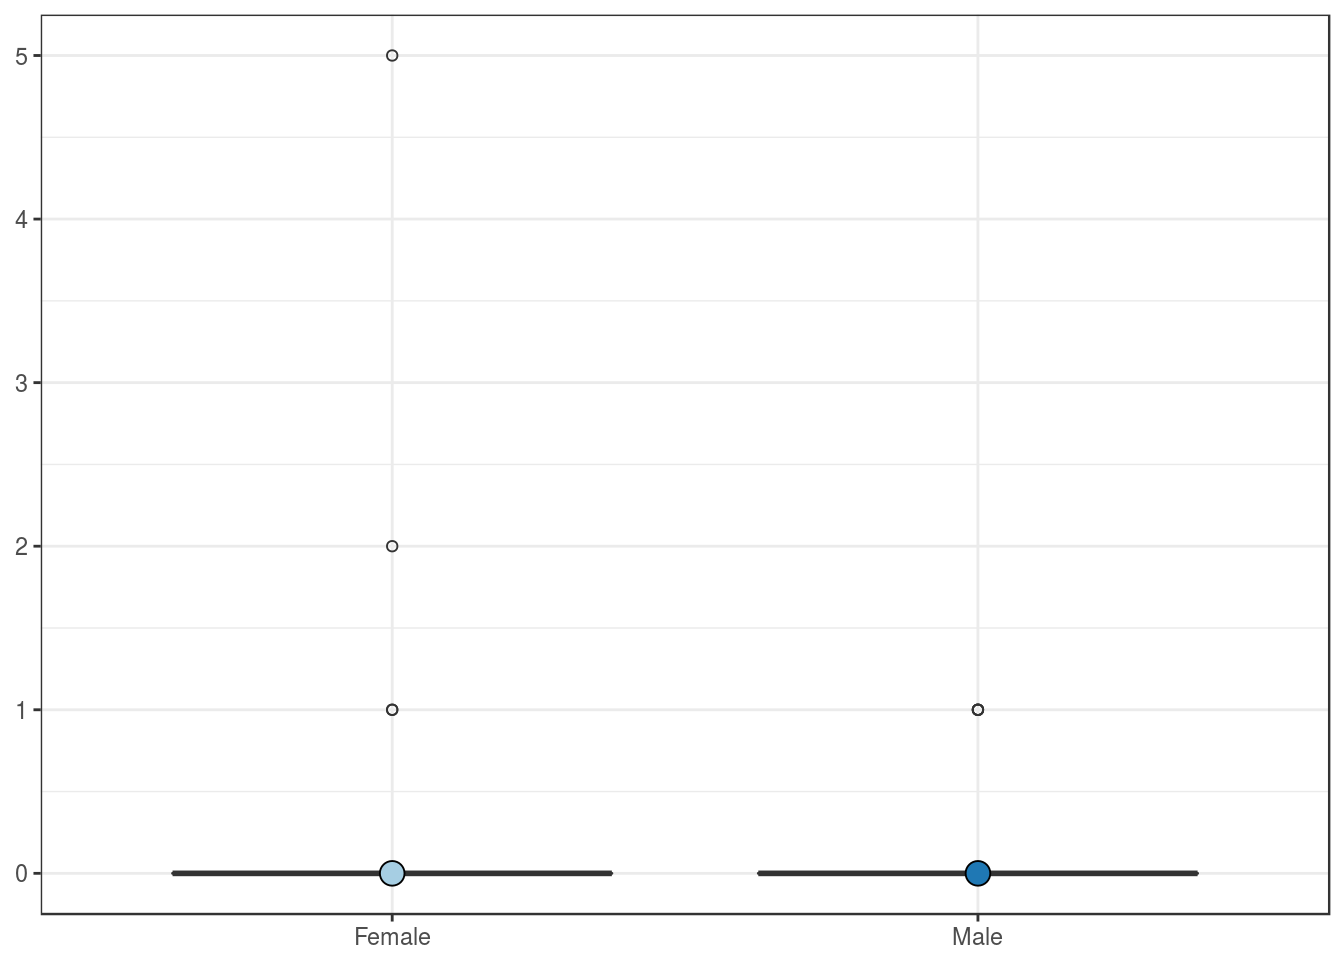
Expression by patient’s sex
| Female | Male | |
|---|---|---|
| Mean | 0.2 | 0.1 |
| Standard deviation | 0.9 | 0.3 |
| Median | 0.0 | 0.0 |
| Interquartile range | 0.0 | 0.0 |
| Minimum | 0.0 | 0.0 |
| Maximum | 5.0 | 1.0 |
| Value | |
|---|---|
| U-statistic | 1216 |
| P statistic | 4.9e-01 |

Pathologic features
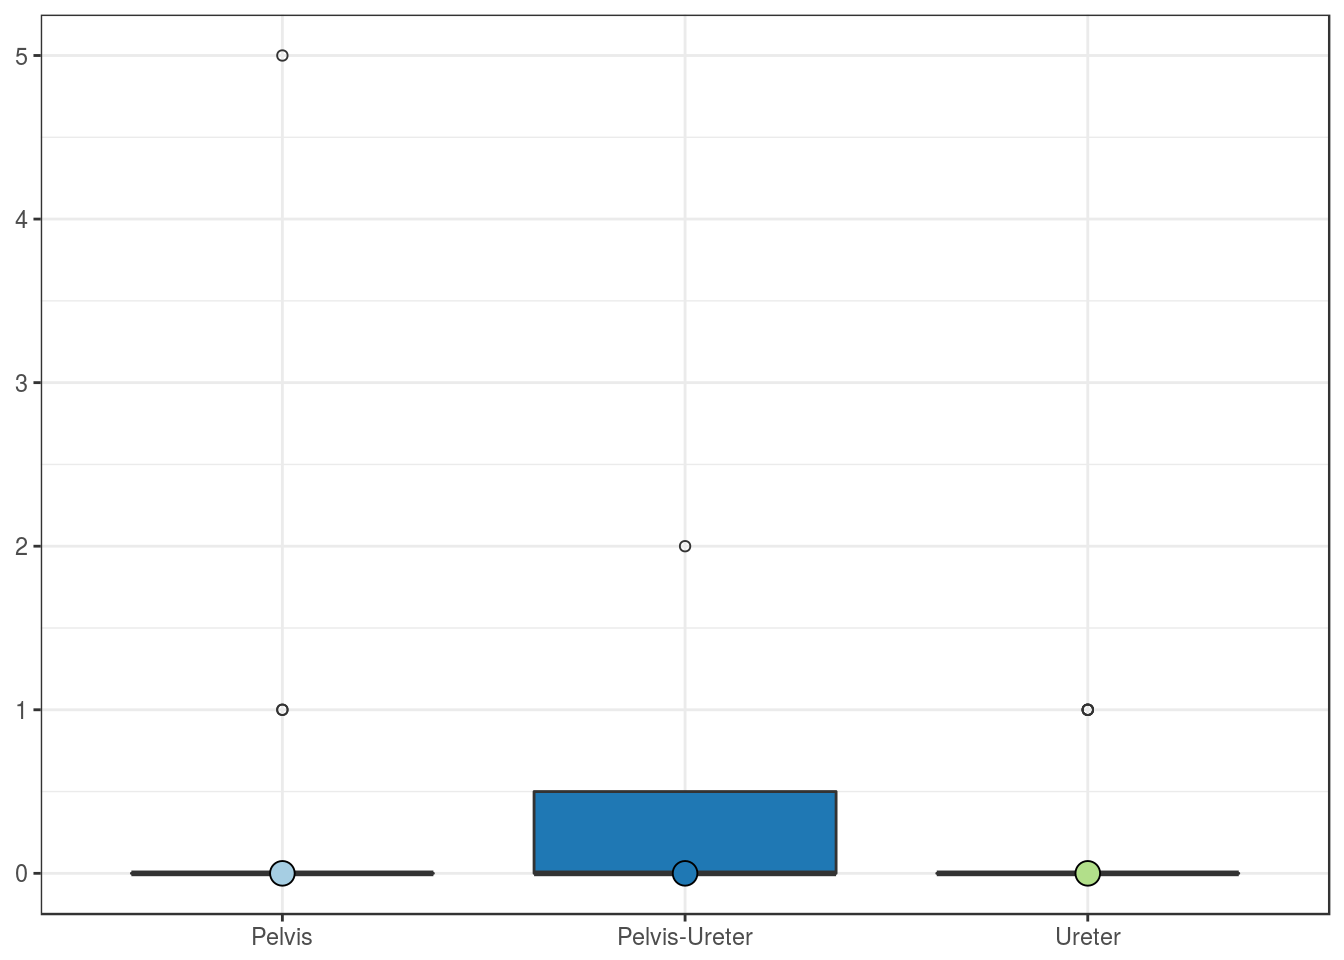
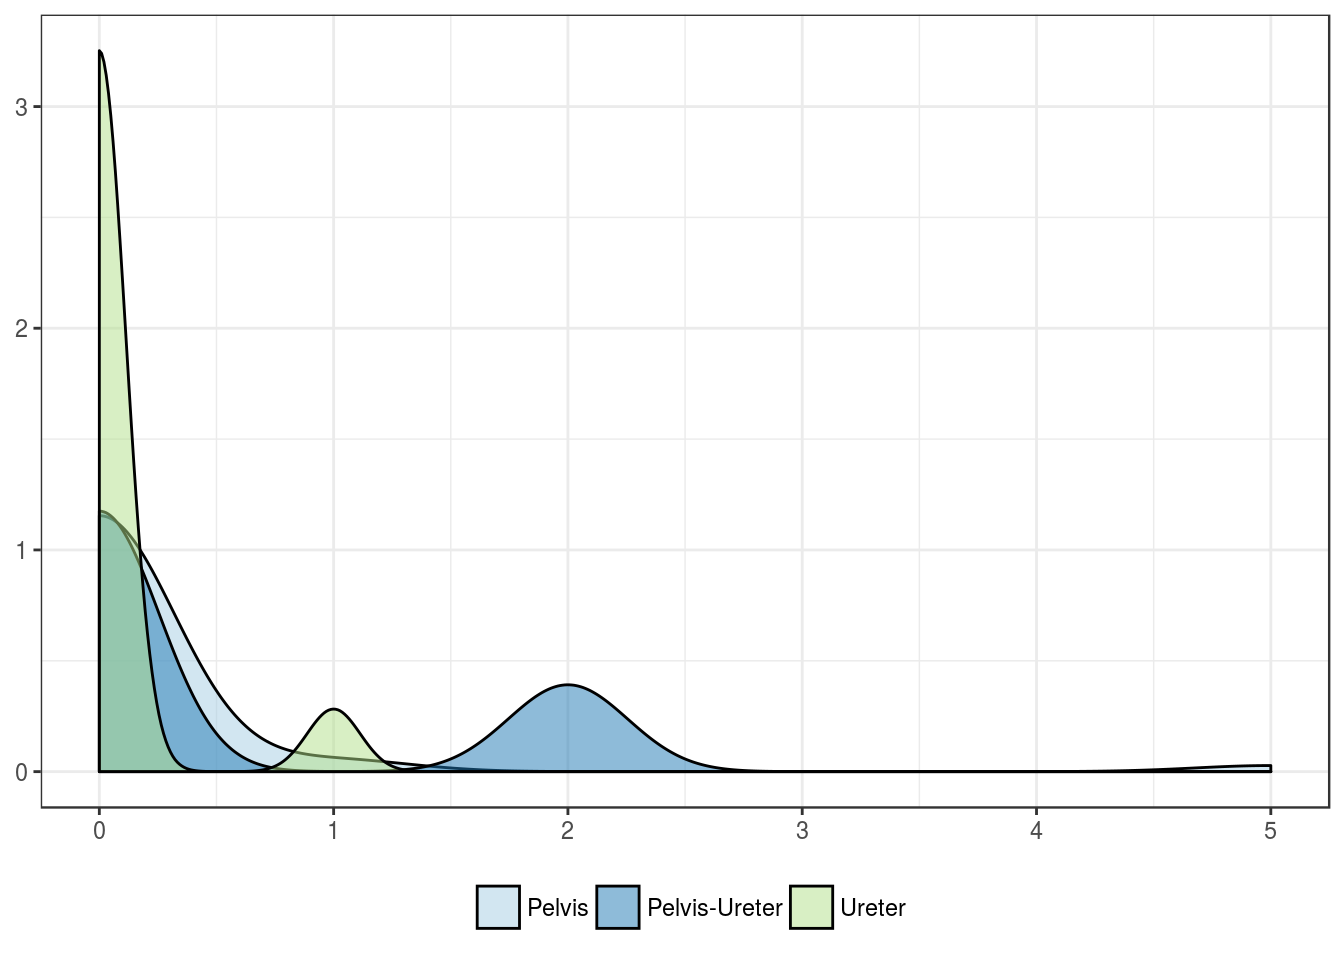
Expression by tumor location
| Pelvis | Pelvis-Ureter | Ureter | |
|---|---|---|---|
| Mean | 0.2 | 0.5 | 0.1 |
| Standard deviation | 0.8 | 1.0 | 0.3 |
| Median | 0.0 | 0.0 | 0.0 |
| Interquartile range | 0.0 | 0.5 | 0.0 |
| Minimum | 0.0 | 0.0 | 0.0 |
| Maximum | 5.0 | 2.0 | 1.0 |
| Value | |
|---|---|
| Statistic | 1.872 |
| Parameter | 2 |
| P statistic | 0.39 |
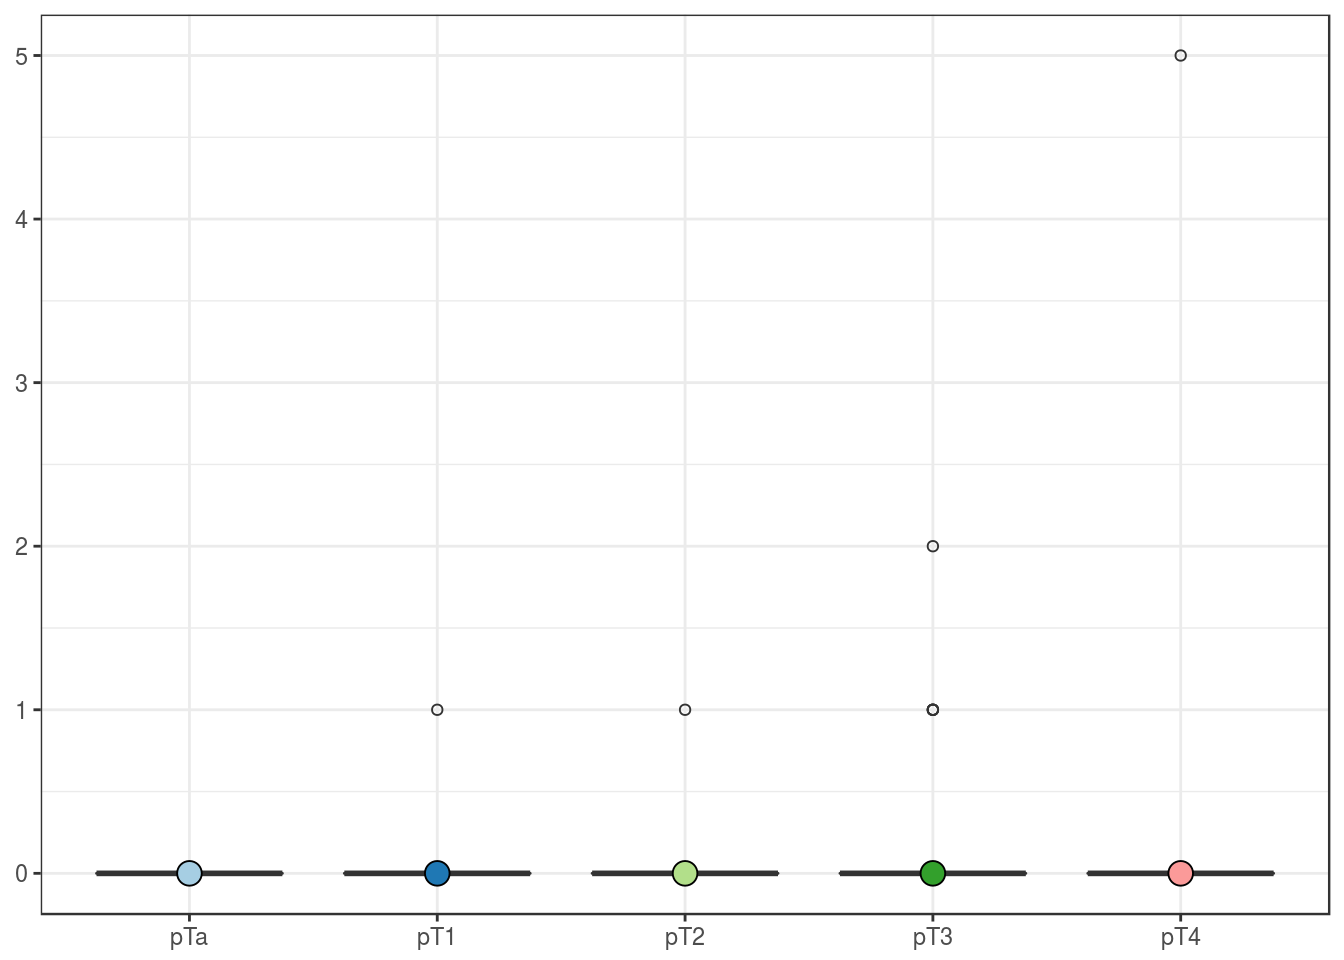
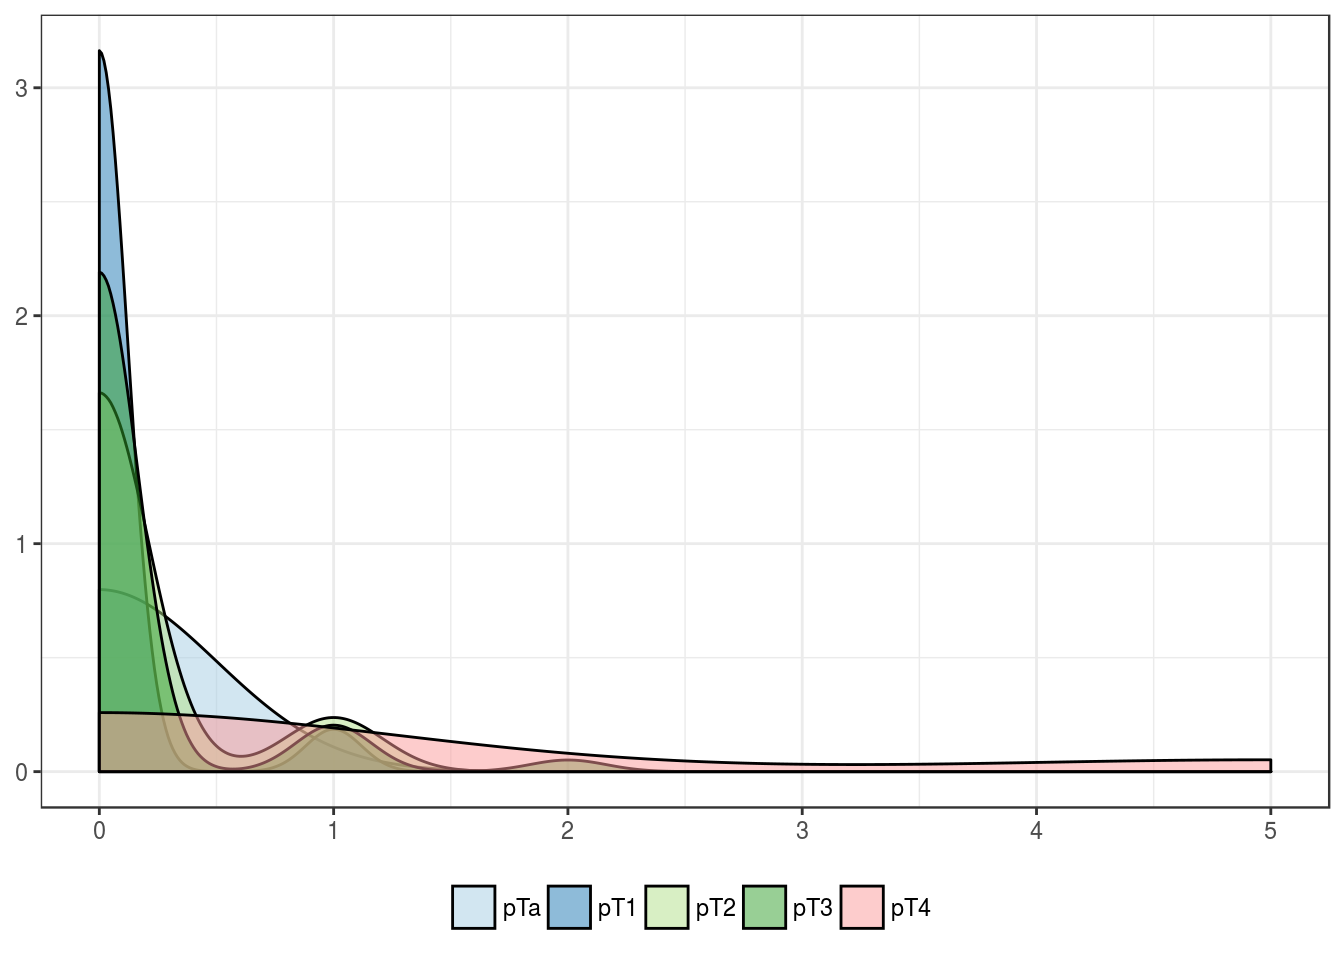
Expression by pT
| pTa | pT1 | pT2 | pT3 | pT4 | |
|---|---|---|---|---|---|
| Mean | 0 | 0.1 | 0.1 | 0.1 | 0.8 |
| Standard deviation | 0 | 0.2 | 0.4 | 0.4 | 2.0 |
| Median | 0 | 0.0 | 0.0 | 0.0 | 0.0 |
| Interquartile range | 0 | 0.0 | 0.0 | 0.0 | 0.0 |
| Minimum | 0 | 0.0 | 0.0 | 0.0 | 0.0 |
| Maximum | 0 | 1.0 | 1.0 | 2.0 | 5.0 |
| Value | |
|---|---|
| Statistic | 3.094 |
| Parameter | 4 |
| P statistic | 0.54 |
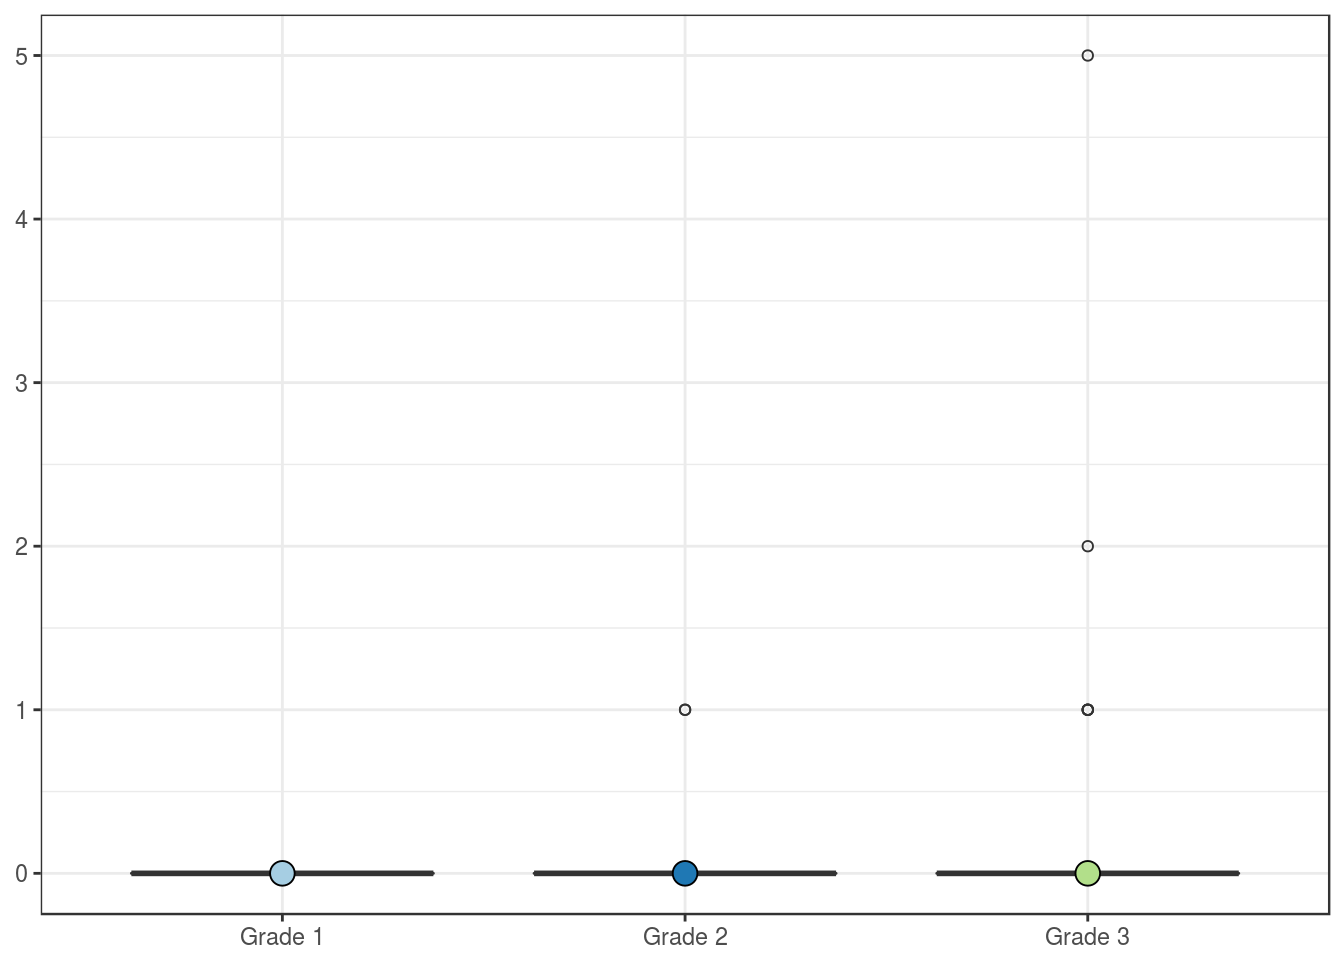
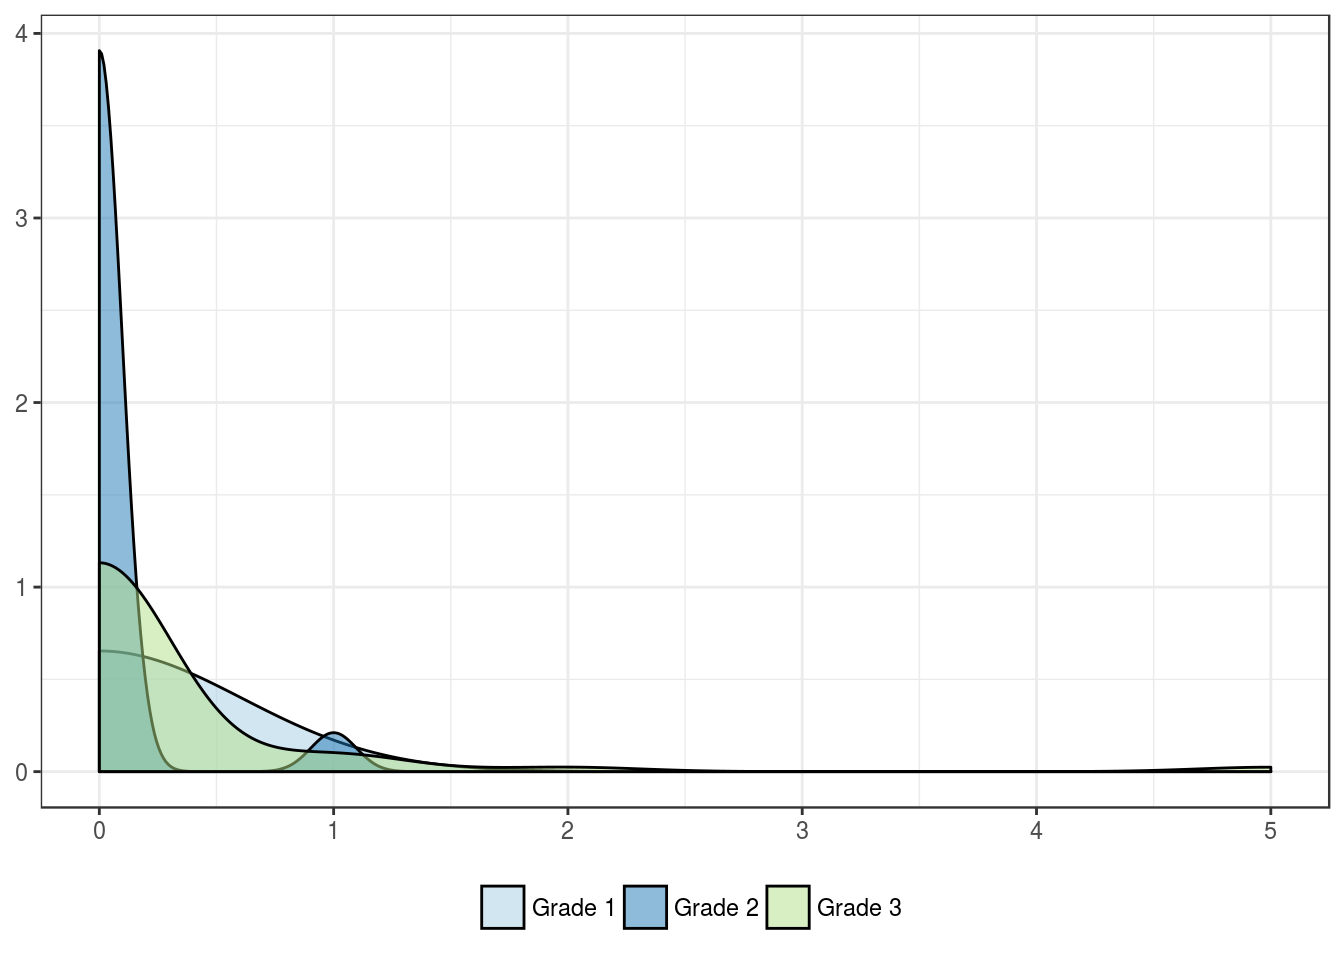
Expression by histologic grade
| Grade 1 | Grade 2 | Grade 3 | |
|---|---|---|---|
| Mean | 0 | 0.1 | 0.2 |
| Standard deviation | 0 | 0.2 | 0.8 |
| Median | 0 | 0.0 | 0.0 |
| Interquartile range | 0 | 0.0 | 0.0 |
| Minimum | 0 | 0.0 | 0.0 |
| Maximum | 0 | 1.0 | 5.0 |
| Value | |
|---|---|
| Statistic | 1.869 |
| Parameter | 2 |
| P statistic | 0.39 |
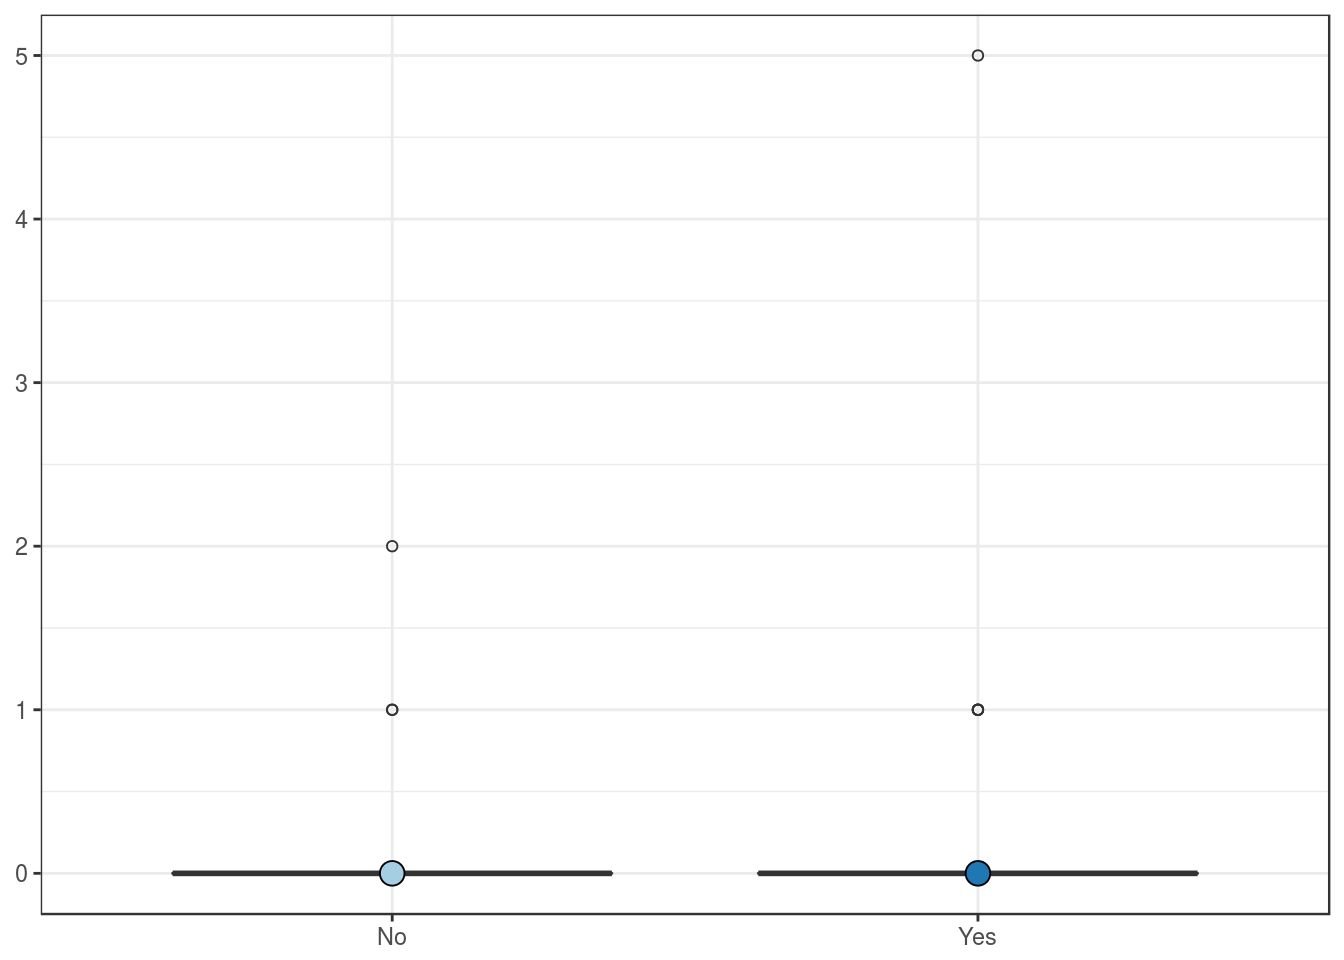
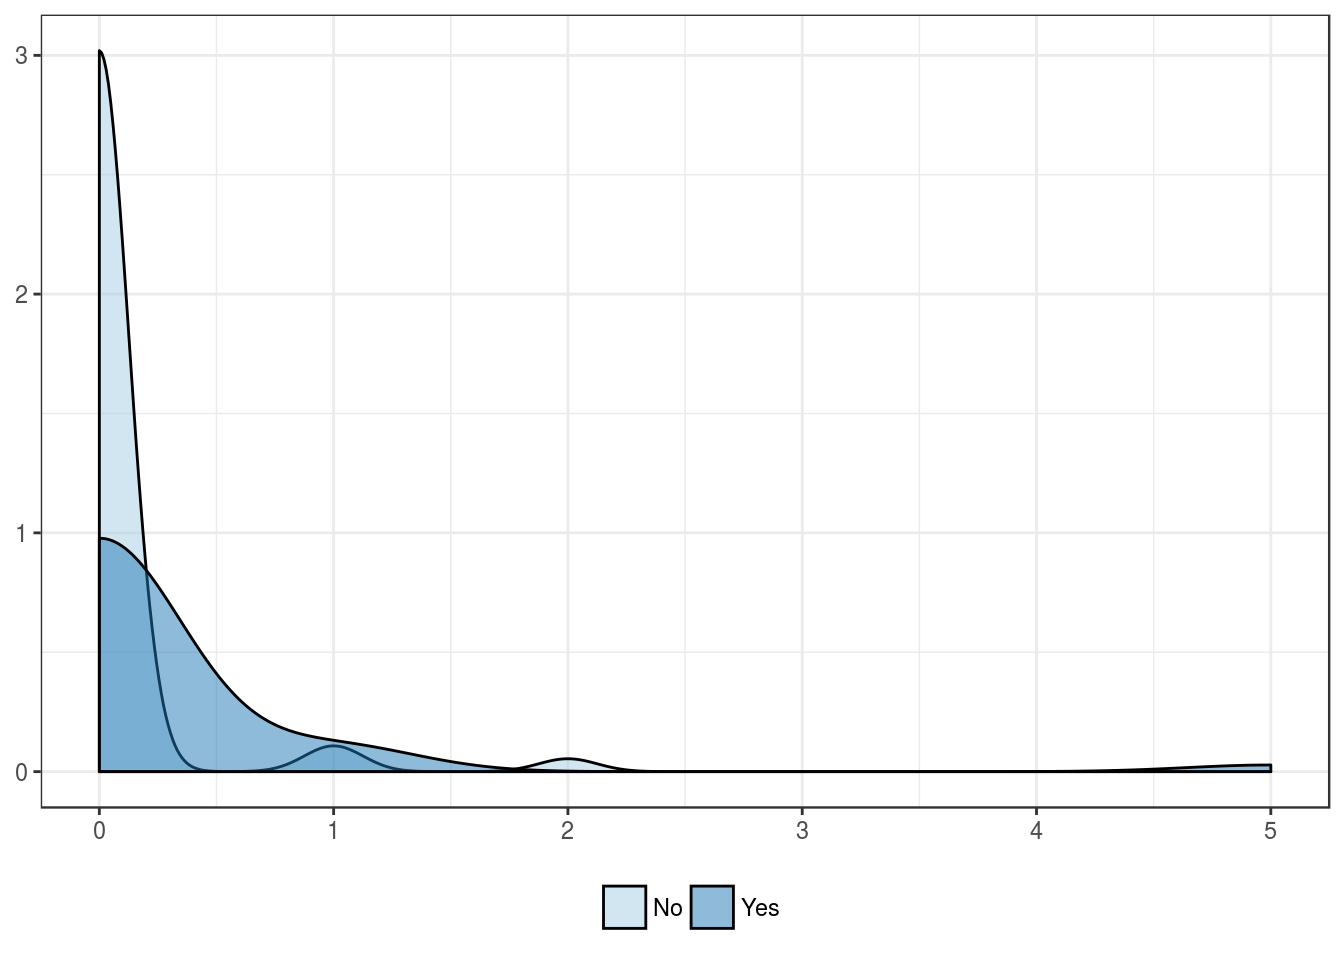
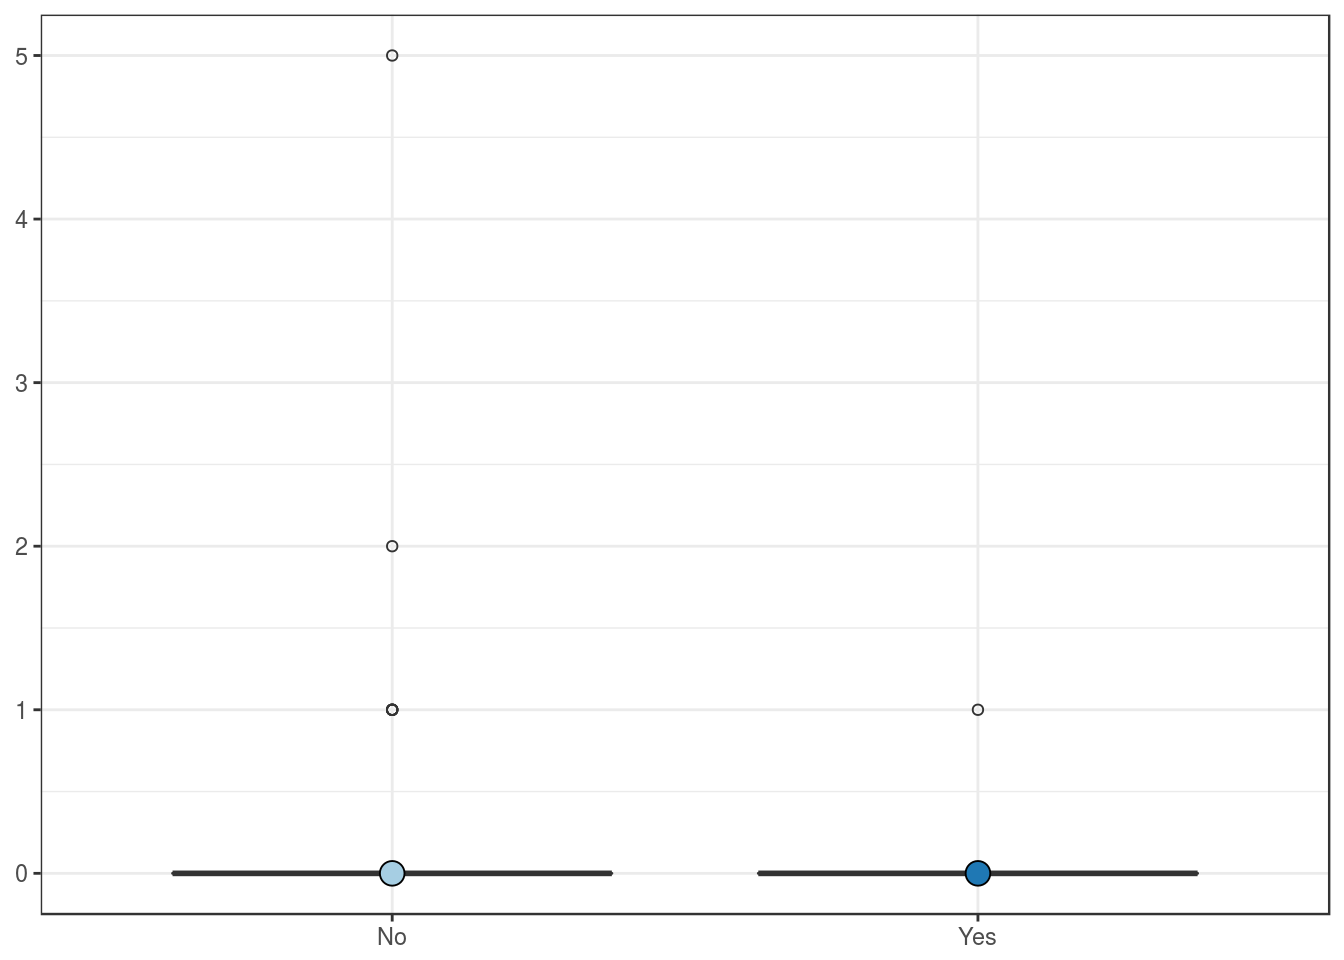
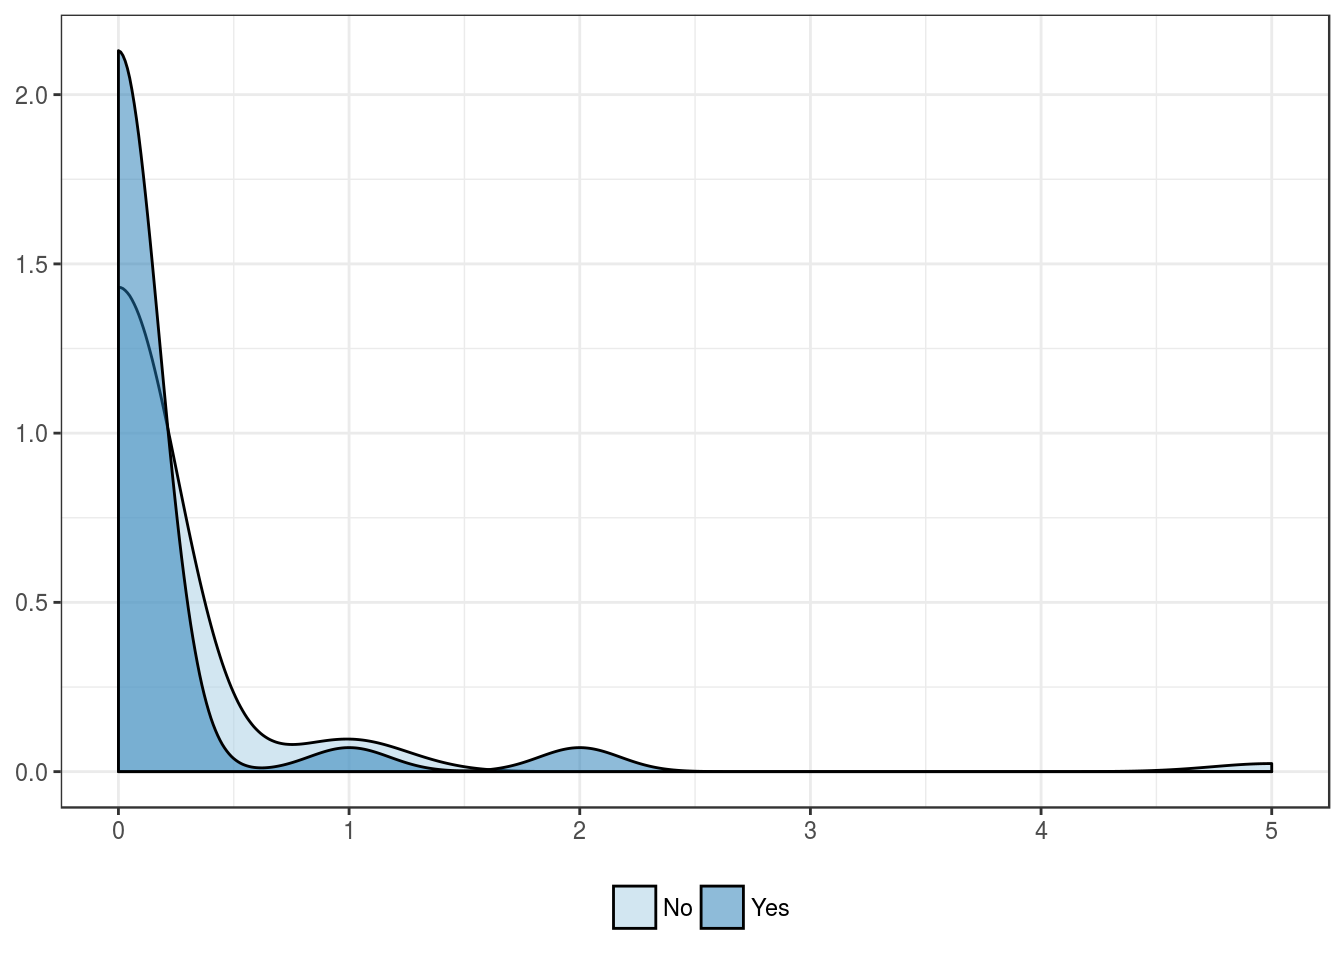
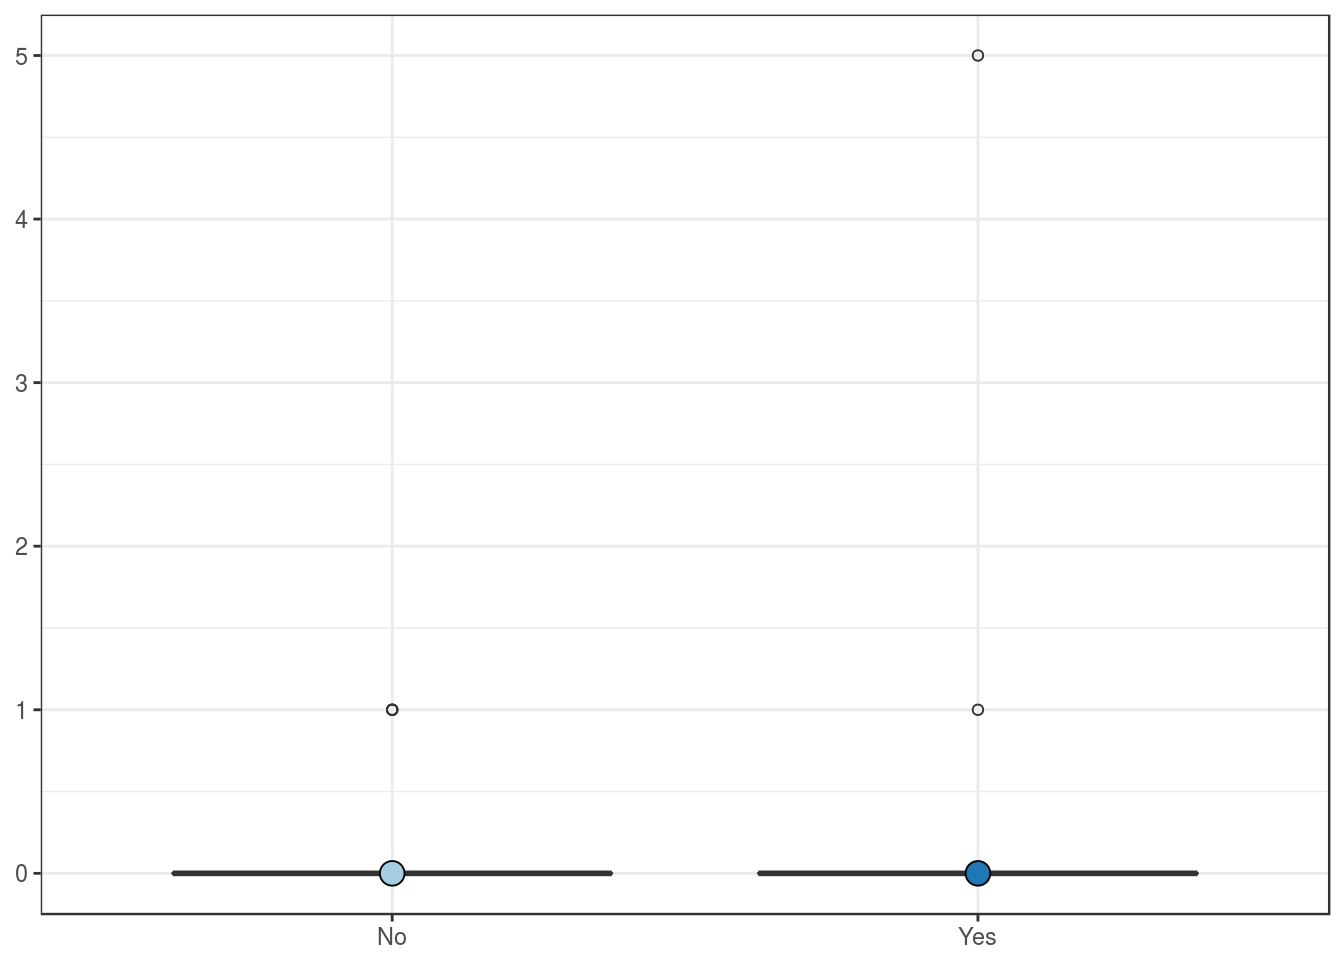
Expression by lymphovascular invasion
| No | Yes | |
|---|---|---|
| Mean | 0.1 | 0.2 |
| Standard deviation | 0.3 | 0.8 |
| Median | 0.0 | 0.0 |
| Interquartile range | 0.0 | 0.0 |
| Minimum | 0.0 | 0.0 |
| Maximum | 2.0 | 5.0 |
| Value | |
|---|---|
| U-statistic | 1093 |
| P statistic | 1.9e-01 |
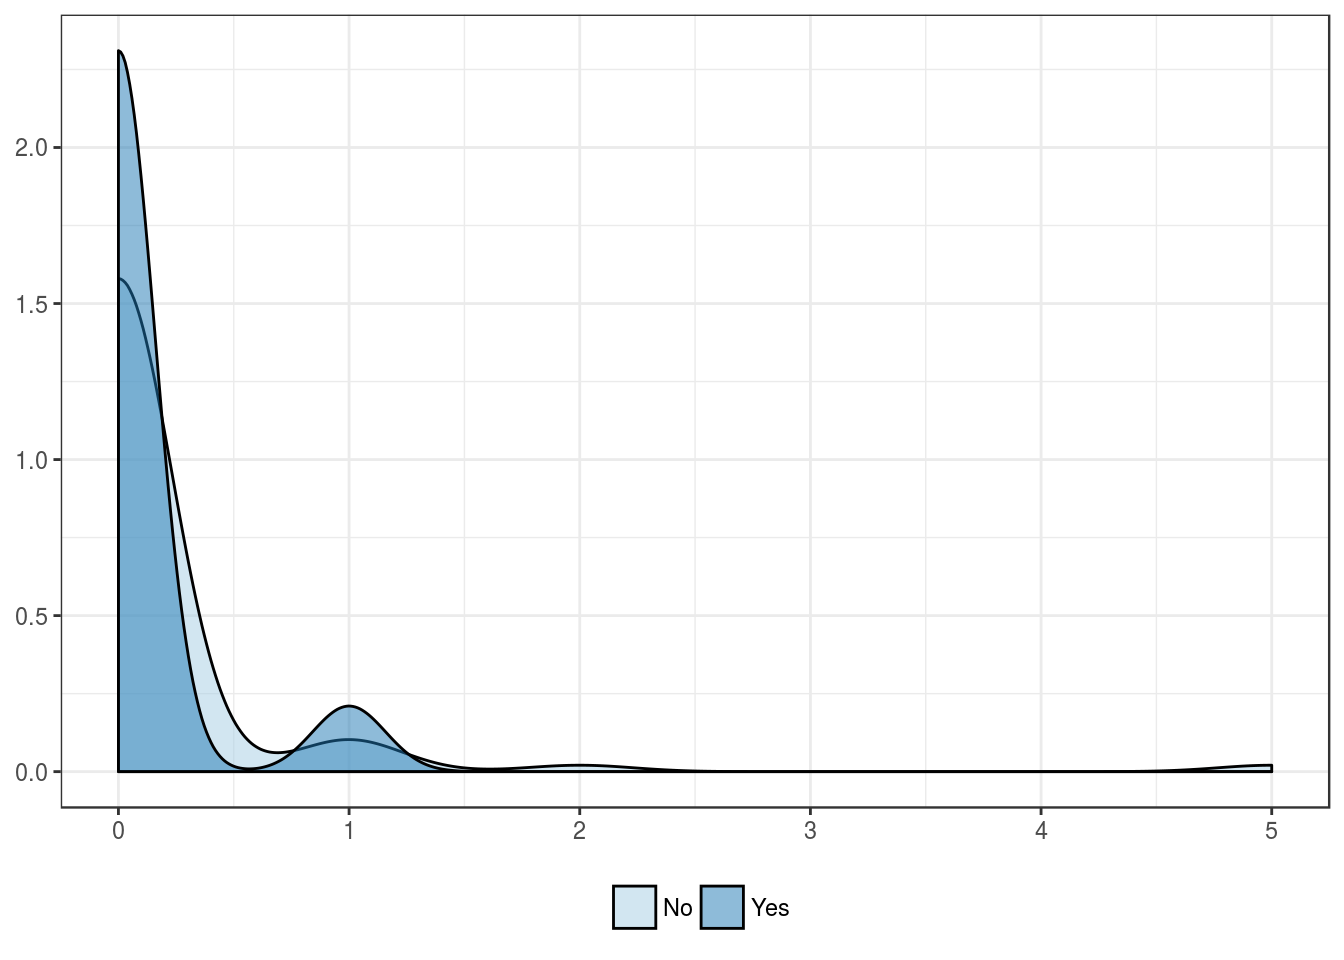
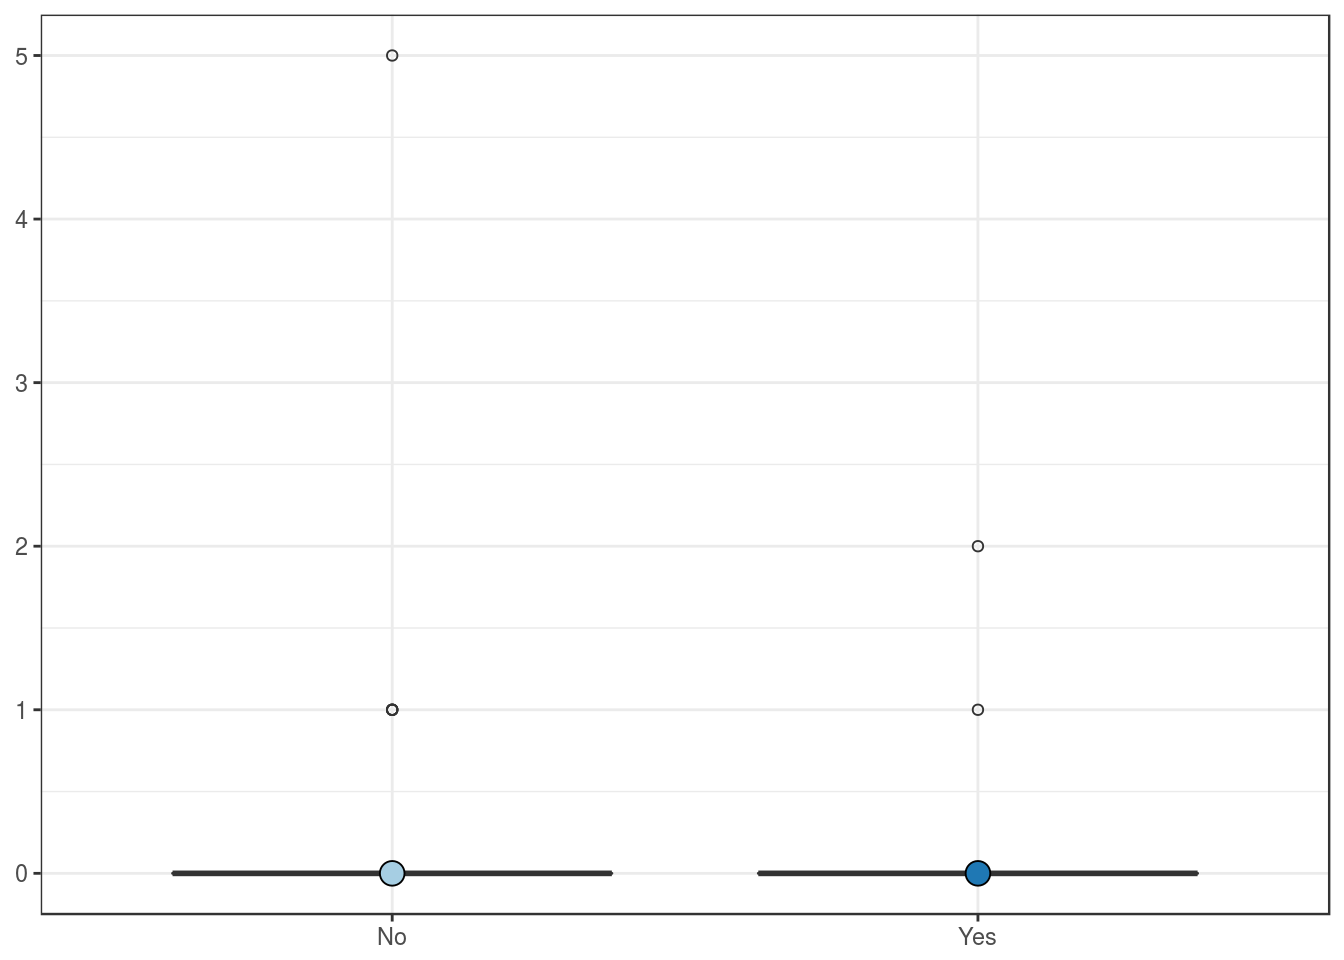
Expression by lymph node metastasis
| No | Yes | |
|---|---|---|
| Mean | 0.1 | 0.1 |
| Standard deviation | 0.6 | 0.3 |
| Median | 0.0 | 0.0 |
| Interquartile range | 0.0 | 0.0 |
| Minimum | 0.0 | 0.0 |
| Maximum | 5.0 | 1.0 |
| Value | |
|---|---|
| U-statistic | 505 |
| P statistic | 9.9e-01 |
Outcome features
Expression by bladder recurrence
| No | Yes | |
|---|---|---|
| Mean | 0.1 | 0.1 |
| Standard deviation | 0.7 | 0.4 |
| Median | 0.0 | 0.0 |
| Interquartile range | 0.0 | 0.0 |
| Minimum | 0.0 | 0.0 |
| Maximum | 5.0 | 2.0 |
| Value | |
|---|---|
| U-statistic | 1054 |
| P statistic | 8.2e-01 |
Expression by tumor progression
| No | Yes | |
|---|---|---|
| Mean | 0.1 | 0.1 |
| Standard deviation | 0.3 | 0.7 |
| Median | 0.0 | 0.0 |
| Interquartile range | 0.0 | 0.0 |
| Minimum | 0.0 | 0.0 |
| Maximum | 1.0 | 5.0 |
| Value | |
|---|---|
| U-statistic | 871 |
| P statistic | 4e-01 |
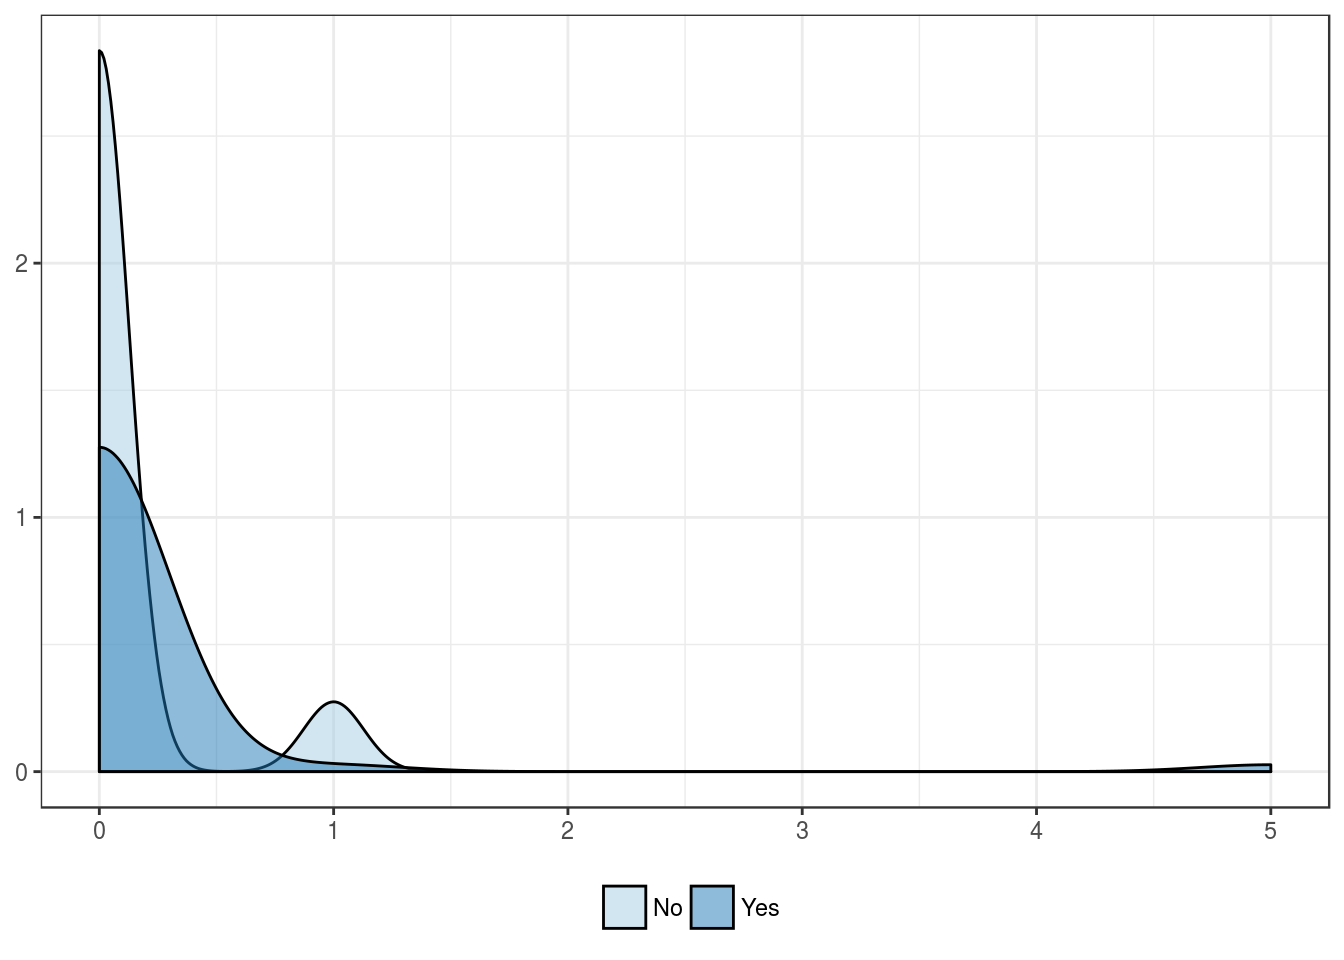
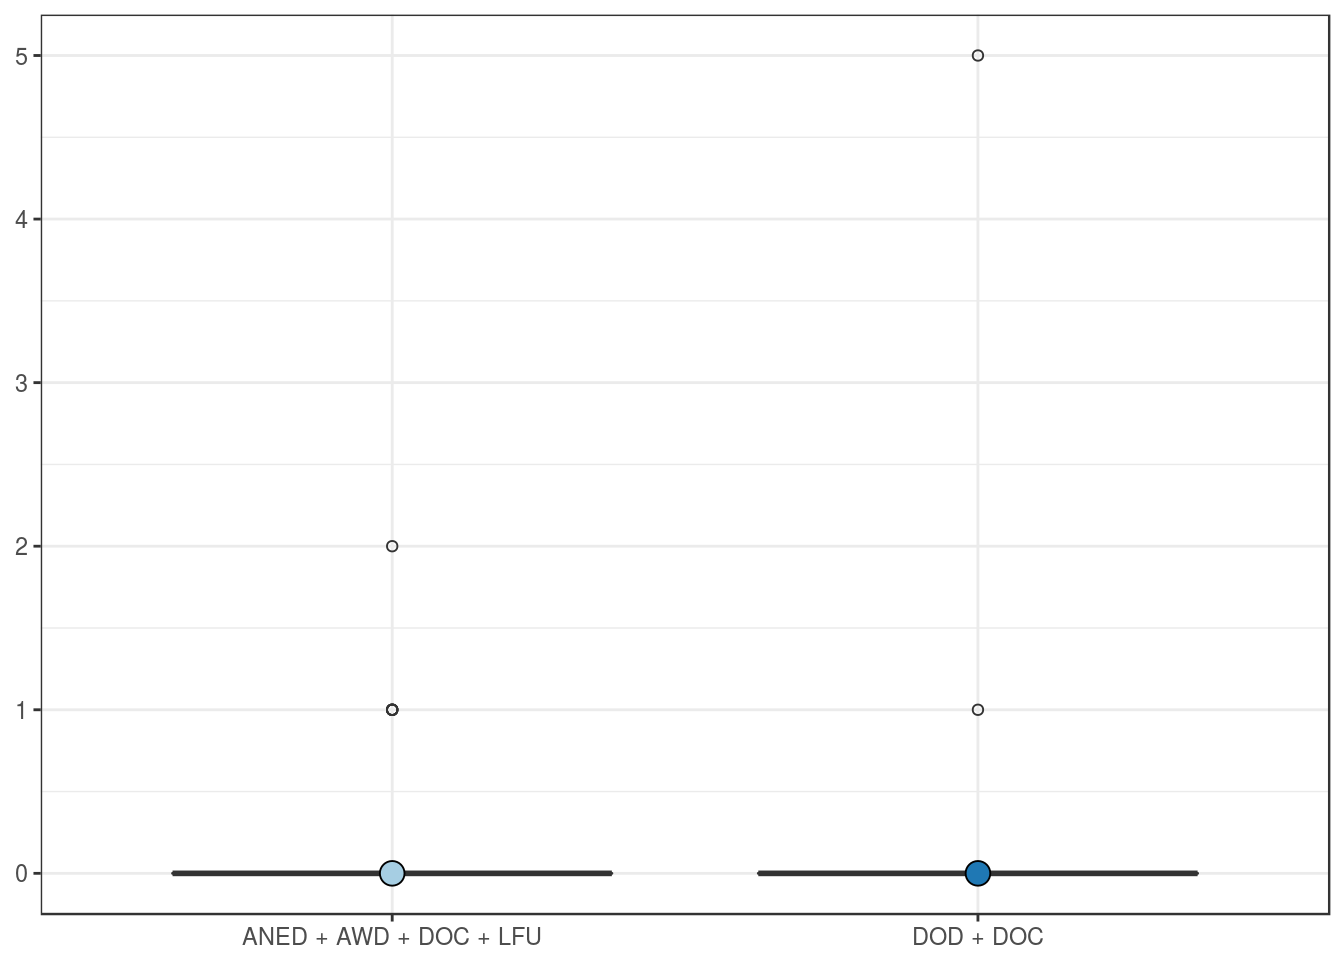
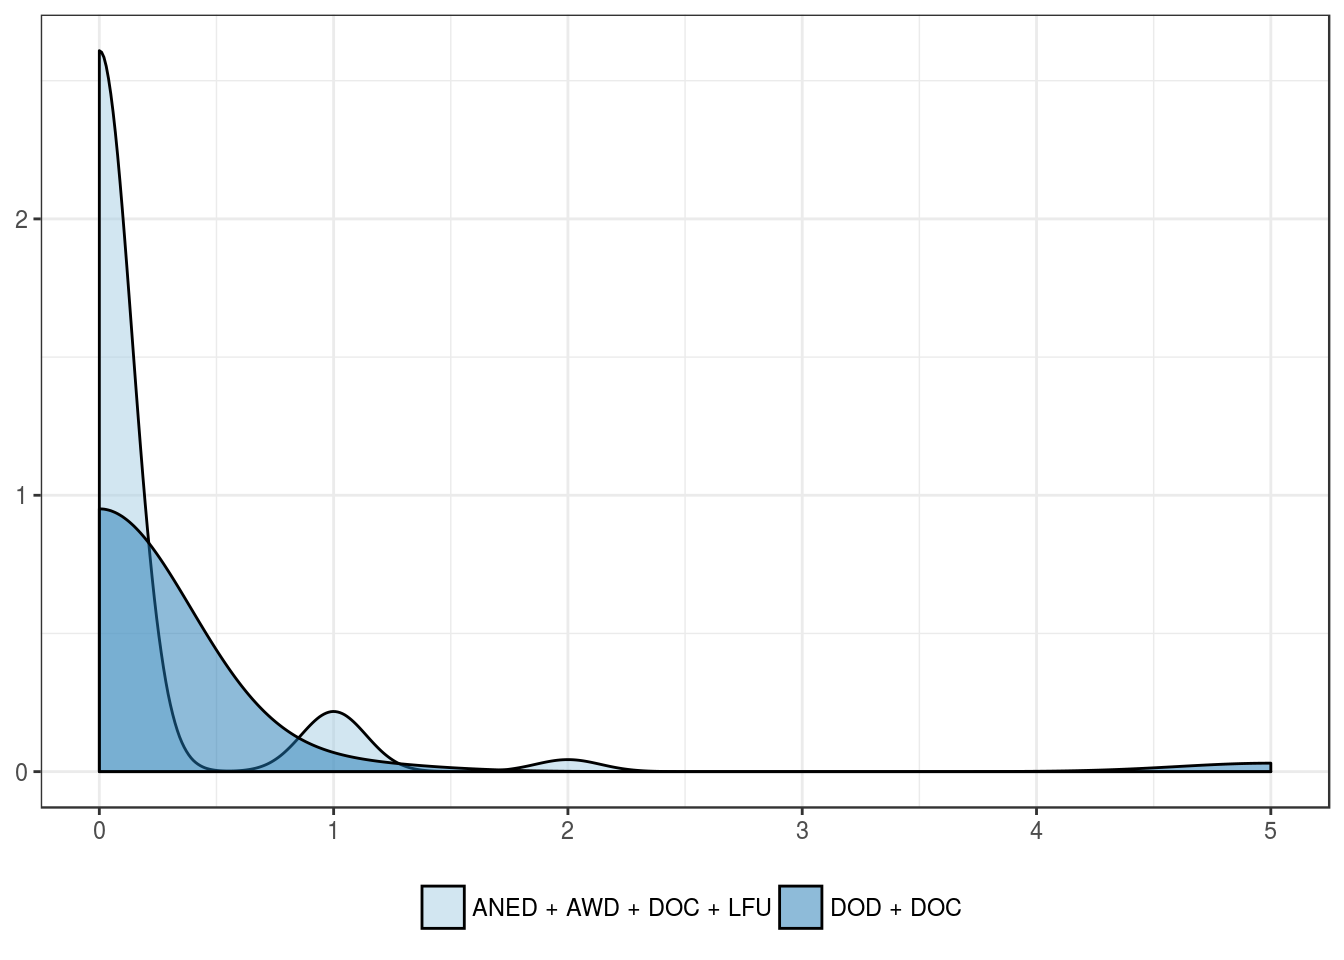
Expression by overall mortality
| ANED + AWD + DOC + LFU | DOD + DOC | |
|---|---|---|
| Mean | 0.1 | 0.2 |
| Standard deviation | 0.4 | 0.9 |
| Median | 0.0 | 0.0 |
| Interquartile range | 0.0 | 0.0 |
| Minimum | 0.0 | 0.0 |
| Maximum | 2.0 | 5.0 |
| Value | |
|---|---|
| U-statistic | 1120 |
| P statistic | 6.4e-01 |
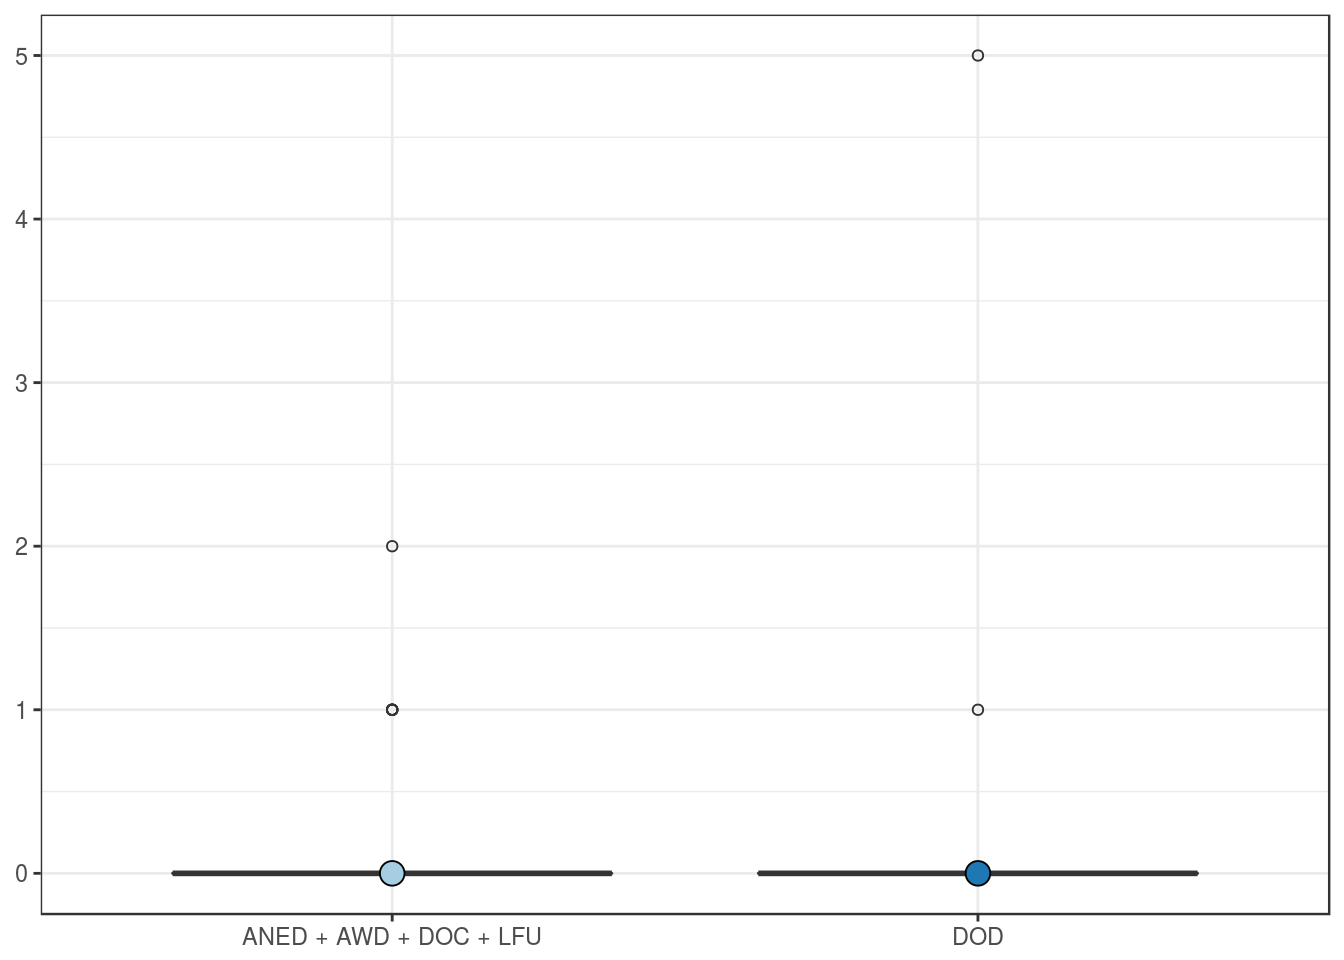
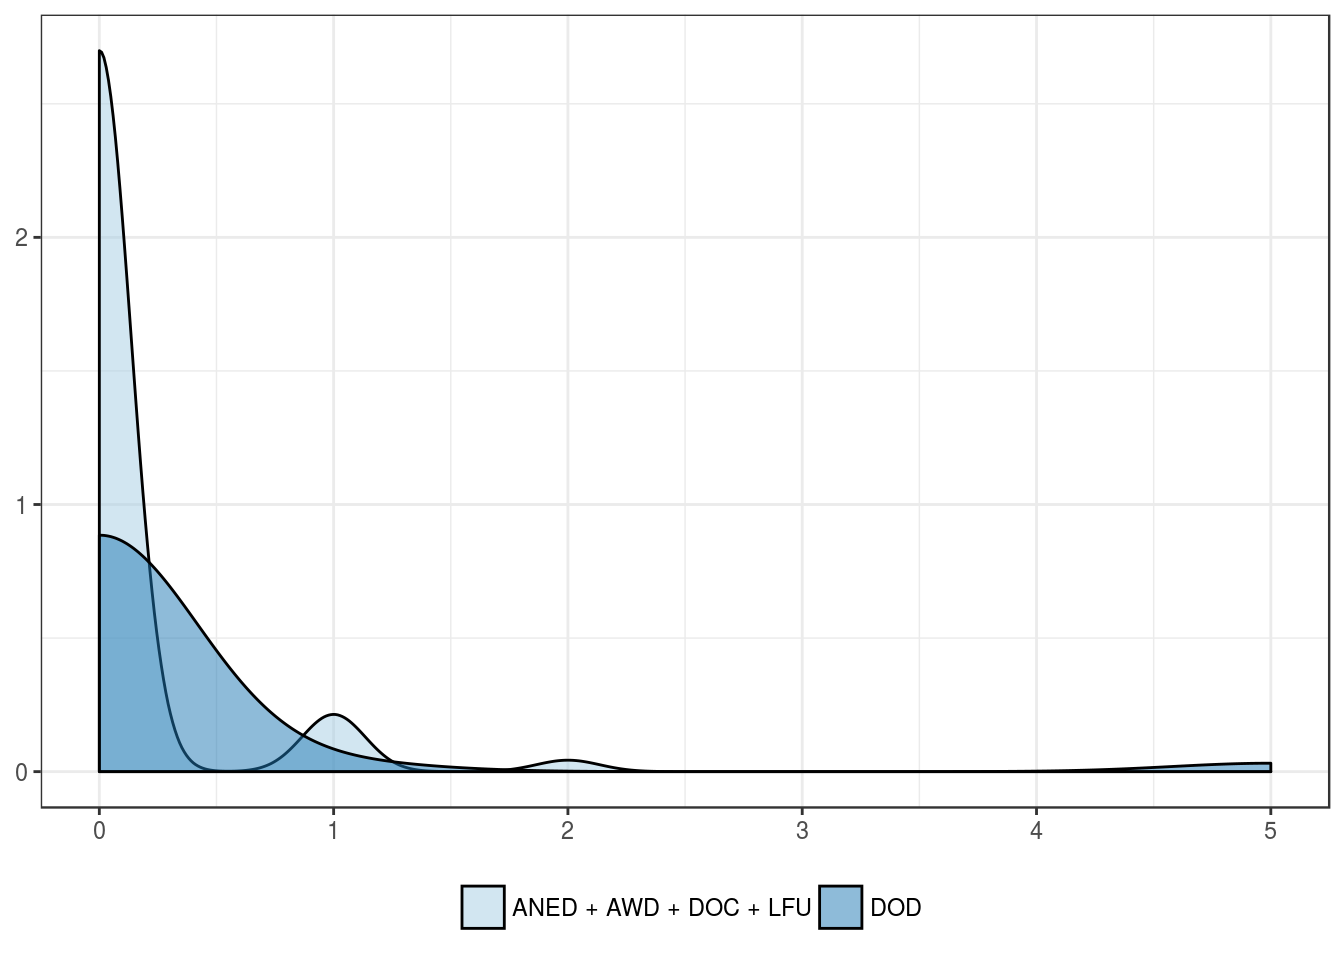
Expression by cancer-related mortality
| ANED + AWD + DOC + LFU | DOD | |
|---|---|---|
| Mean | 0.1 | 0.2 |
| Standard deviation | 0.3 | 0.9 |
| Median | 0.0 | 0.0 |
| Interquartile range | 0.0 | 0.0 |
| Minimum | 0.0 | 0.0 |
| Maximum | 2.0 | 5.0 |
| Value | |
|---|---|
| U-statistic | 1054 |
| P statistic | 7.7e-01 |