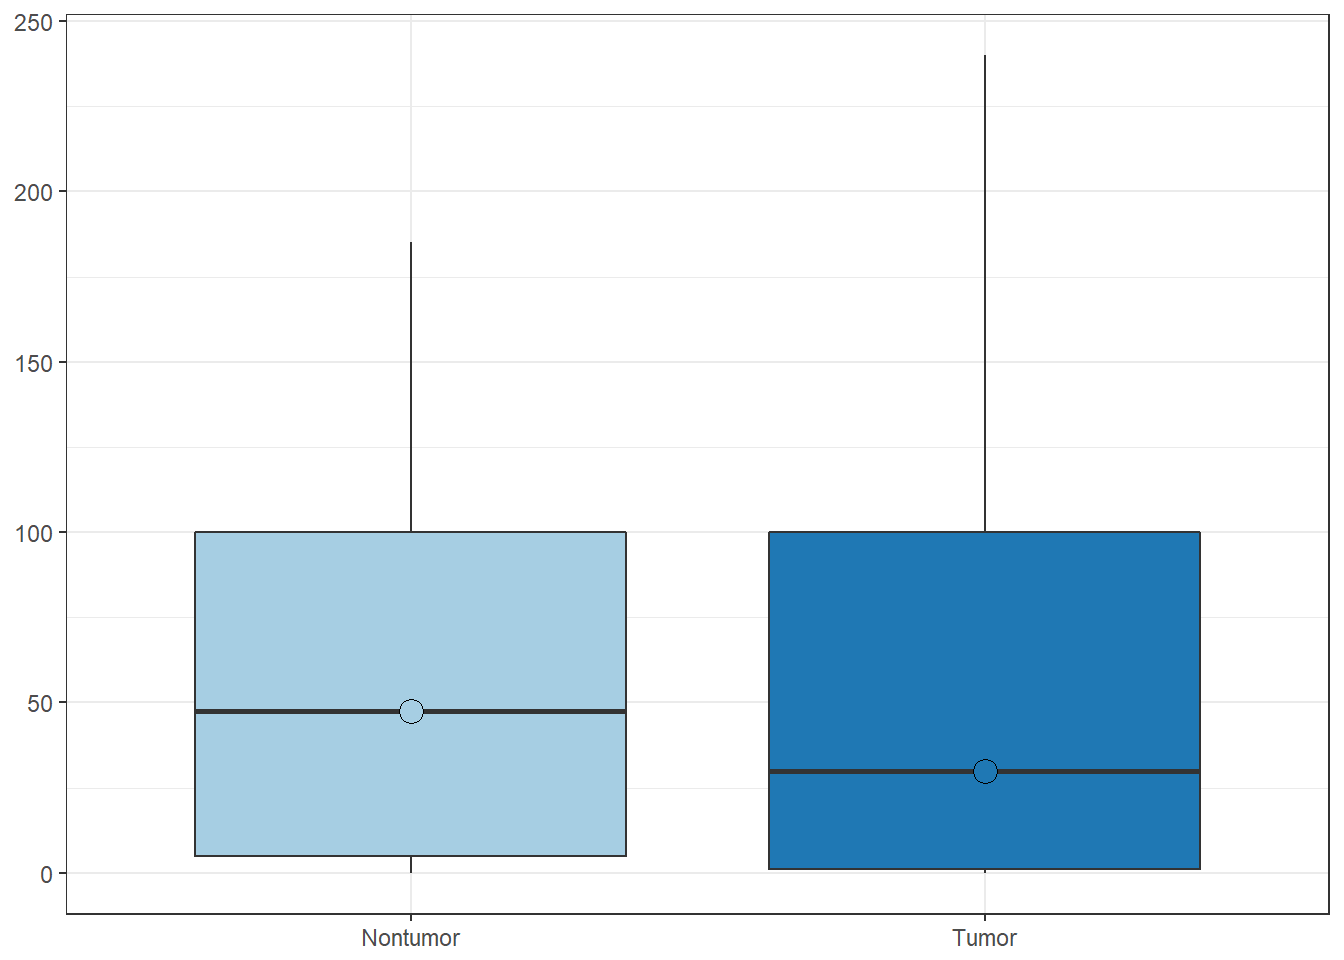
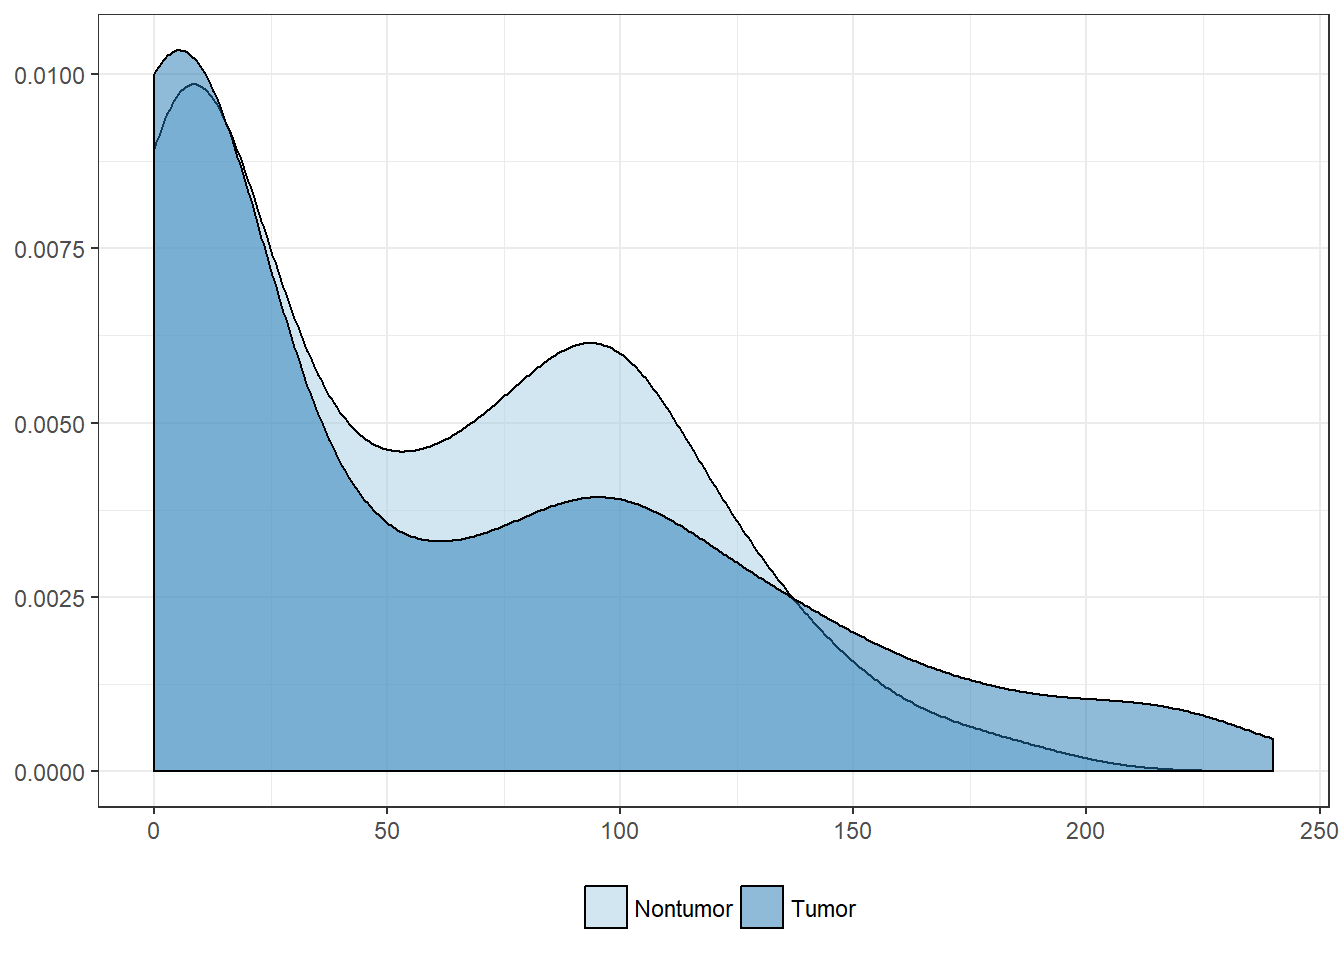
IGF1R expression by tissue type
H-score expression
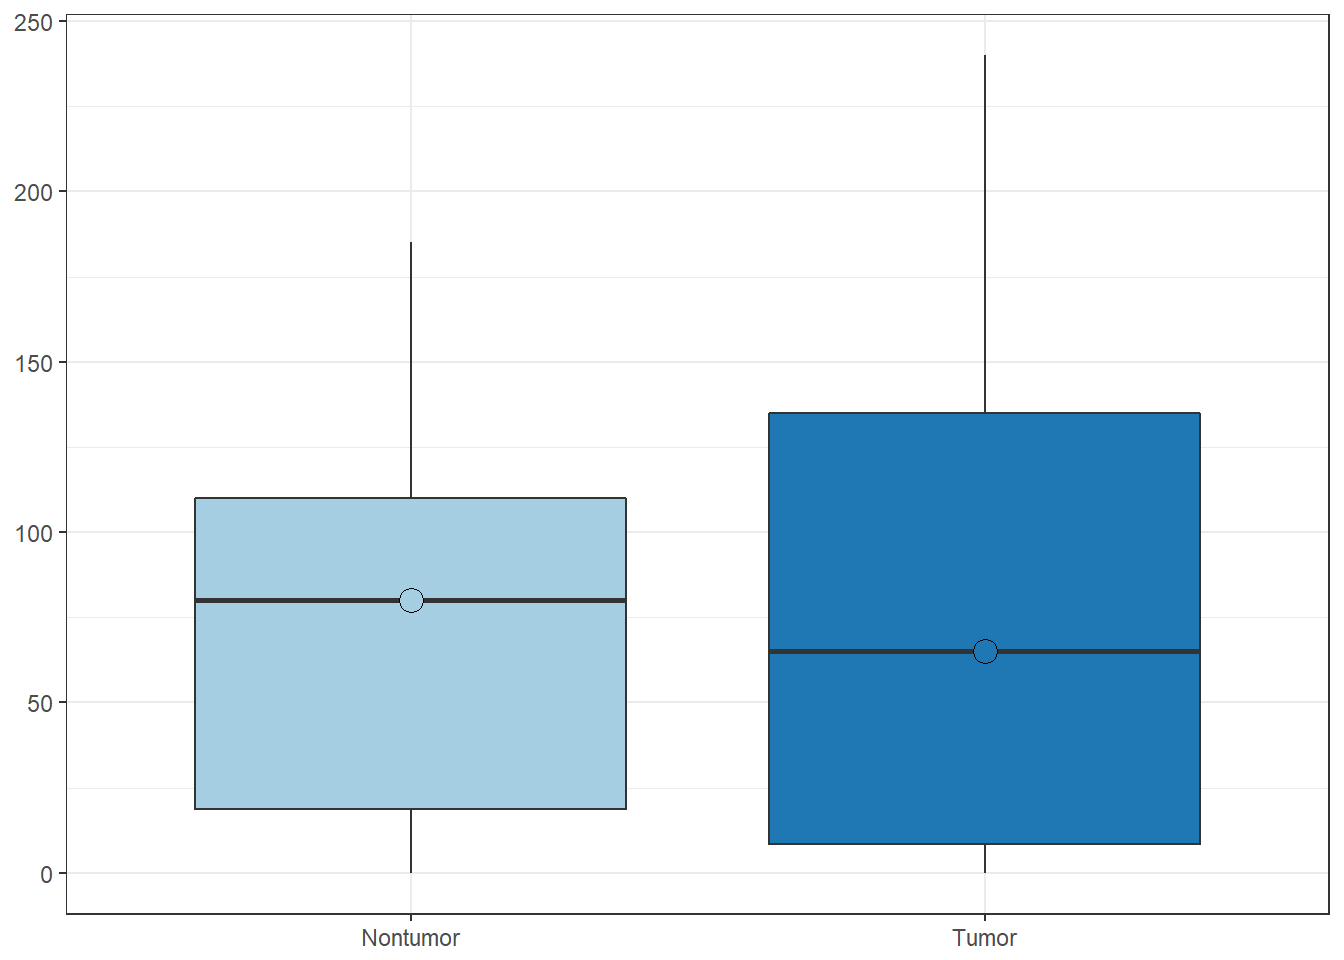
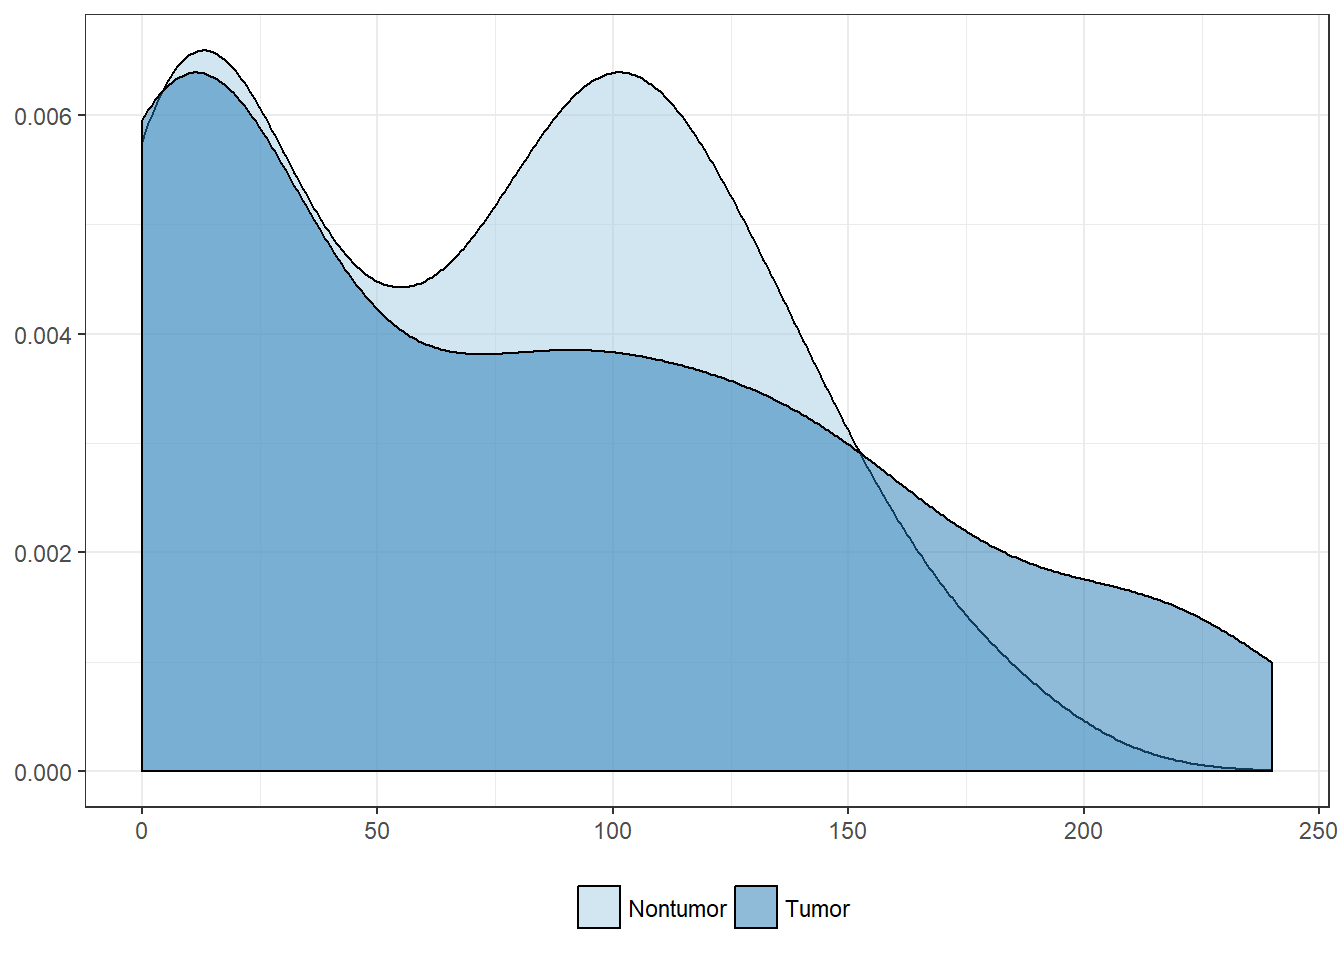
All values
| Nontumor | Tumor | |
|---|---|---|
| Mean | 55.2 | 56.9 |
| Standard deviation | 48.6 | 63.8 |
| Median | 47.5 | 30.0 |
| Interquartile range | 95.0 | 99.0 |
| Minimum | 0.0 | 0.0 |
| Maximum | 185.0 | 240.0 |
| Value | |
|---|---|
| U-statistic | 26047 |
| P statistic | 1.3e-01 |
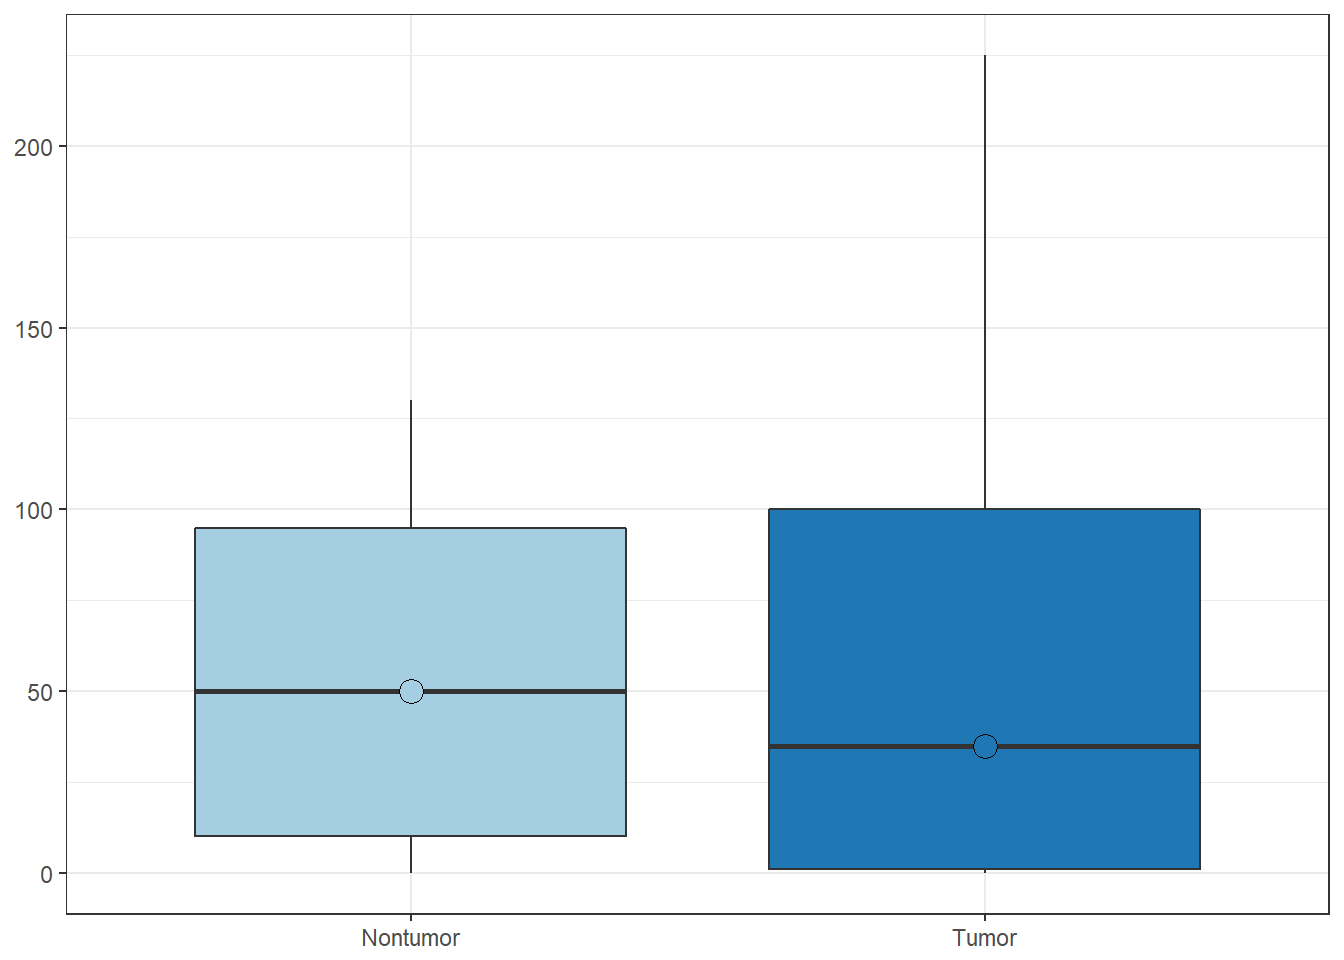
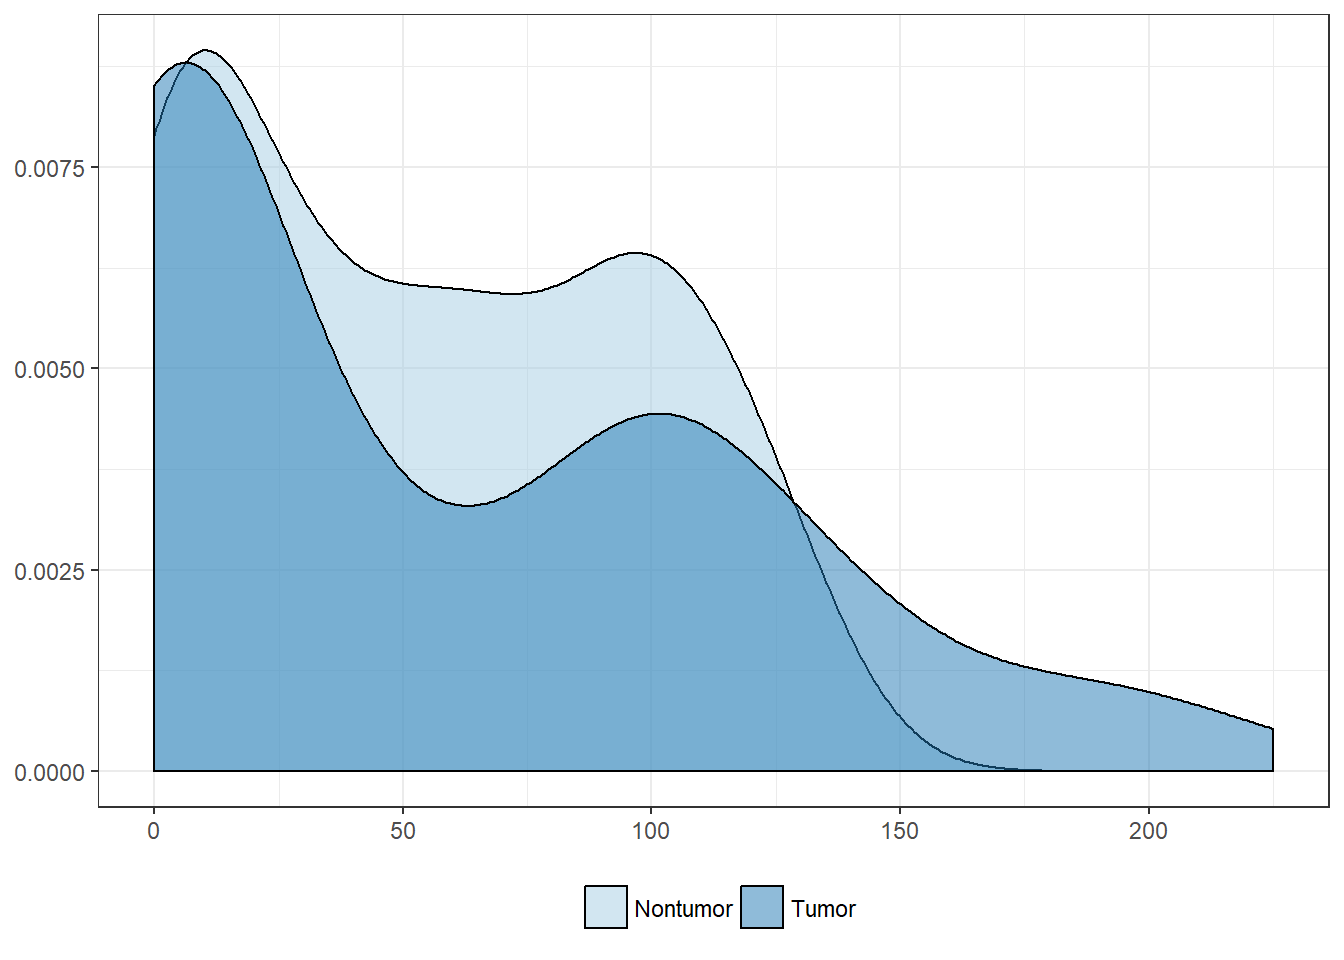
Median values
| Nontumor | Tumor | |
|---|---|---|
| Mean | 53.3 | 57.3 |
| Standard deviation | 42.4 | 61.5 |
| Median | 50.0 | 35.0 |
| Interquartile range | 85.0 | 99.0 |
| Minimum | 0.0 | 0.0 |
| Maximum | 130.0 | 225.0 |
| Value | |
|---|---|
| U-statistic | 4228 |
| P statistic | 4.4e-01 |
Maximum values
| Nontumor | Tumor | |
|---|---|---|
| Mean | -Inf | 77.2 |
| Standard deviation | NaN | 71.3 |
| Median | 45.0 | 65.0 |
| Interquartile range | 98.8 | 126.5 |
| Minimum | -Inf | 0.0 |
| Maximum | 185.0 | 240.0 |
| Value | |
|---|---|
| U-statistic | 4001 |
| P statistic | 9.1e-01 |
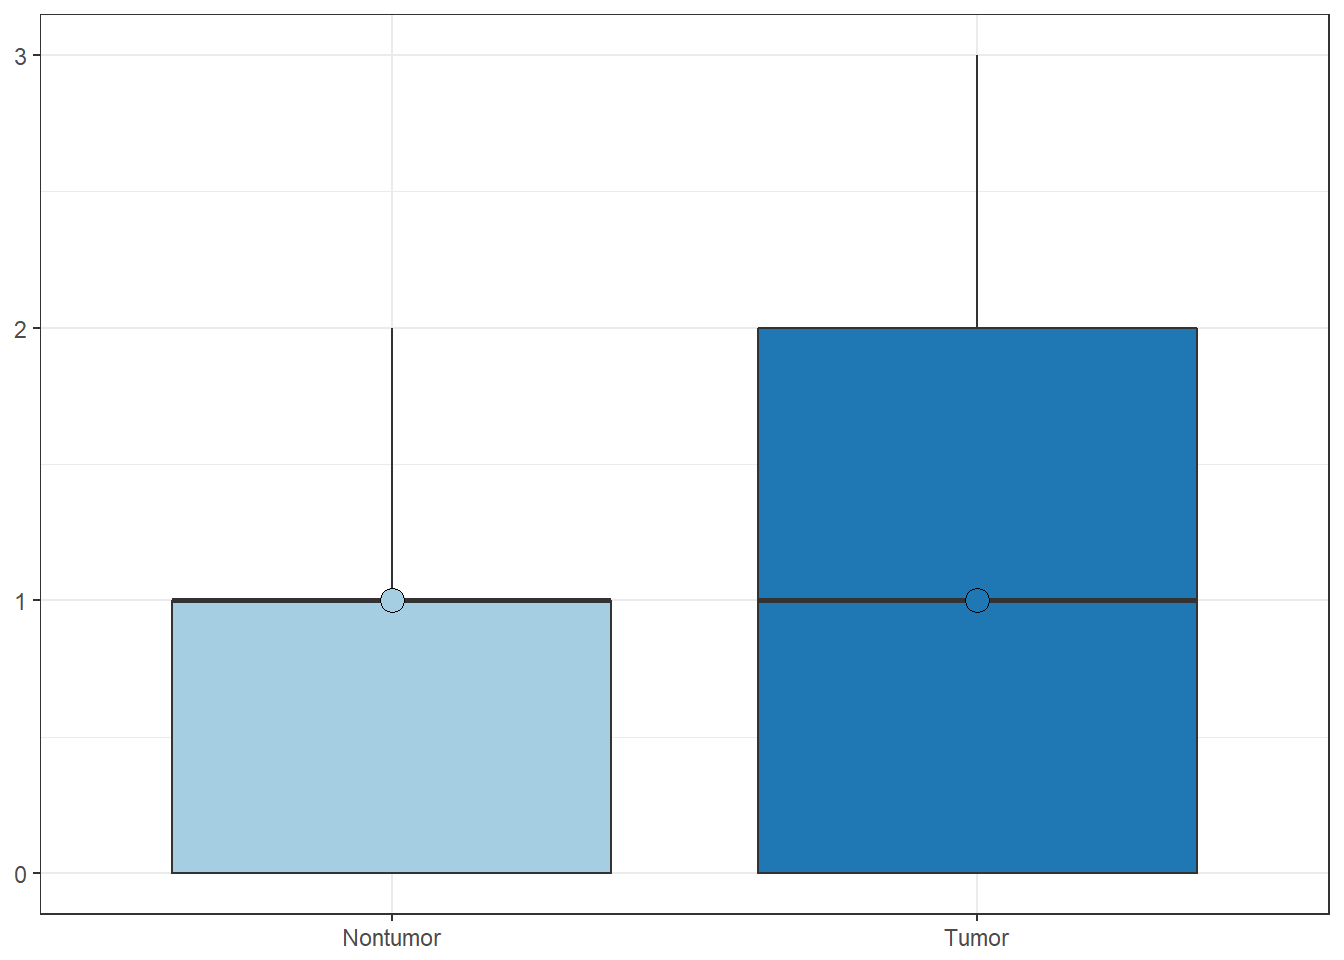
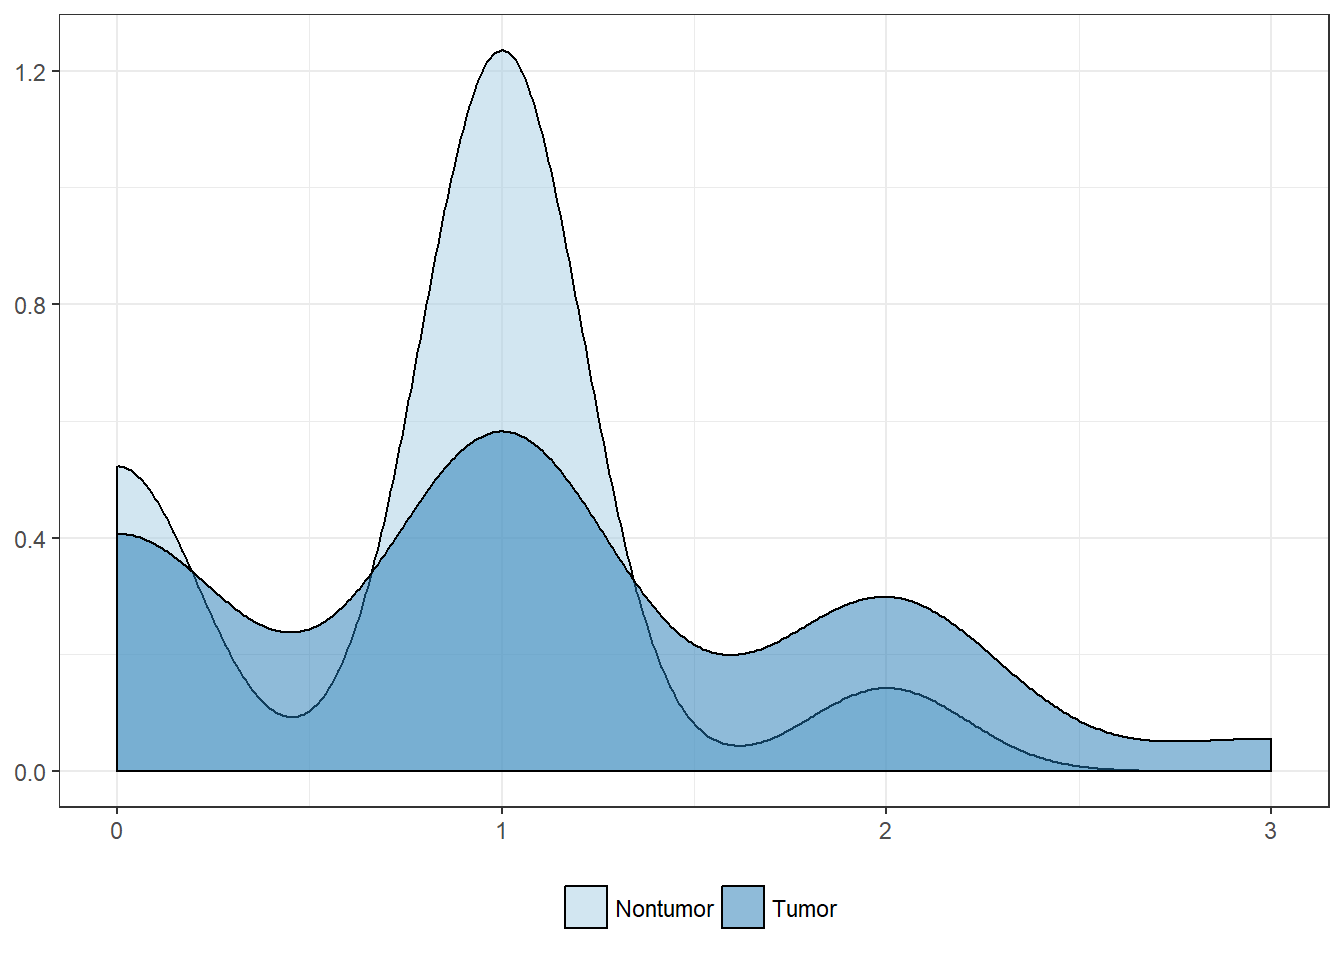
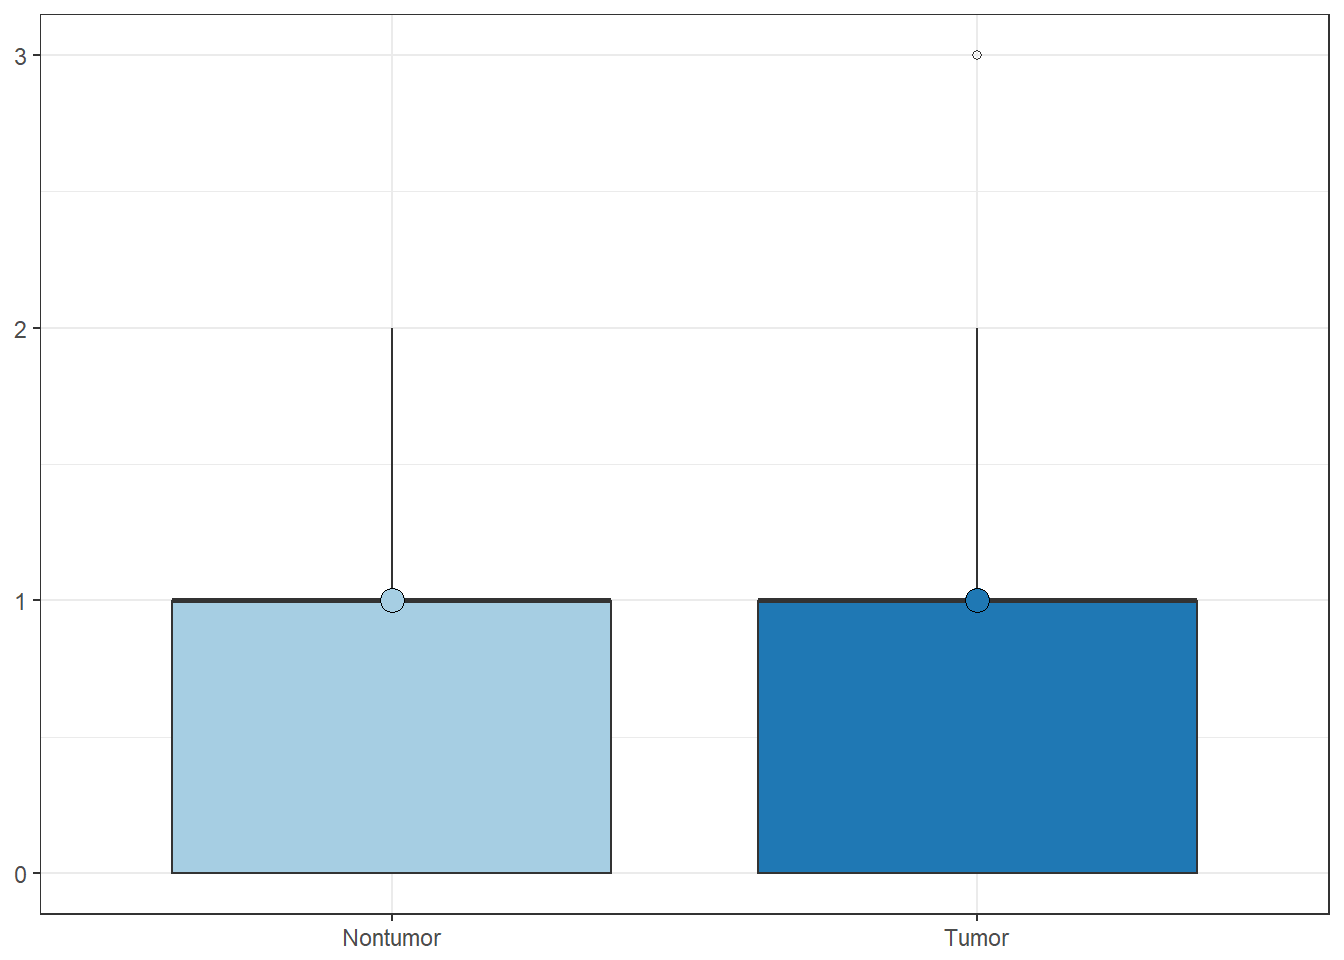
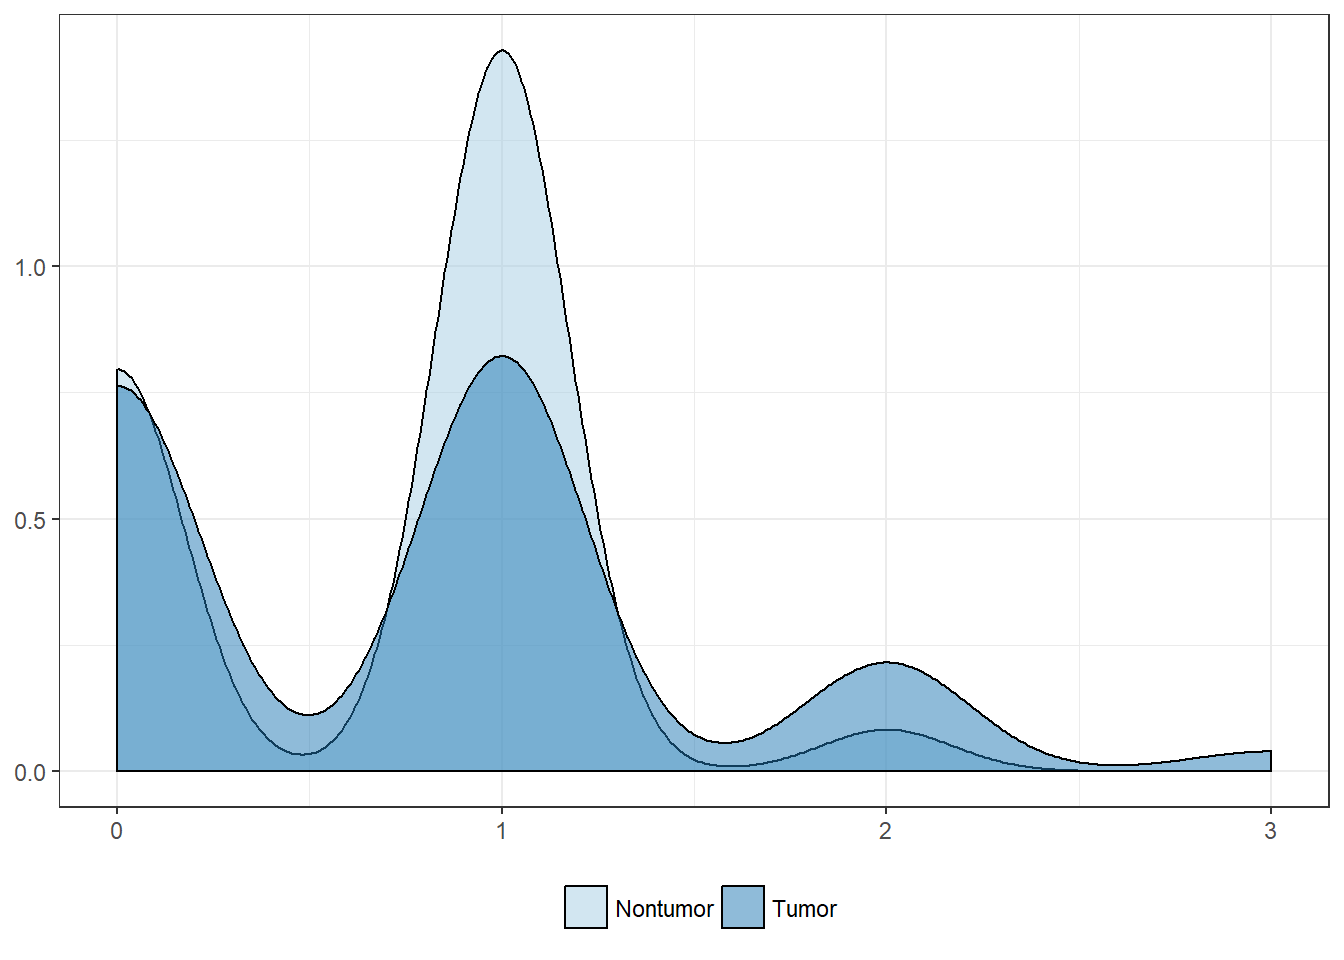
HER2 system expression
All values
| Nontumor | Tumor | |
|---|---|---|
| Mean | 0.7 | 0.7 |
| Standard deviation | 0.5 | 0.7 |
| Median | 1.0 | 1.0 |
| Interquartile range | 1.0 | 1.0 |
| Minimum | 0.0 | 0.0 |
| Maximum | 2.0 | 3.0 |
| Value | |
|---|---|
| U-statistic | 23670 |
| P statistic | 9.9e-01 |
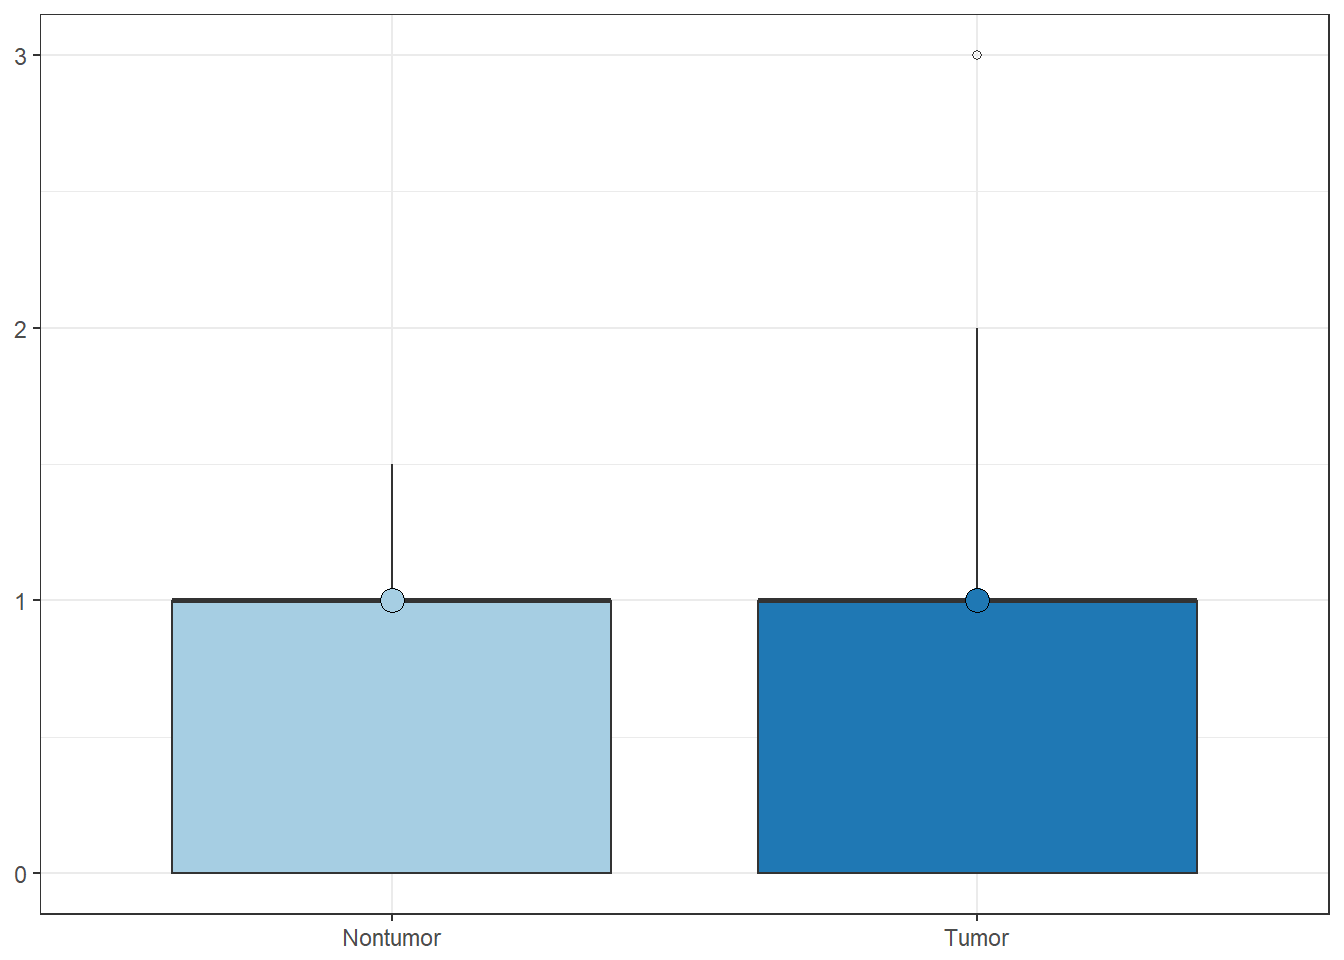
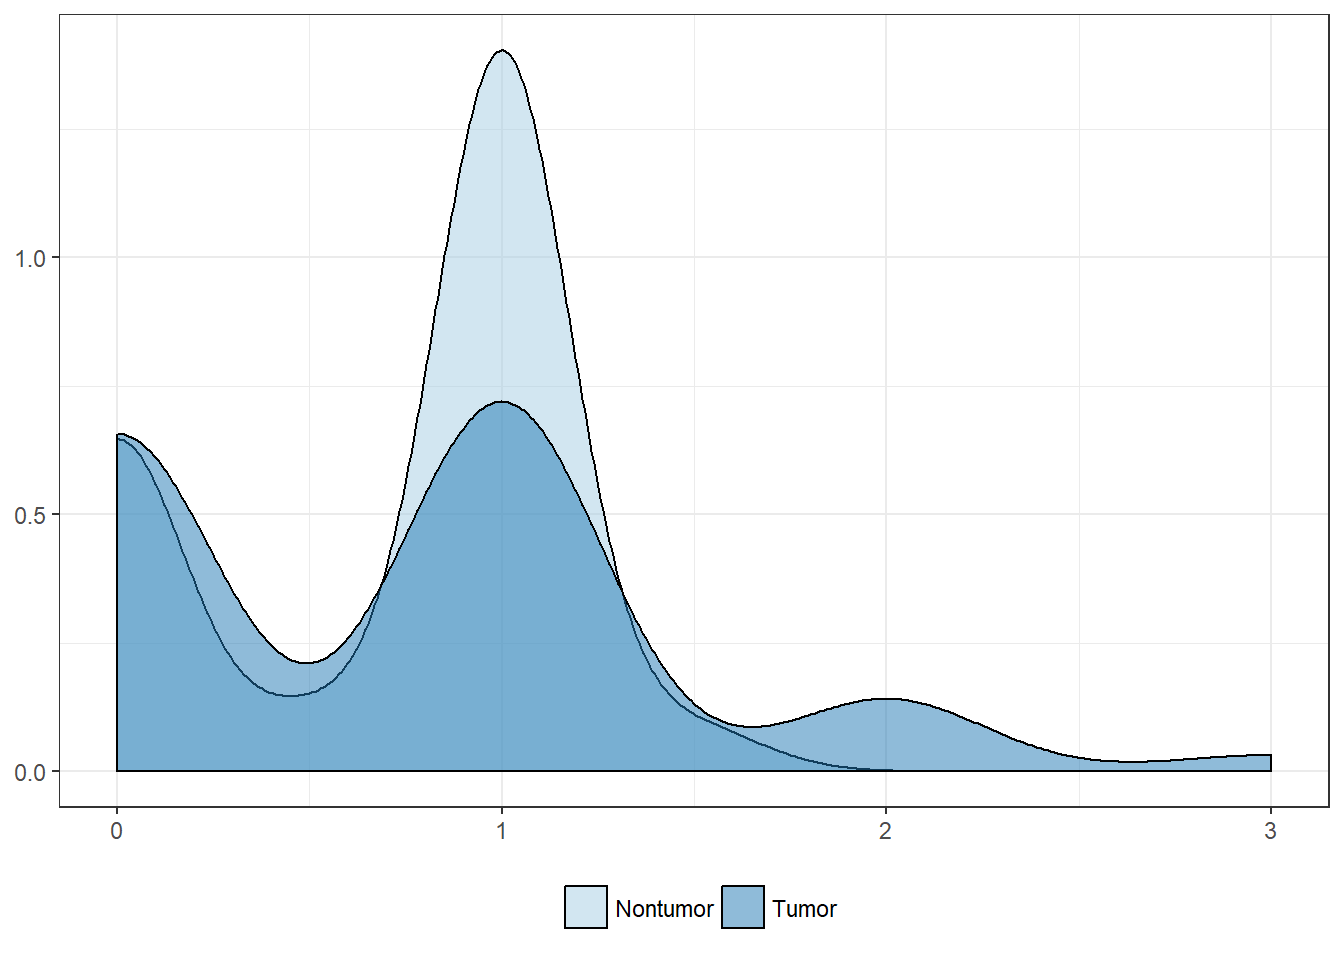
Median values
| Nontumor | Tumor | |
|---|---|---|
| Mean | 0.7 | 0.7 |
| Standard deviation | 0.5 | 0.7 |
| Median | 1.0 | 1.0 |
| Interquartile range | 1.0 | 1.0 |
| Minimum | 0.0 | 0.0 |
| Maximum | 1.5 | 3.0 |
| Value | |
|---|---|
| U-statistic | 4165 |
| P statistic | 5.1e-01 |
Maximum values
| Nontumor | Tumor | |
|---|---|---|
| Mean | -Inf | 1.0 |
| Standard deviation | NaN | 0.8 |
| Median | 1 | 1.0 |
| Interquartile range | 1 | 2.0 |
| Minimum | -Inf | 0.0 |
| Maximum | 2 | 3.0 |
| Value | |
|---|---|
| U-statistic | 3512 |
| P statistic | 1.5e-01 |