IFG1R maximum H-scores by cohort features
Clinical features
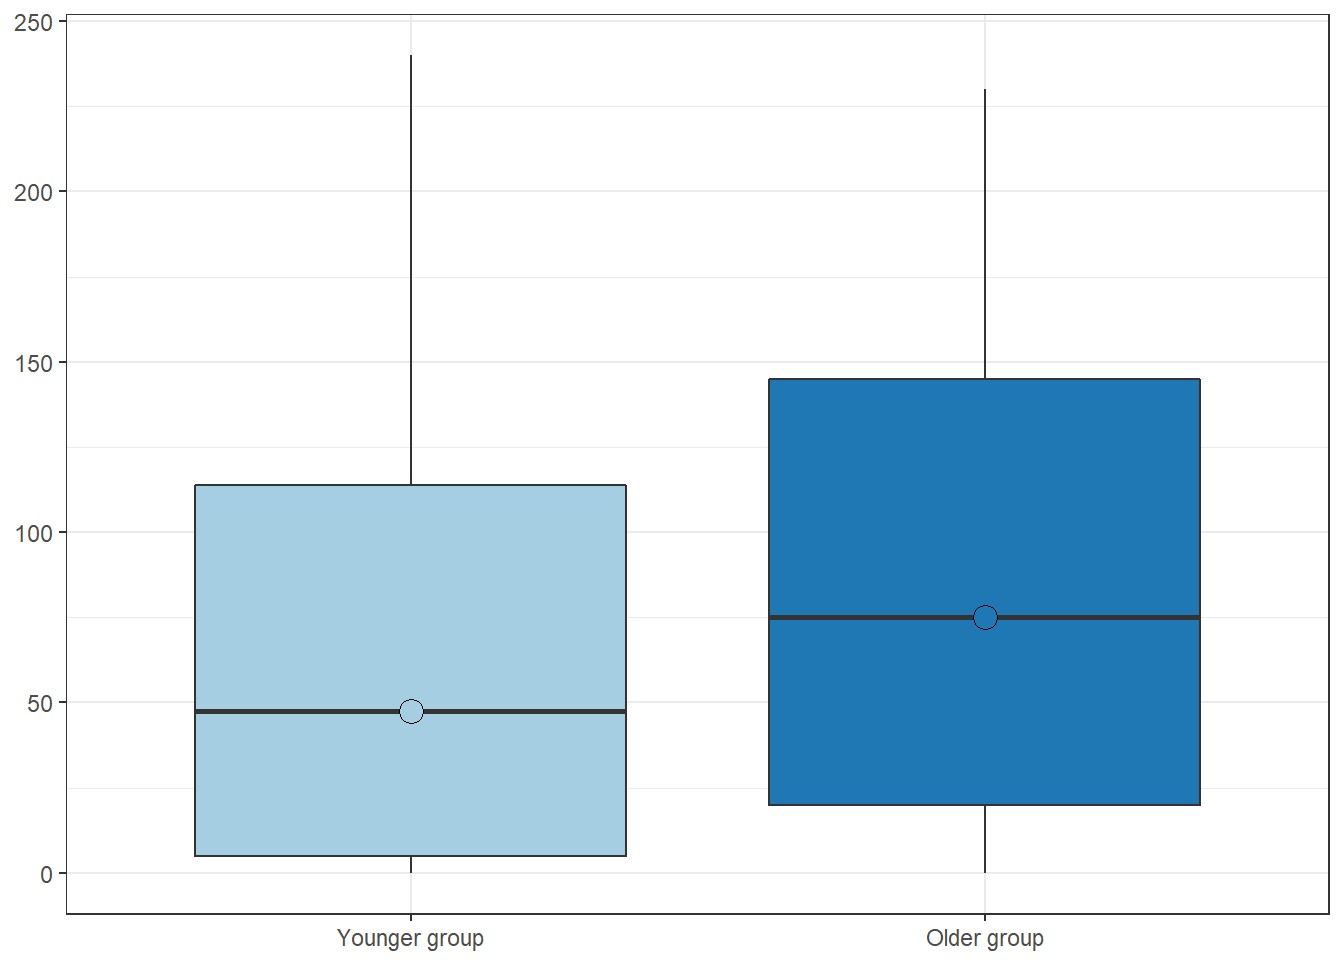
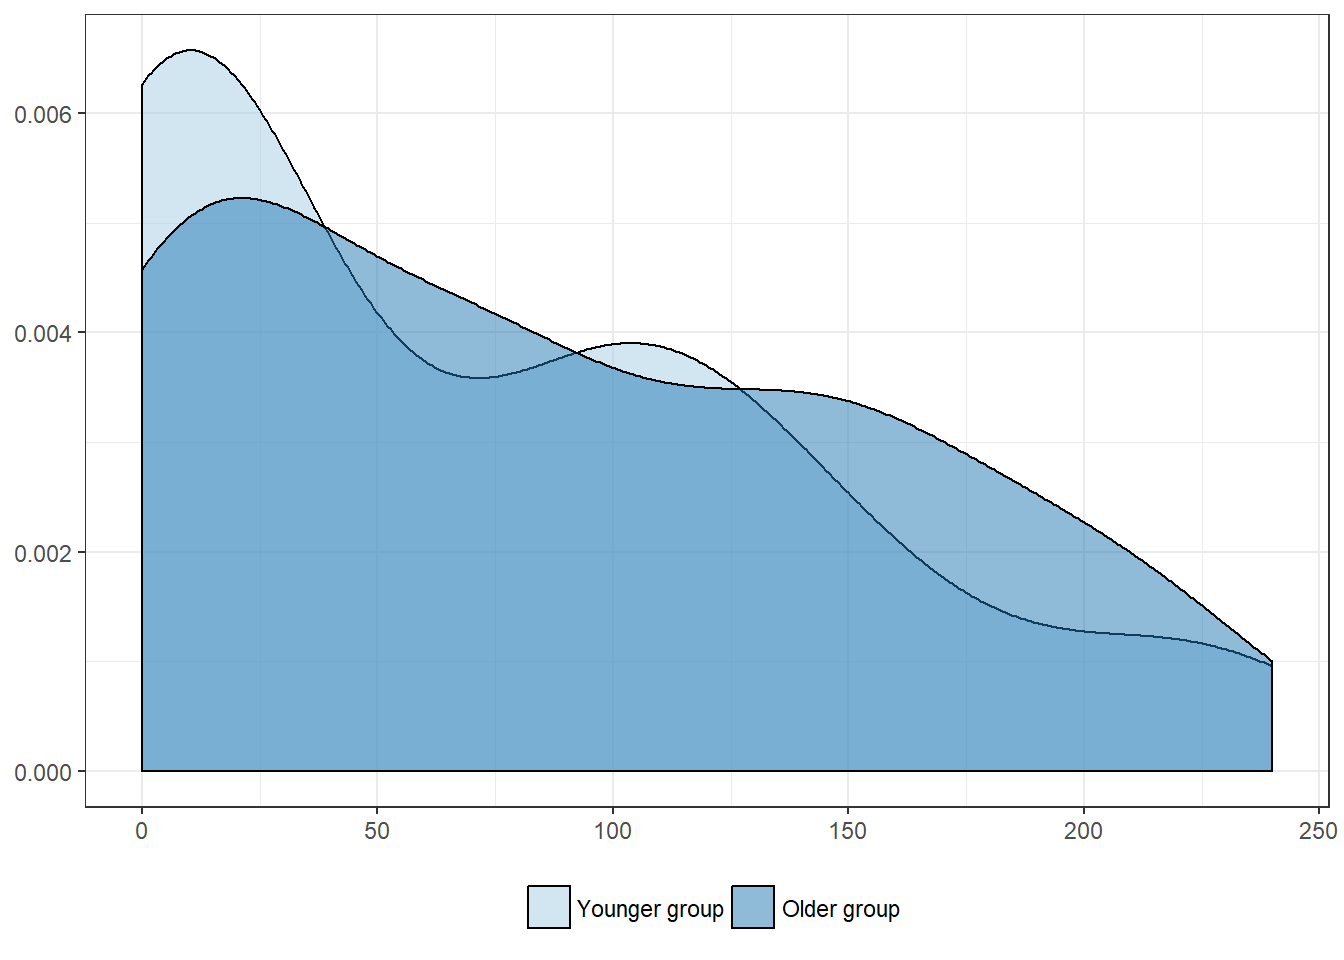
Age, in years
| Younger group | Older group | |
|---|---|---|
| Mean | 69.2 | 85.4 |
| Standard deviation | 71.2 | 71.3 |
| Median | 47.5 | 75.0 |
| Interquartile range | 108.7 | 125.0 |
| Minimum | 0.0 | 0.0 |
| Maximum | 240.0 | 230.0 |
| Value | |
|---|---|
| U-statistic | 1039 |
| P statistic | 1.9e-01 |
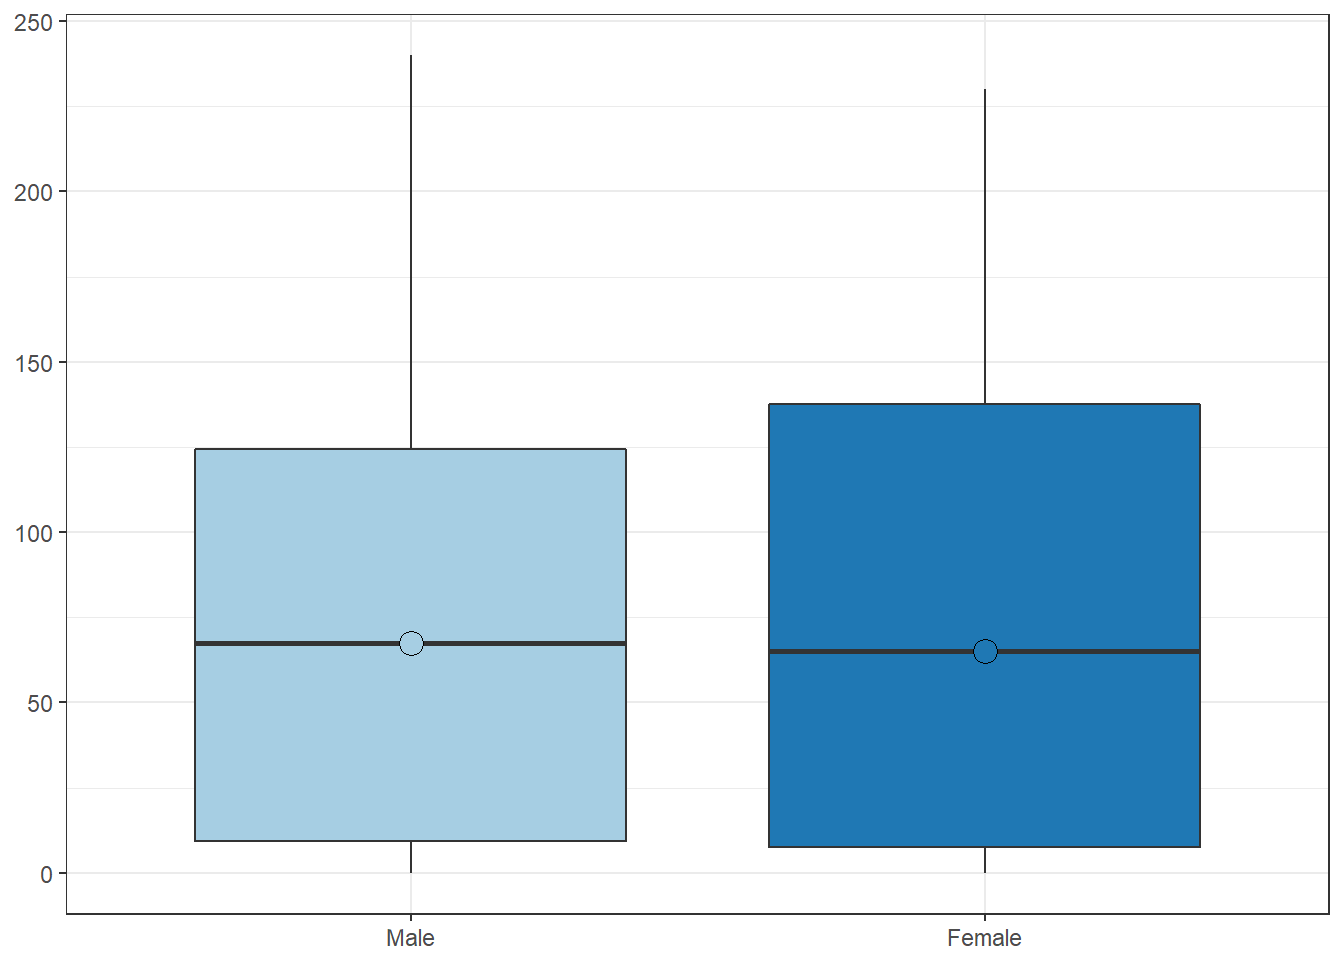
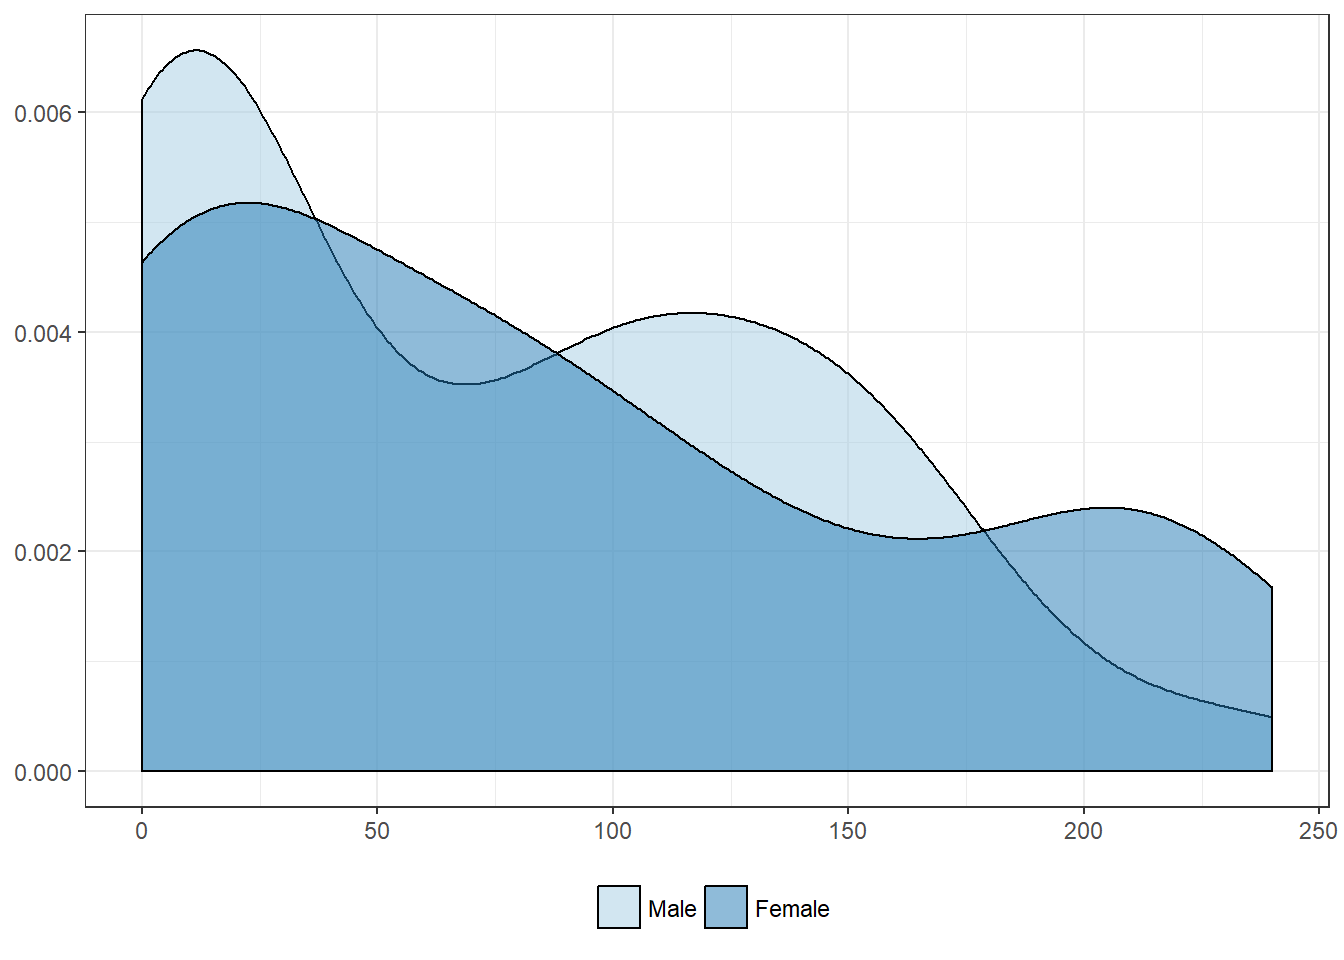
Sex
| Male | Female | |
|---|---|---|
| Mean | 72.5 | 84.4 |
| Standard deviation | 66.5 | 78.5 |
| Median | 67.5 | 65.0 |
| Interquartile range | 115.3 | 130.0 |
| Minimum | 0.0 | 0.0 |
| Maximum | 240.0 | 230.0 |
| Value | |
|---|---|
| U-statistic | 1110 |
| P statistic | 6.7e-01 |
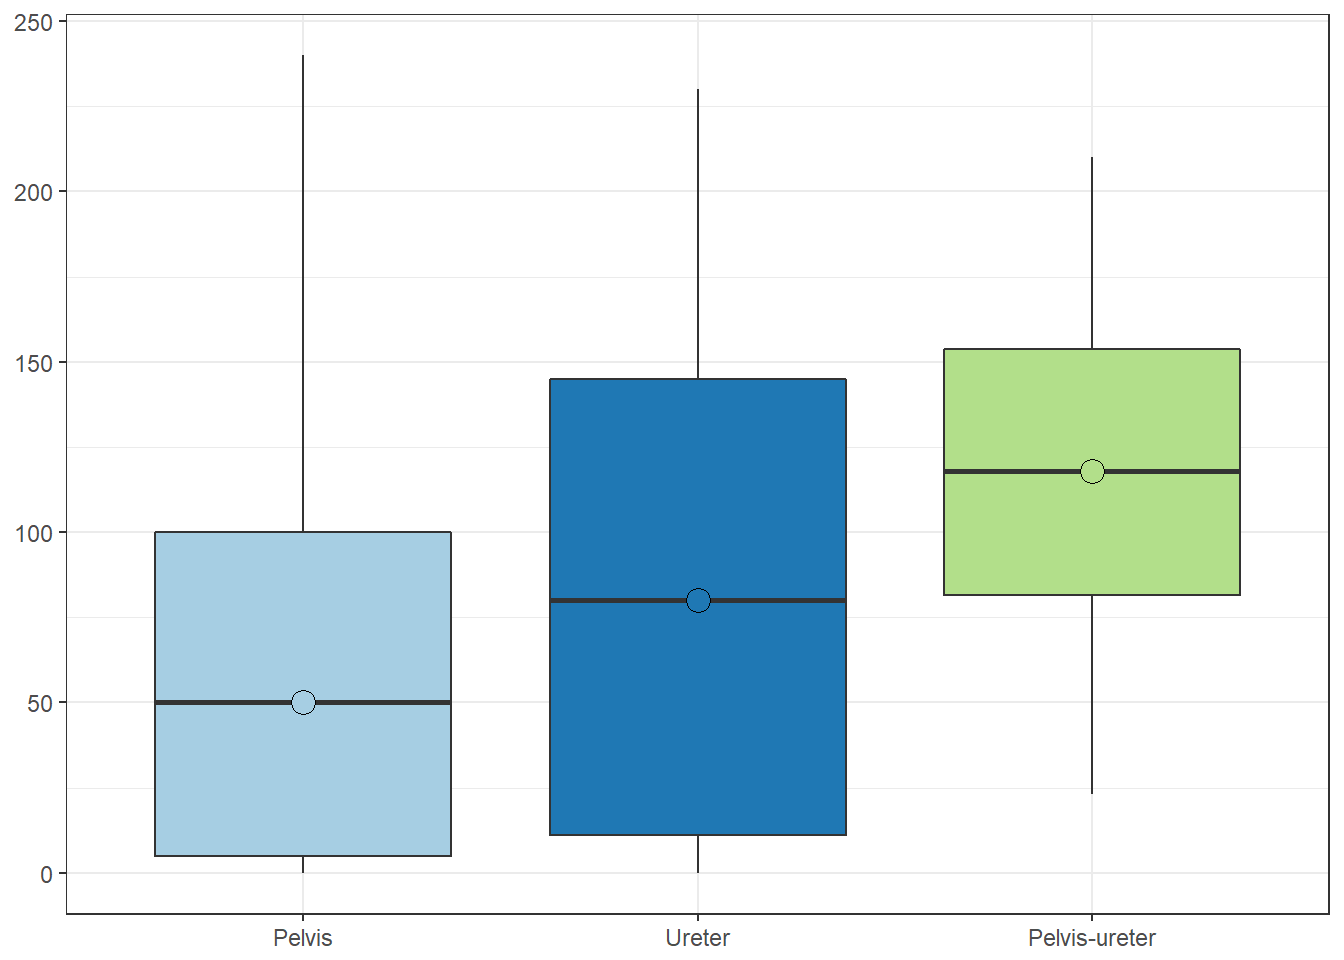
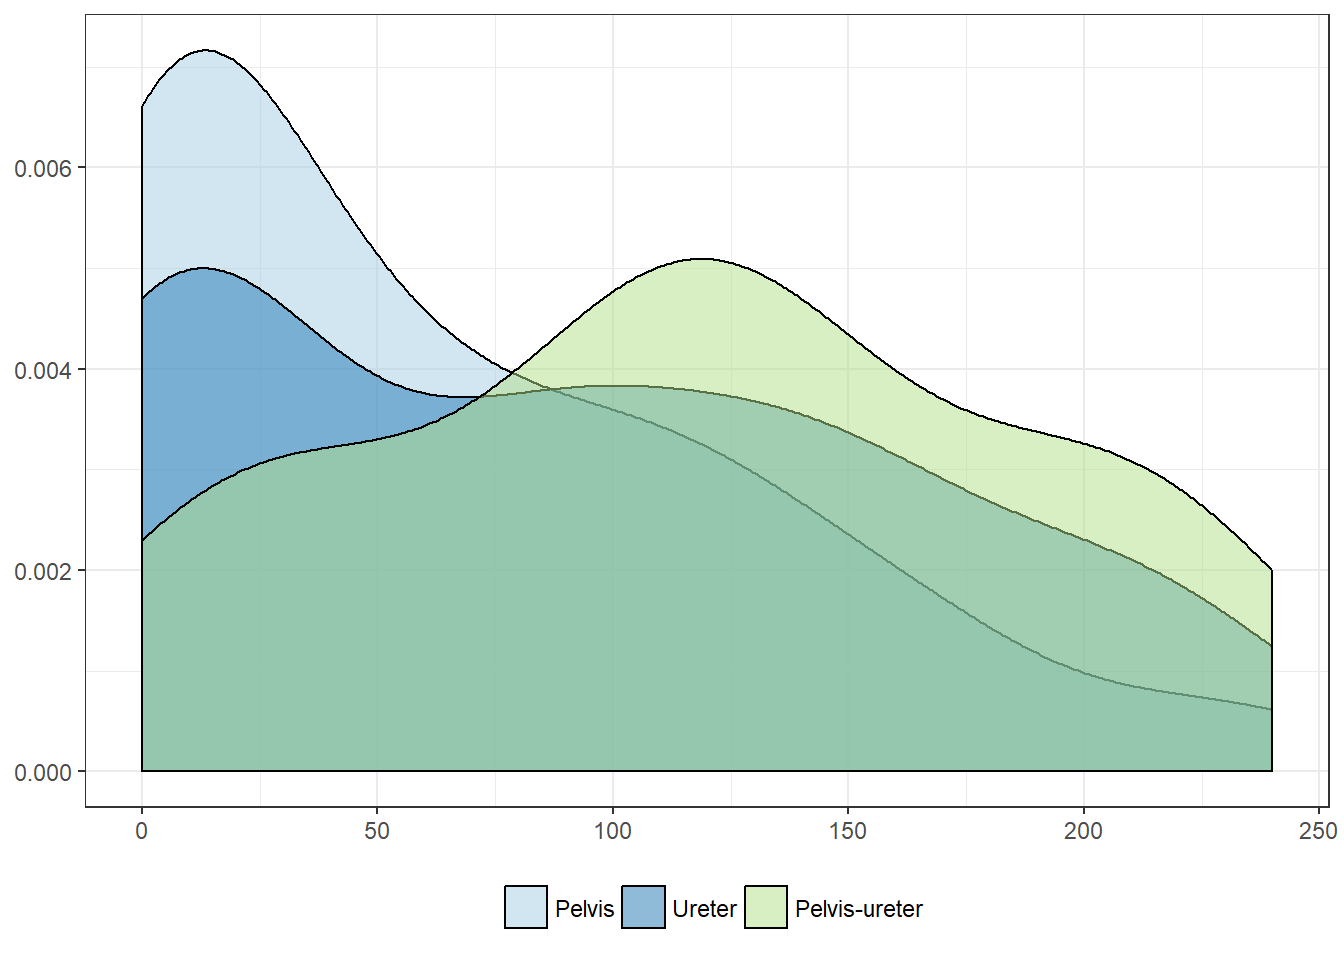
Pathologic features
Tumor location
| Pelvis | Ureter | Pelvis-ureter | |
|---|---|---|---|
| Mean | 62.9 | 86.9 | 117.2 |
| Standard deviation | 65.2 | 74.7 | 77.6 |
| Median | 50.0 | 80.0 | 118.0 |
| Interquartile range | 95.0 | 133.7 | 72.2 |
| Minimum | 0.0 | 0.0 | 23.0 |
| Maximum | 240.0 | 230.0 | 210.0 |
| Value | |
|---|---|
| Statistic | 3.539 |
| Parameter | 2 |
| P statistic | 0.17 |
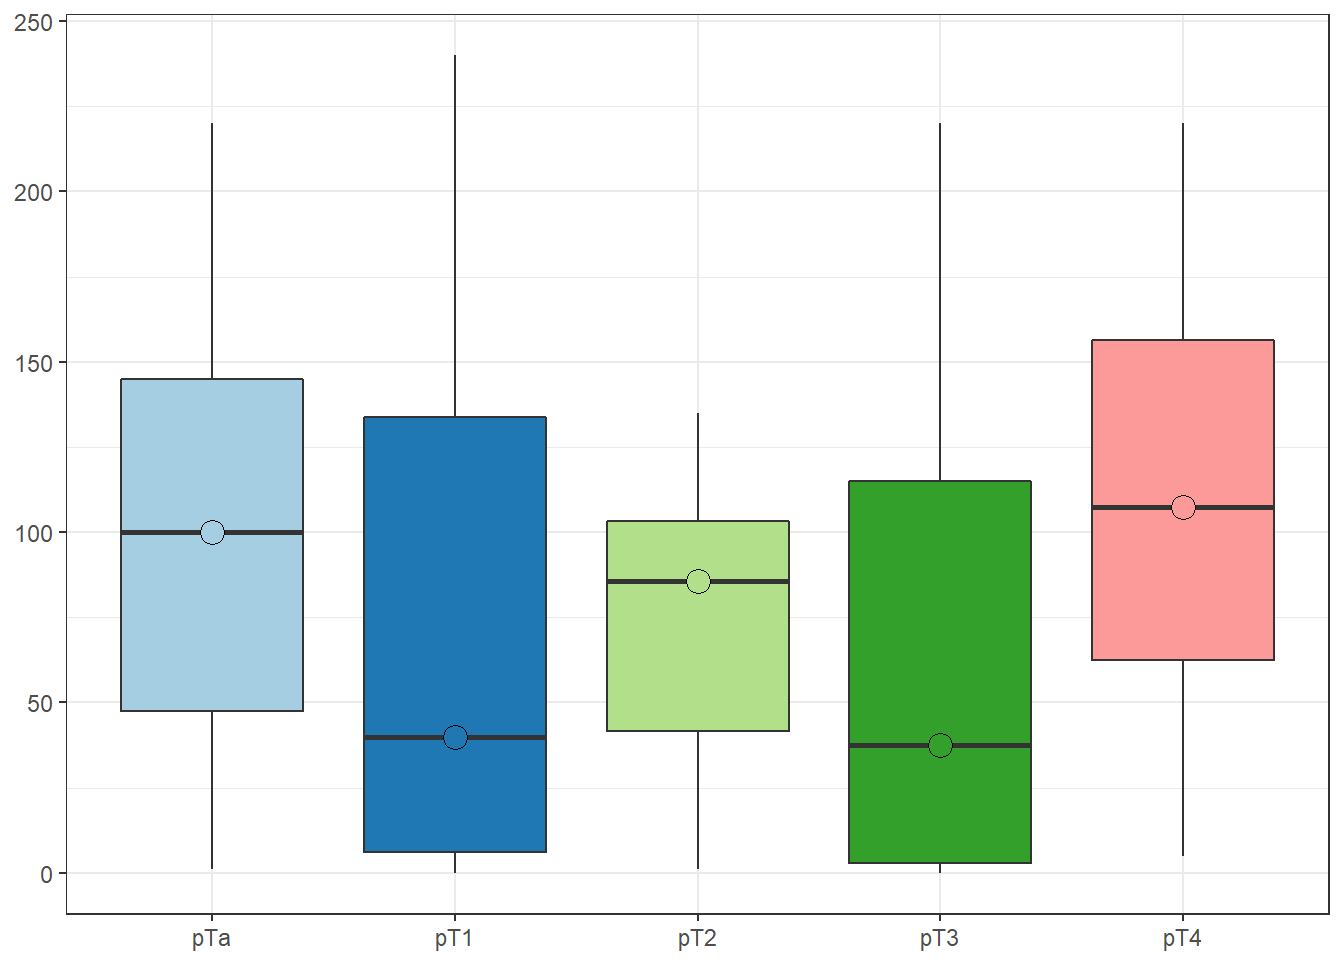
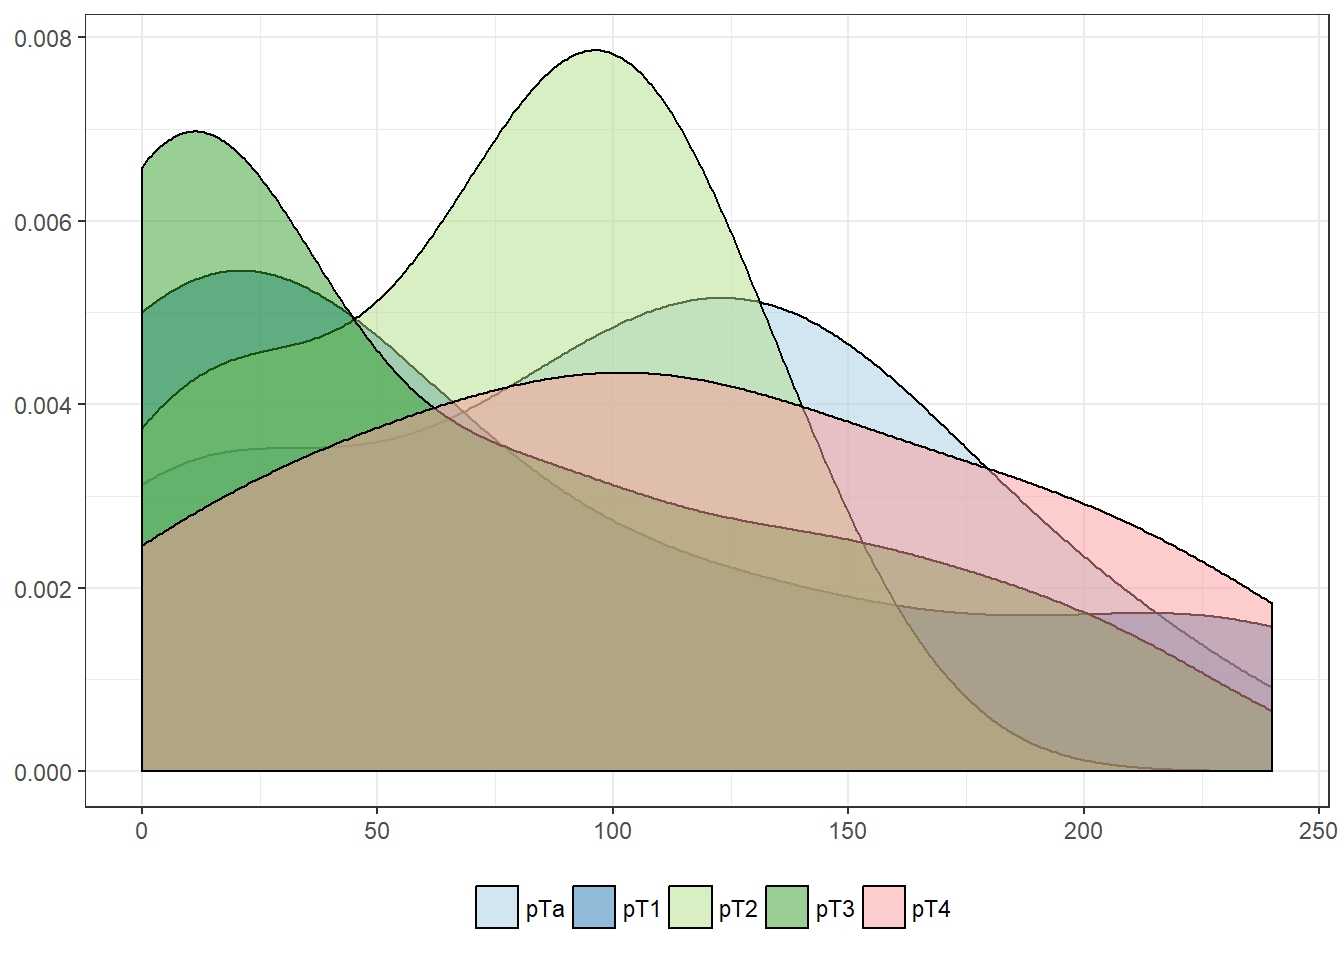
pT stage
| pTa | pT1 | pT2 | pT3 | pT4 | |
|---|---|---|---|---|---|
| Mean | 98.2 | 75.9 | 73.0 | 66.0 | 110.0 |
| Standard deviation | 67.6 | 84.9 | 46.8 | 69.5 | 78.0 |
| Median | 100.0 | 40.0 | 85.5 | 37.5 | 107.5 |
| Interquartile range | 97.5 | 127.5 | 61.8 | 112.2 | 93.8 |
| Minimum | 1.0 | 0.0 | 1.0 | 0.0 | 5.0 |
| Maximum | 220.0 | 240.0 | 135.0 | 220.0 | 220.0 |
| Value | |
|---|---|
| Statistic | 5.02 |
| Parameter | 4 |
| P statistic | 0.29 |
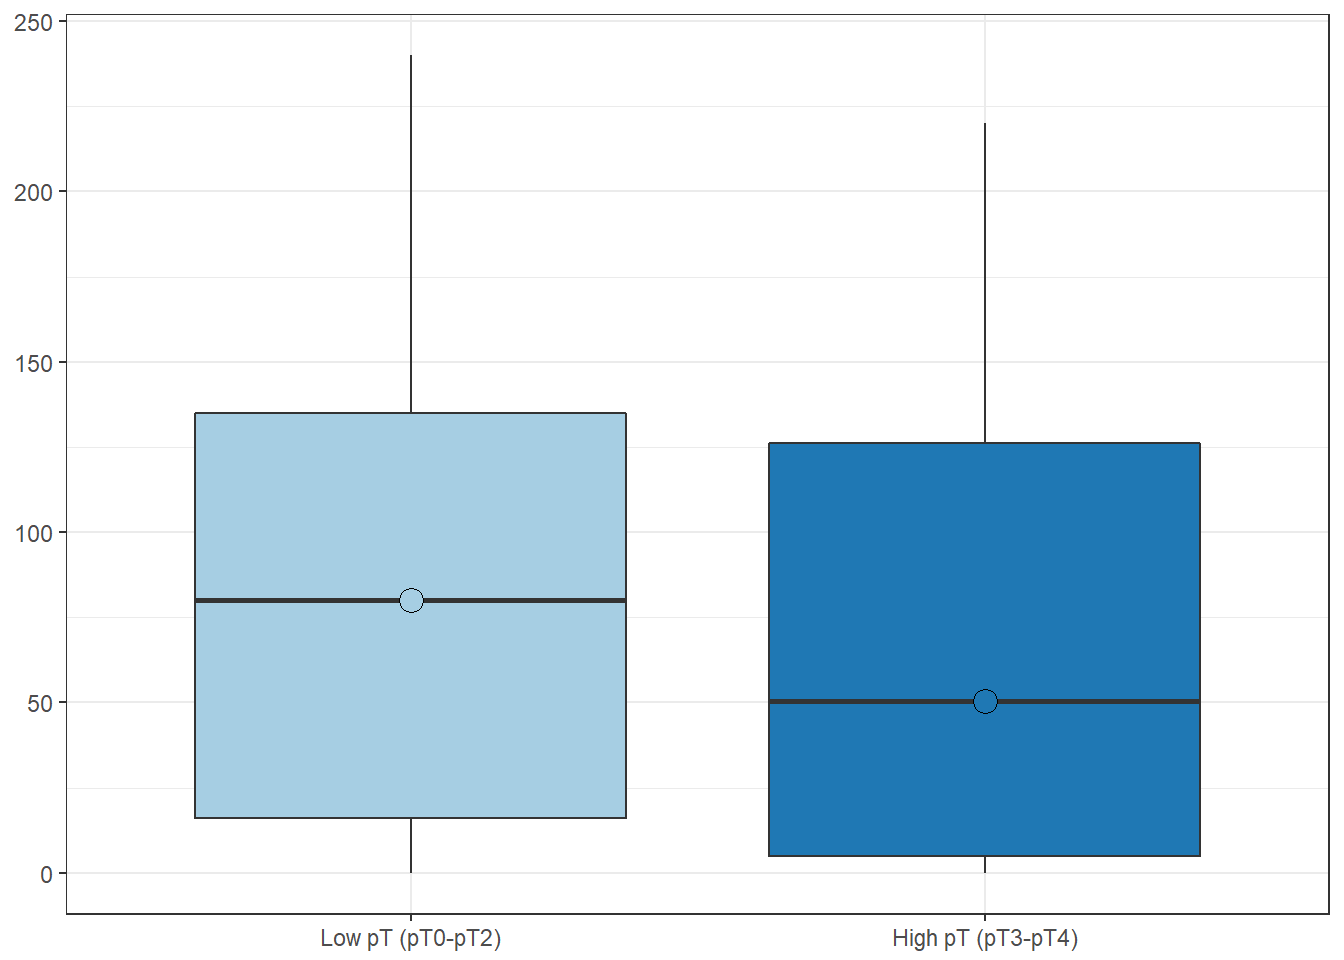
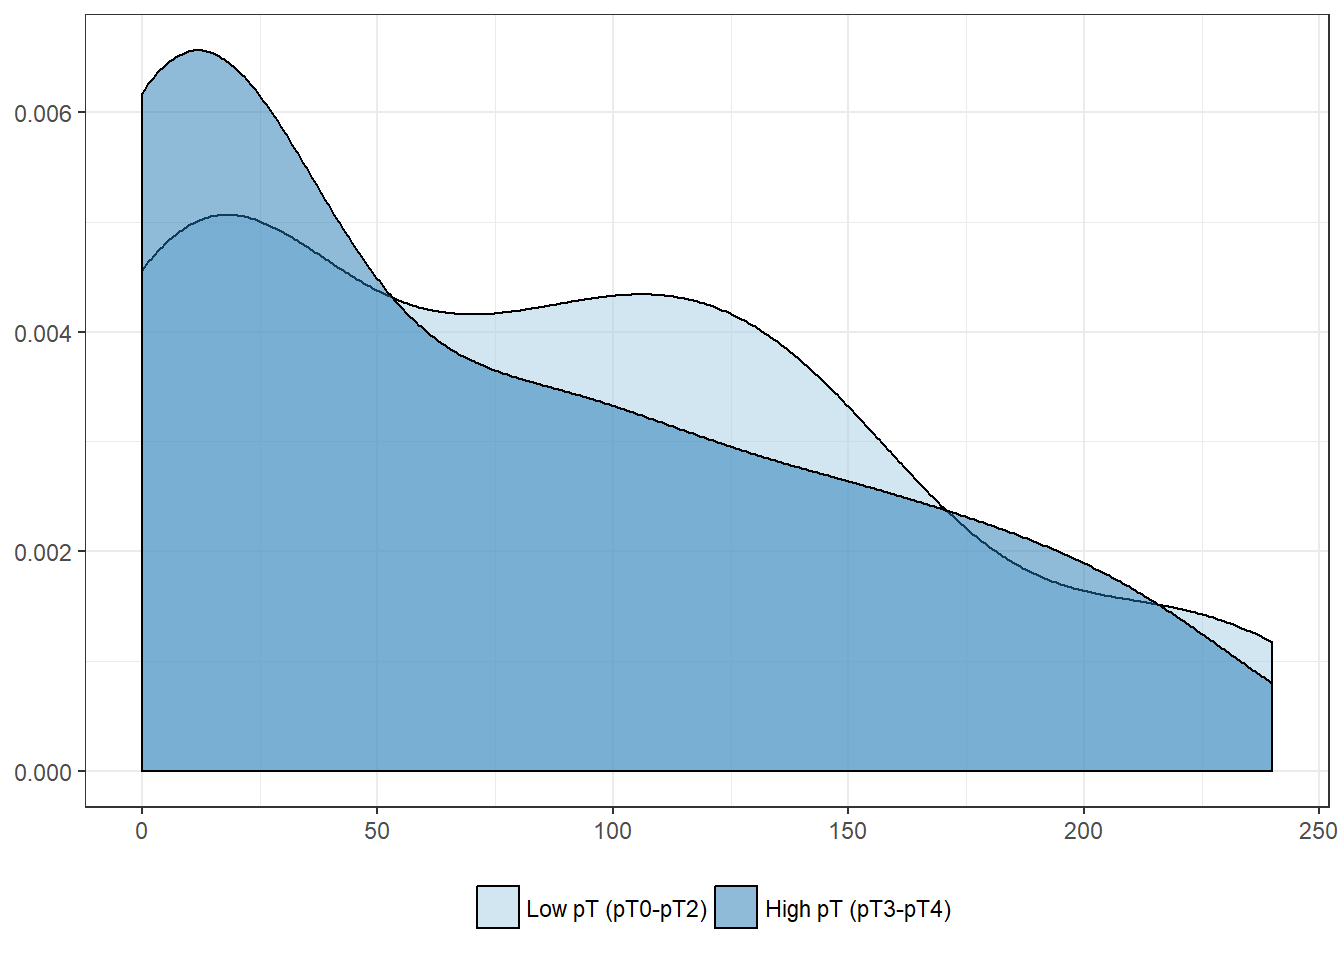
High pT stage (> pT2)
| Low pT (pT0-pT2) | High pT (pT3-pT4) | |
|---|---|---|
| Mean | 84.8 | 70.9 |
| Standard deviation | 71.7 | 71.1 |
| Median | 80.0 | 50.5 |
| Interquartile range | 119.0 | 121.2 |
| Minimum | 0.0 | 0.0 |
| Maximum | 240.0 | 220.0 |
| Value | |
|---|---|
| U-statistic | 1372 |
| P statistic | 2.7e-01 |
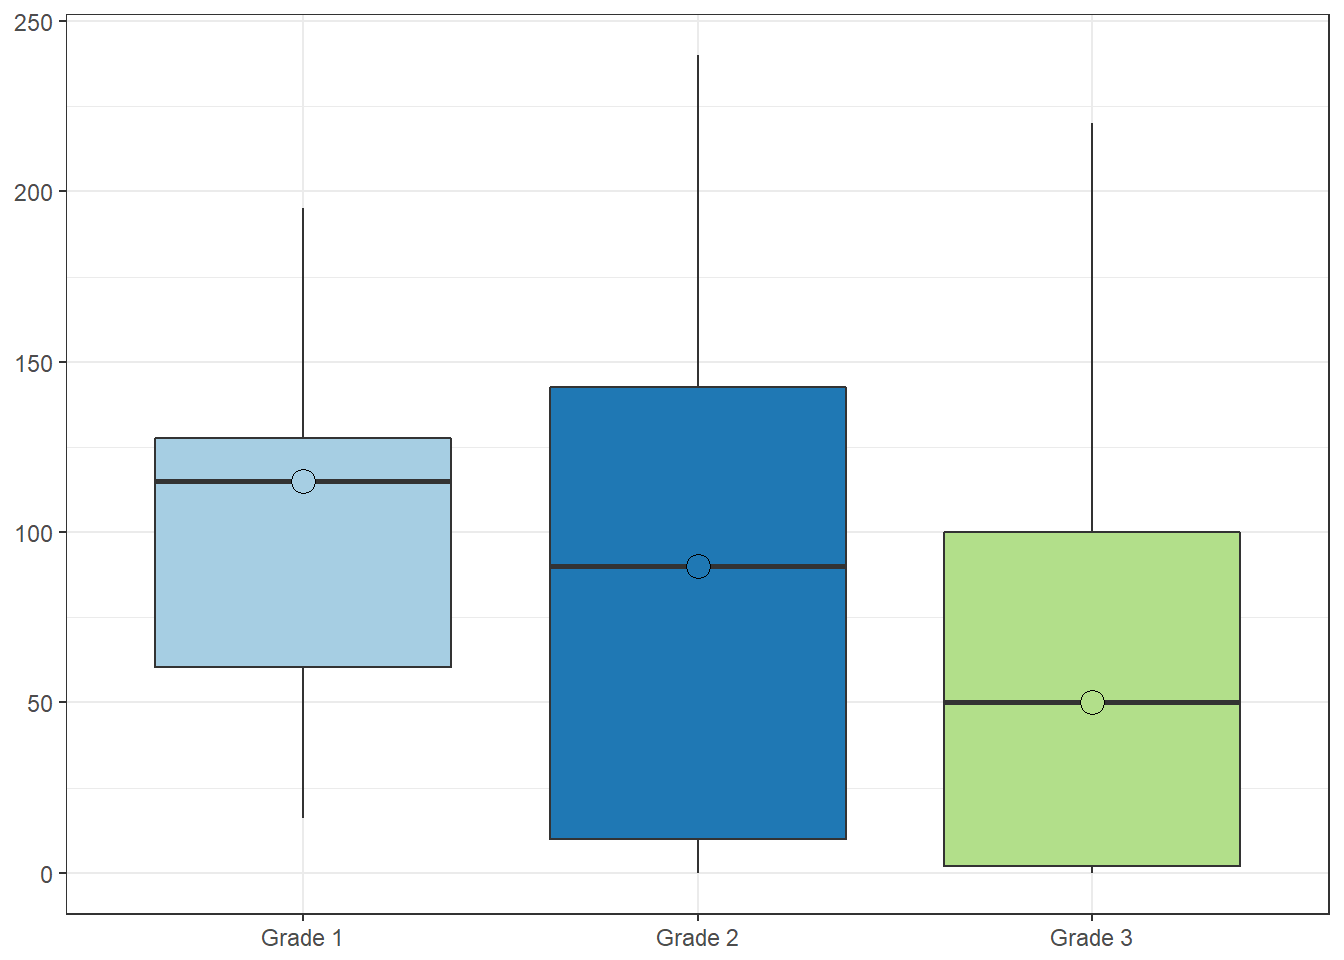
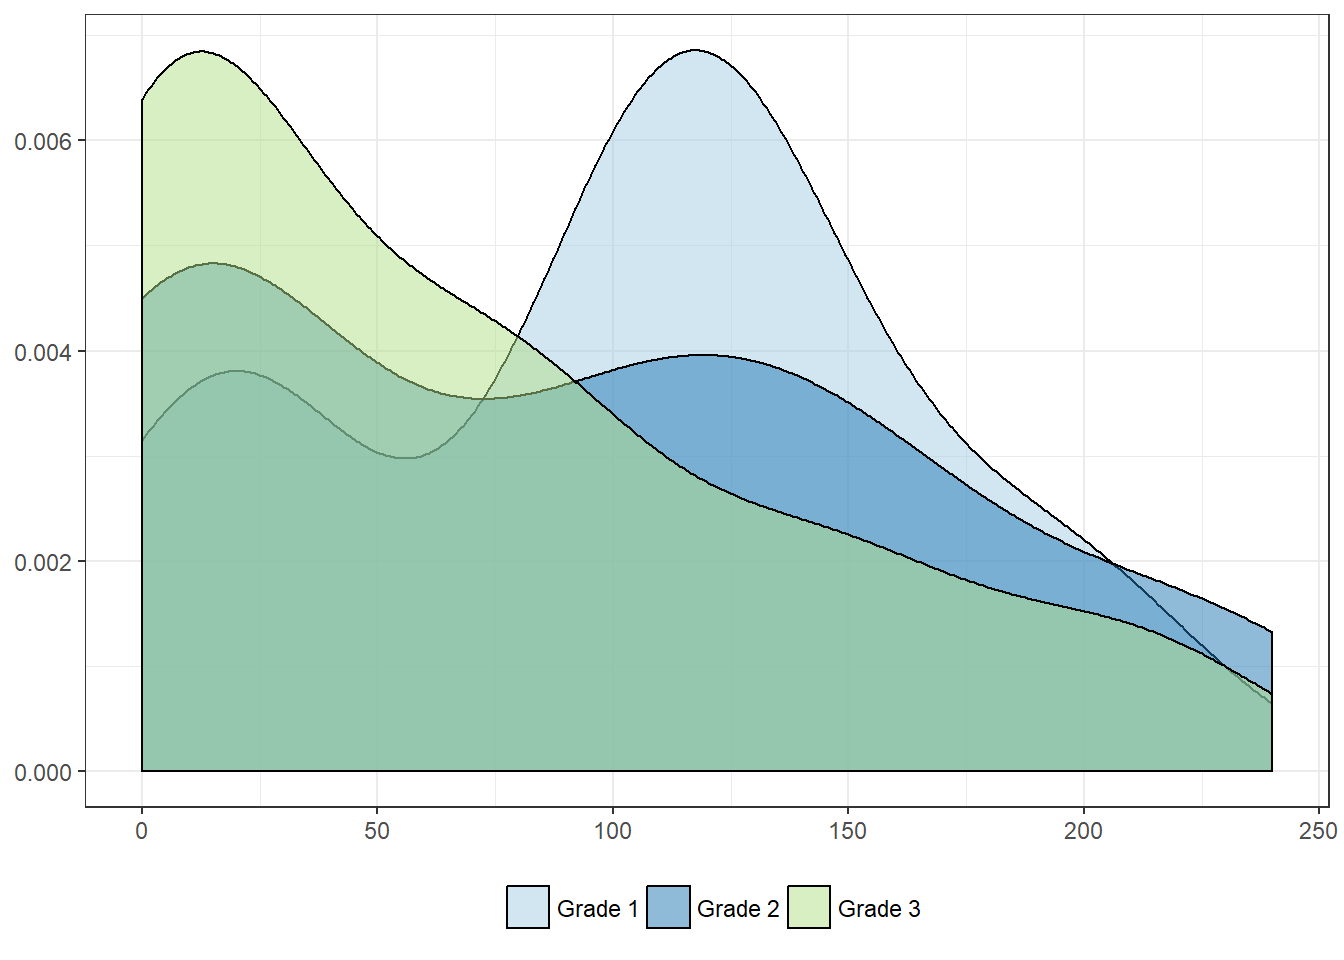
Histologic grade
| Grade 1 | Grade 2 | Grade 3 | |
|---|---|---|---|
| Mean | 100.3 | 88.6 | 65.8 |
| Standard deviation | 63.9 | 76.1 | 67.8 |
| Median | 115.0 | 90.0 | 50.0 |
| Interquartile range | 67.0 | 132.5 | 98.0 |
| Minimum | 16.0 | 0.0 | 0.0 |
| Maximum | 195.0 | 240.0 | 220.0 |
| Value | |
|---|---|
| Statistic | 4.186 |
| Parameter | 2 |
| P statistic | 0.12 |
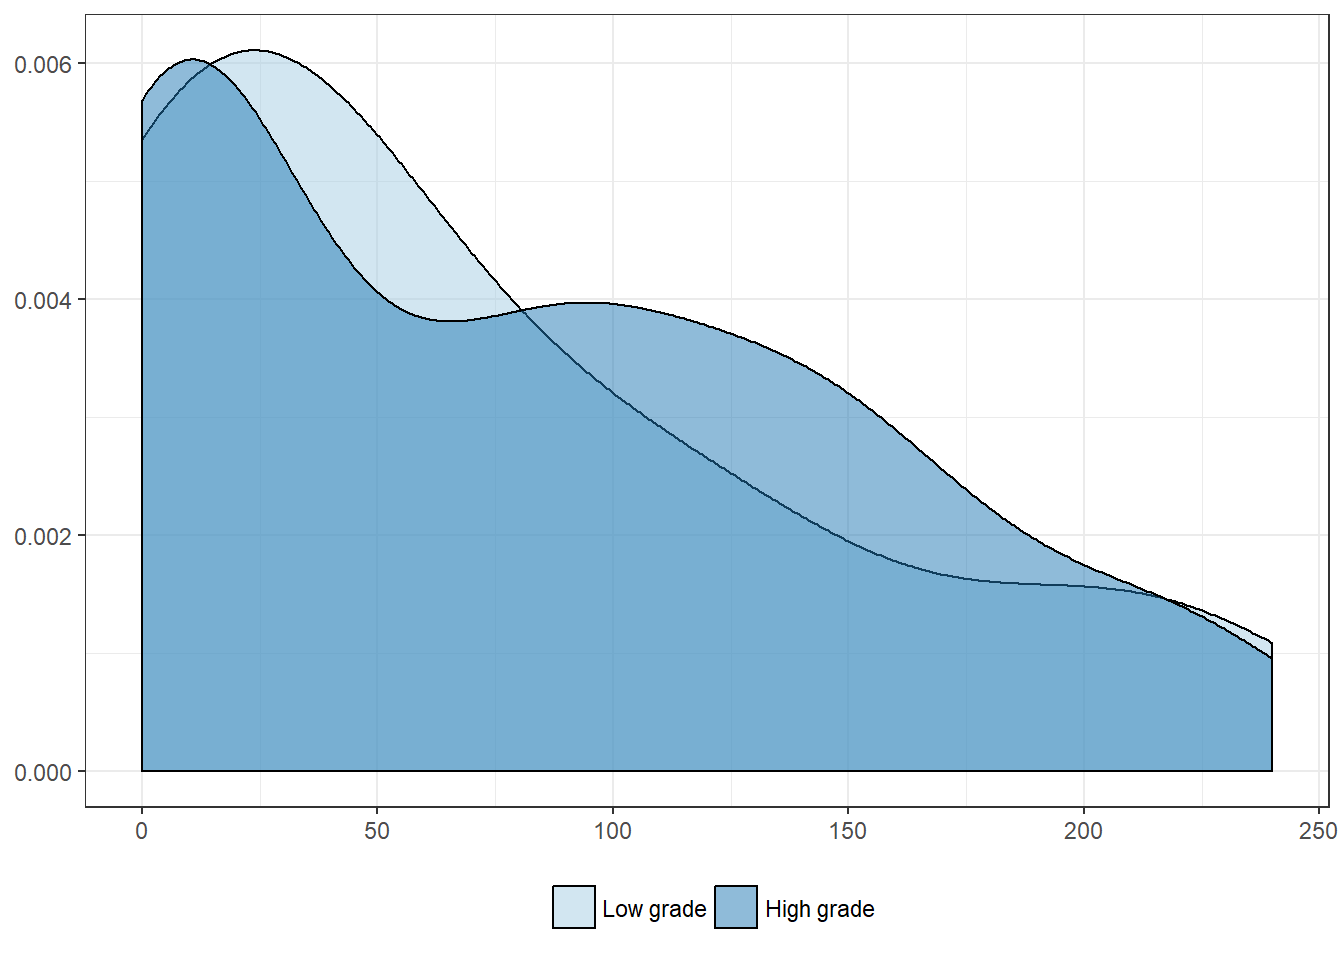
WHO histologic grade
| Low grade | High grade | |
|---|---|---|
| Mean | 68.1 | 78.8 |
| Standard deviation | 72.8 | 71.4 |
| Median | 35.0 | 74.0 |
| Interquartile range | 97.5 | 125.8 |
| Minimum | 0.0 | 0.0 |
| Maximum | 220.0 | 240.0 |
| Value | |
|---|---|
| U-statistic | 586 |
| P statistic | 6.7e-01 |

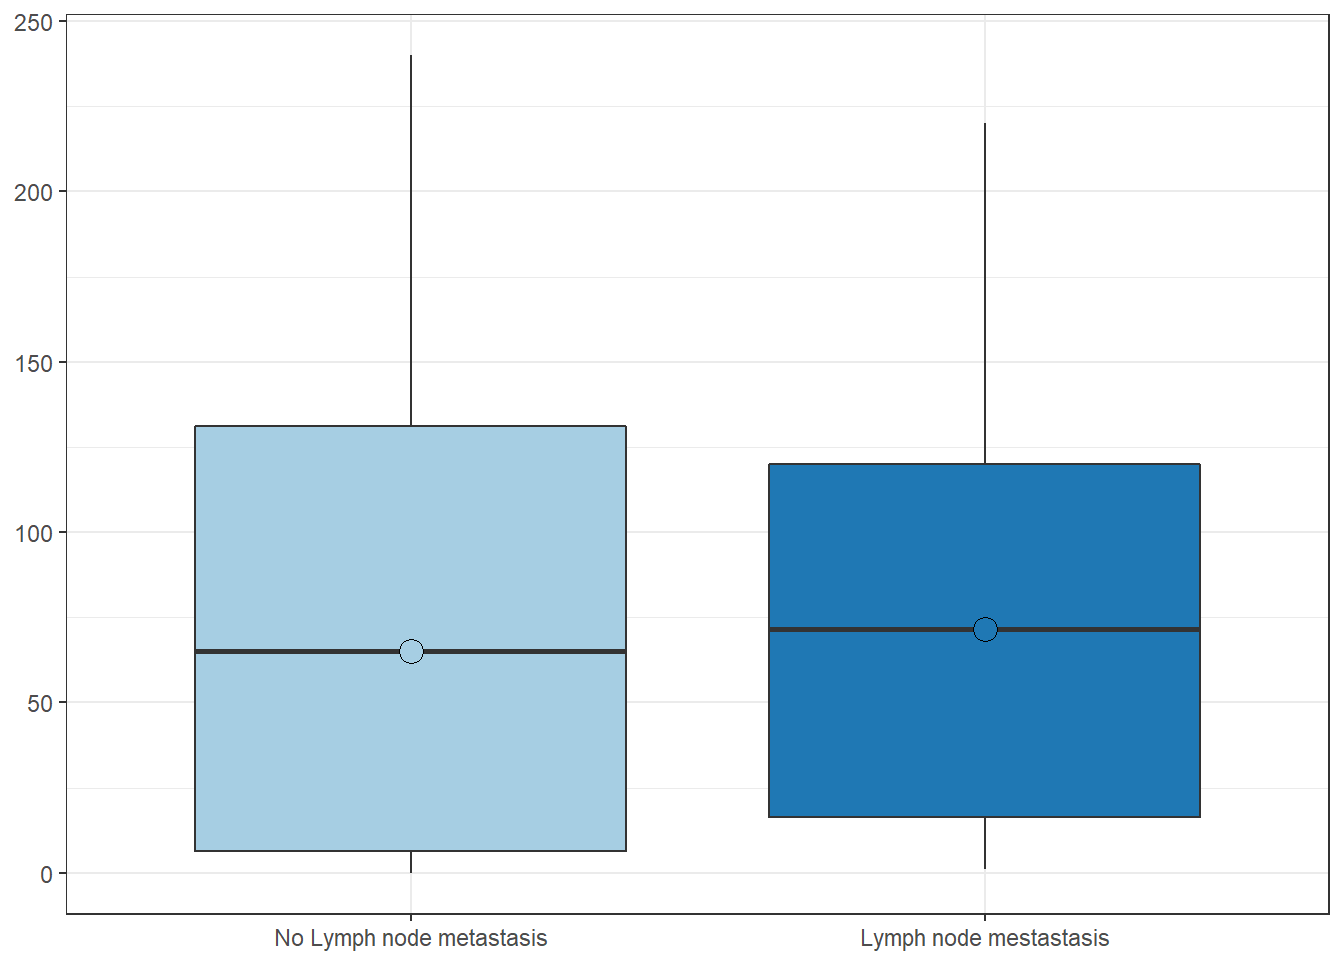
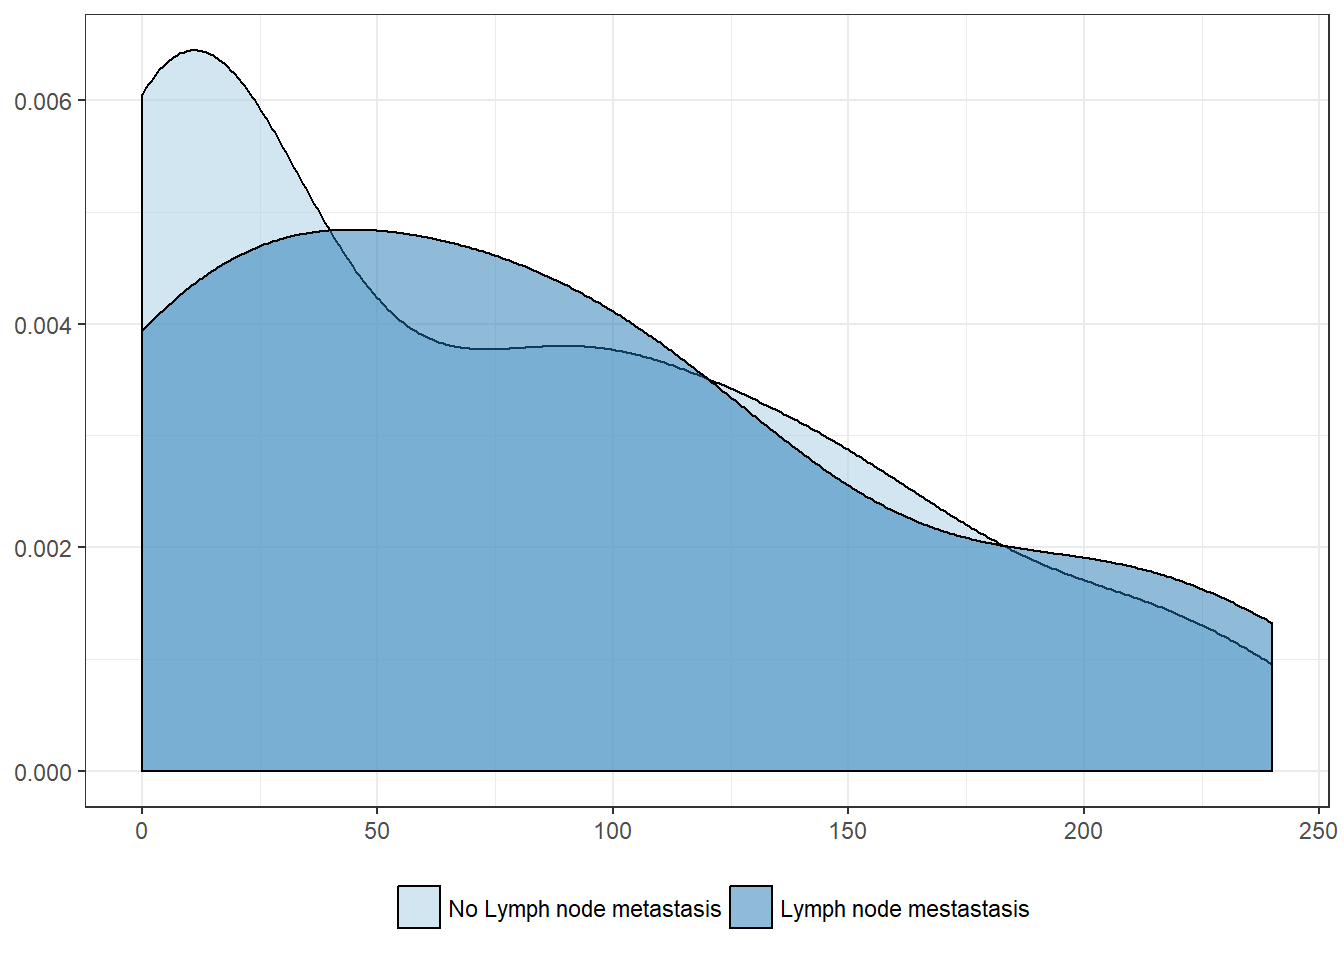
Lymph nodes metastasis
| No Lymph node metastasis | Lymph node mestastasis | |
|---|---|---|
| Mean | 75.3 | 83.3 |
| Standard deviation | 71.5 | 75.0 |
| Median | 65.0 | 71.5 |
| Interquartile range | 124.7 | 103.7 |
| Minimum | 0.0 | 1.0 |
| Maximum | 240.0 | 220.0 |
| Value | |
|---|---|
| U-statistic | 462 |
| P statistic | 6.5e-01 |
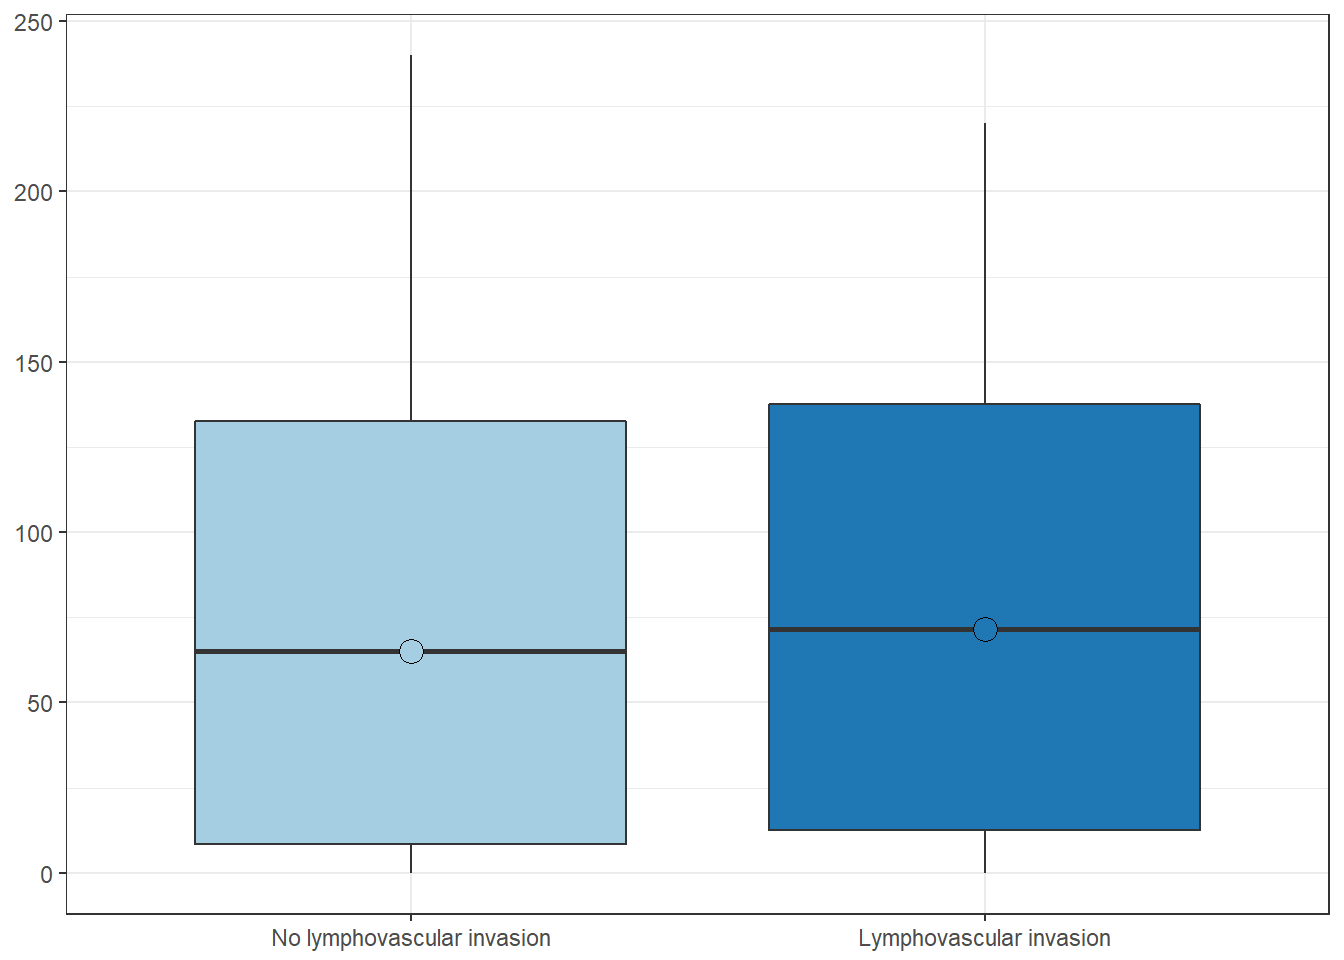
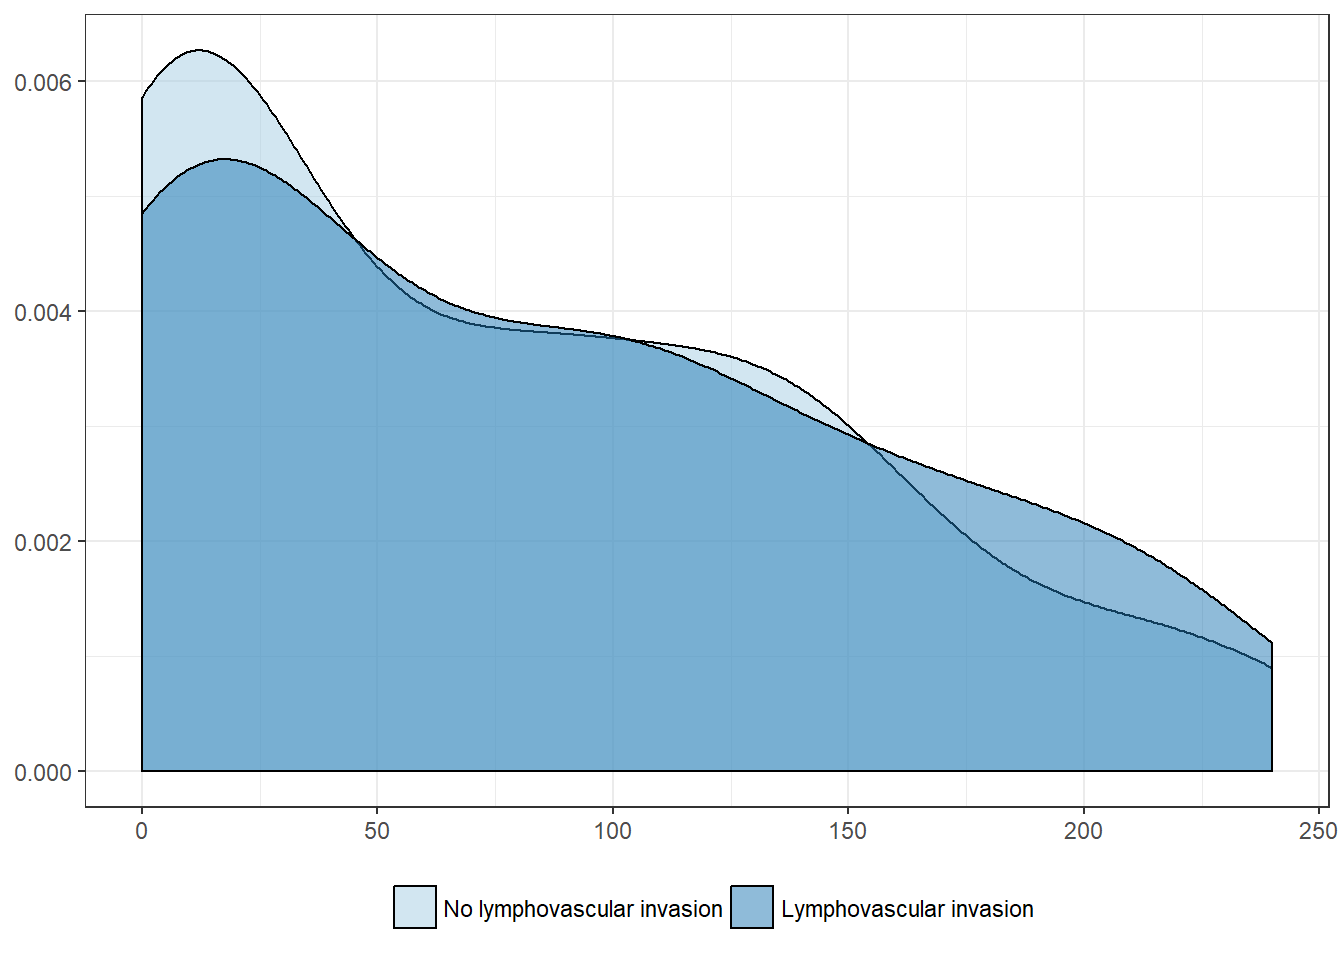
Lymphovascular invasion
| No lymphovascular invasion | Lymphovascular invasion | |
|---|---|---|
| Mean | 74.2 | 81.7 |
| Standard deviation | 70.5 | 73.2 |
| Median | 65.0 | 71.5 |
| Interquartile range | 124.0 | 125.0 |
| Minimum | 0.0 | 0.0 |
| Maximum | 240.0 | 220.0 |
| Value | |
|---|---|
| U-statistic | 1140 |
| P statistic | 7.8e-01 |
Outcome
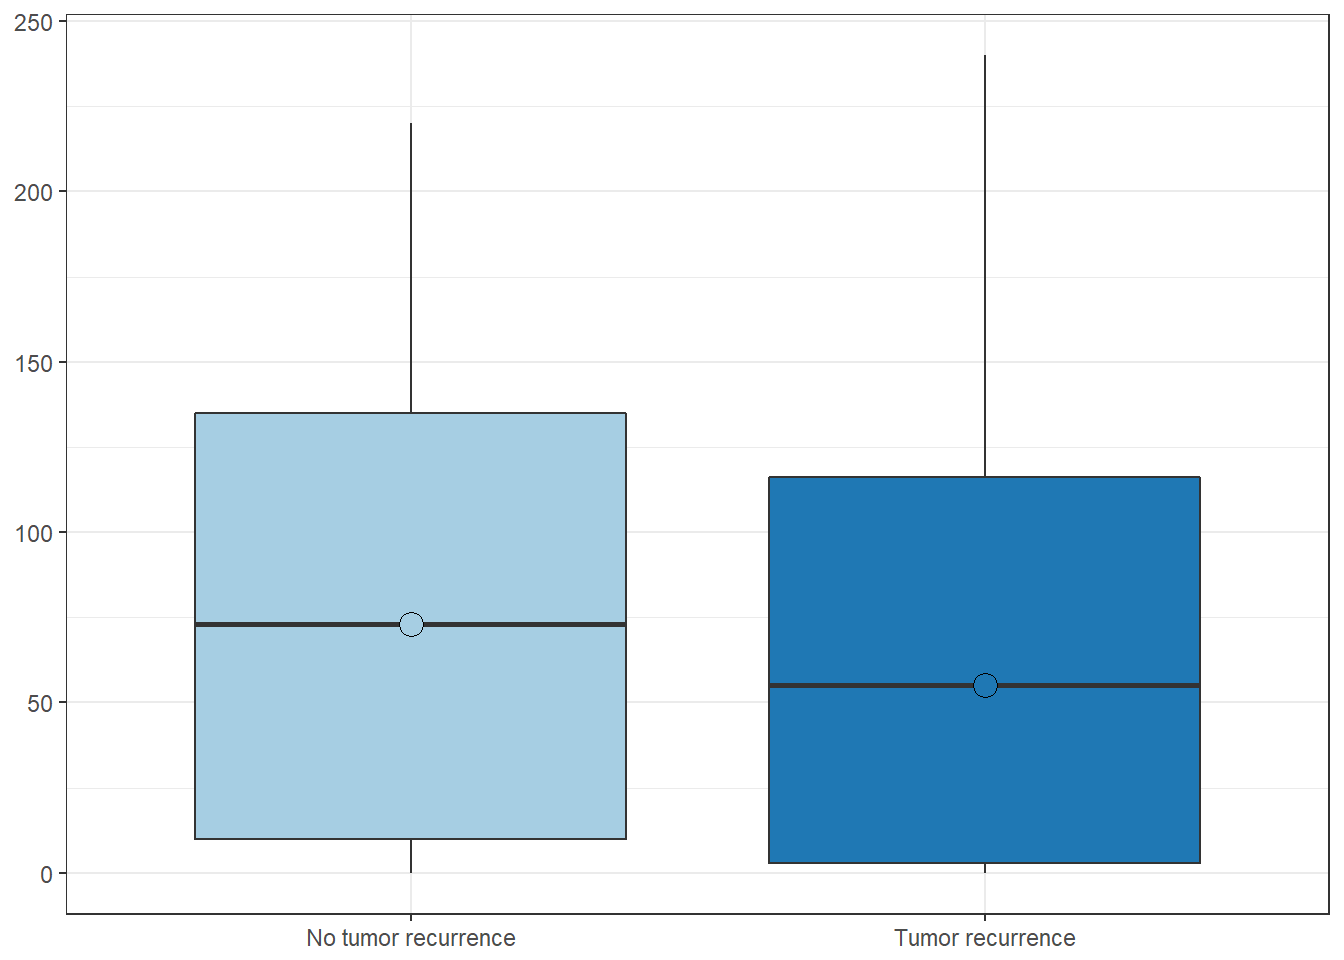
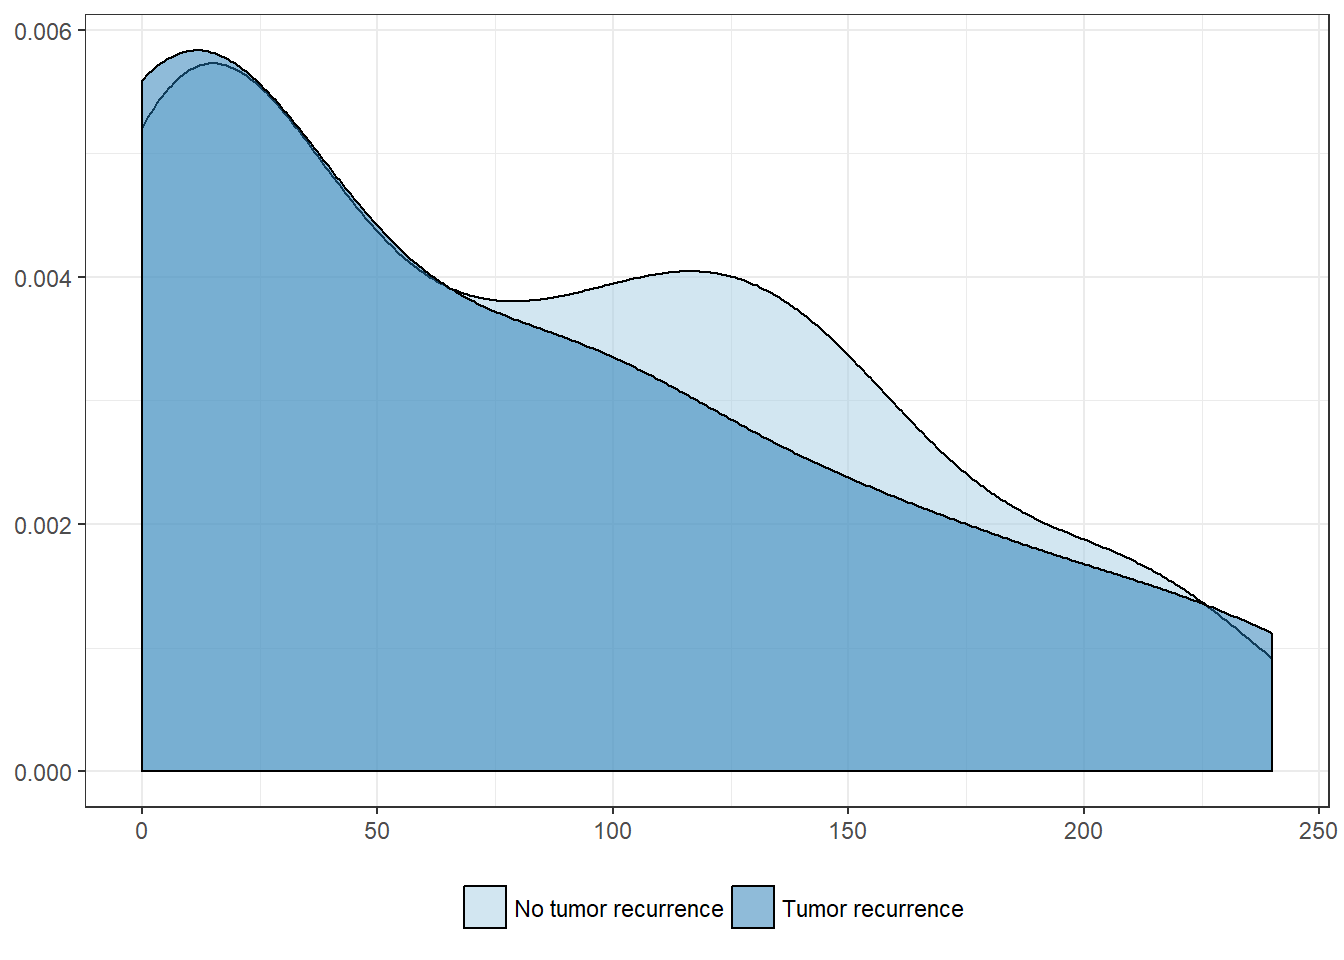
Tumor recurrence
| No tumor recurrence | Tumor recurrence | |
|---|---|---|
| Mean | 80.8 | 71.9 |
| Standard deviation | 70.0 | 76.2 |
| Median | 73.0 | 55.0 |
| Interquartile range | 125.0 | 113.5 |
| Minimum | 0.0 | 0.0 |
| Maximum | 220.0 | 240.0 |
| Value | |
|---|---|
| U-statistic | 1148 |
| P statistic | 4.1e-01 |
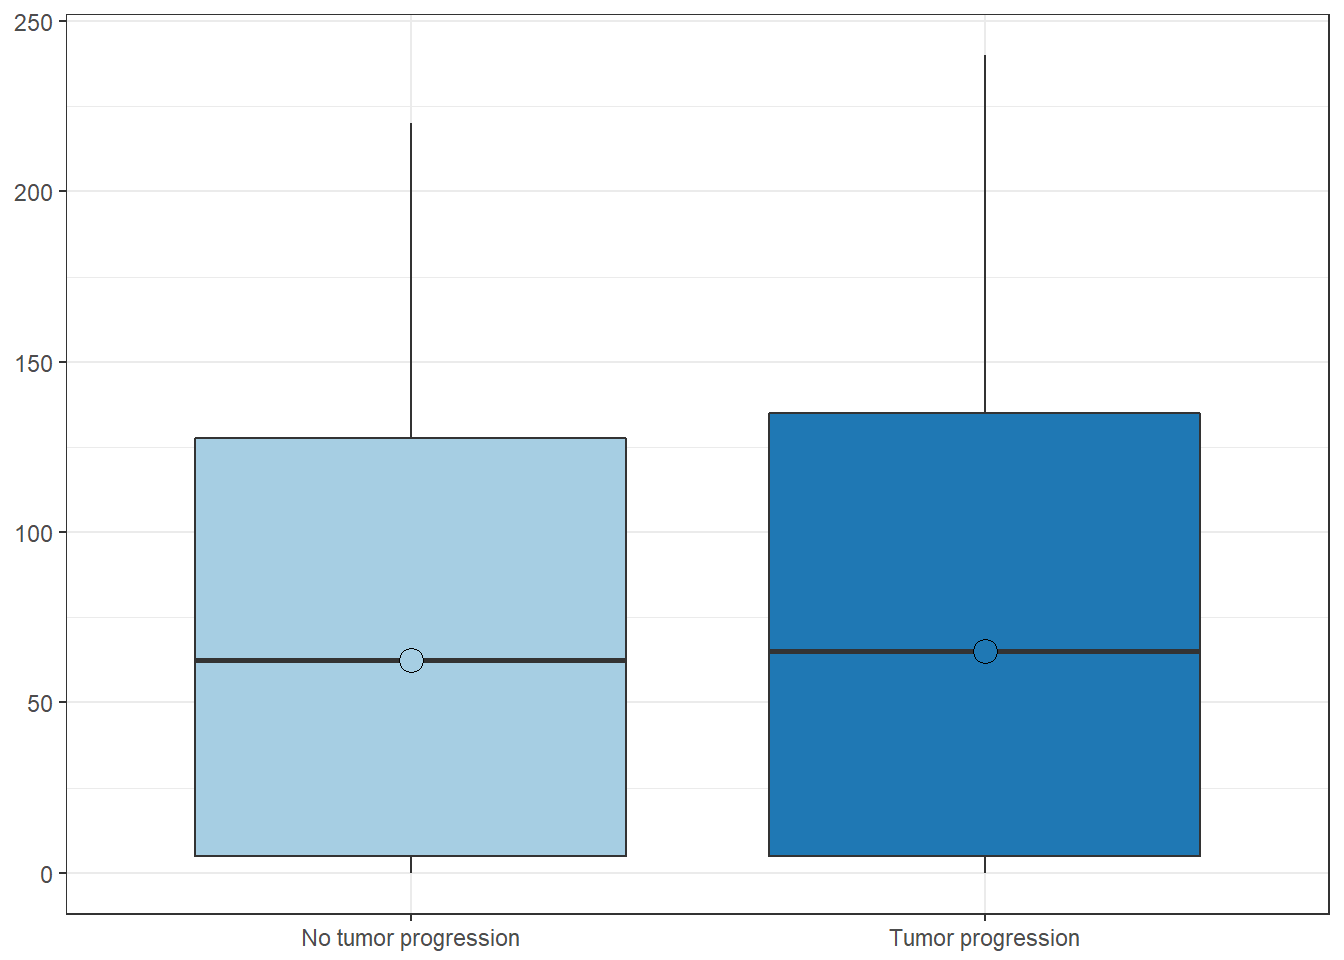
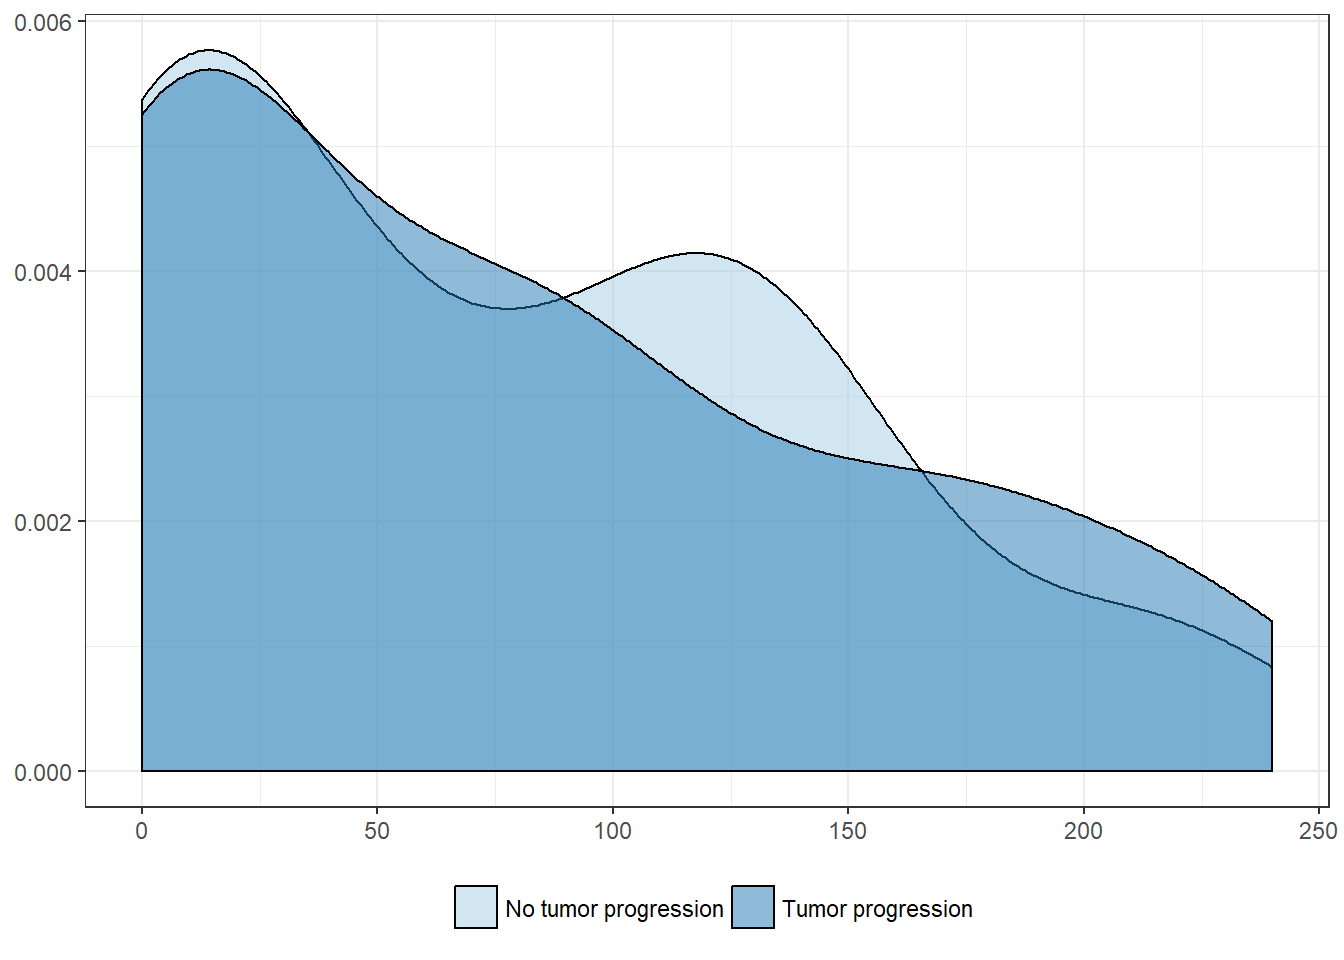
Tumor progression
| No tumor progression | Tumor progression | |
|---|---|---|
| Mean | 74.3 | 78.4 |
| Standard deviation | 69.4 | 75.2 |
| Median | 62.5 | 65.0 |
| Interquartile range | 122.7 | 130.0 |
| Minimum | 0.0 | 0.0 |
| Maximum | 220.0 | 240.0 |
| Value | |
|---|---|
| U-statistic | 812 |
| P statistic | 8.5e-01 |
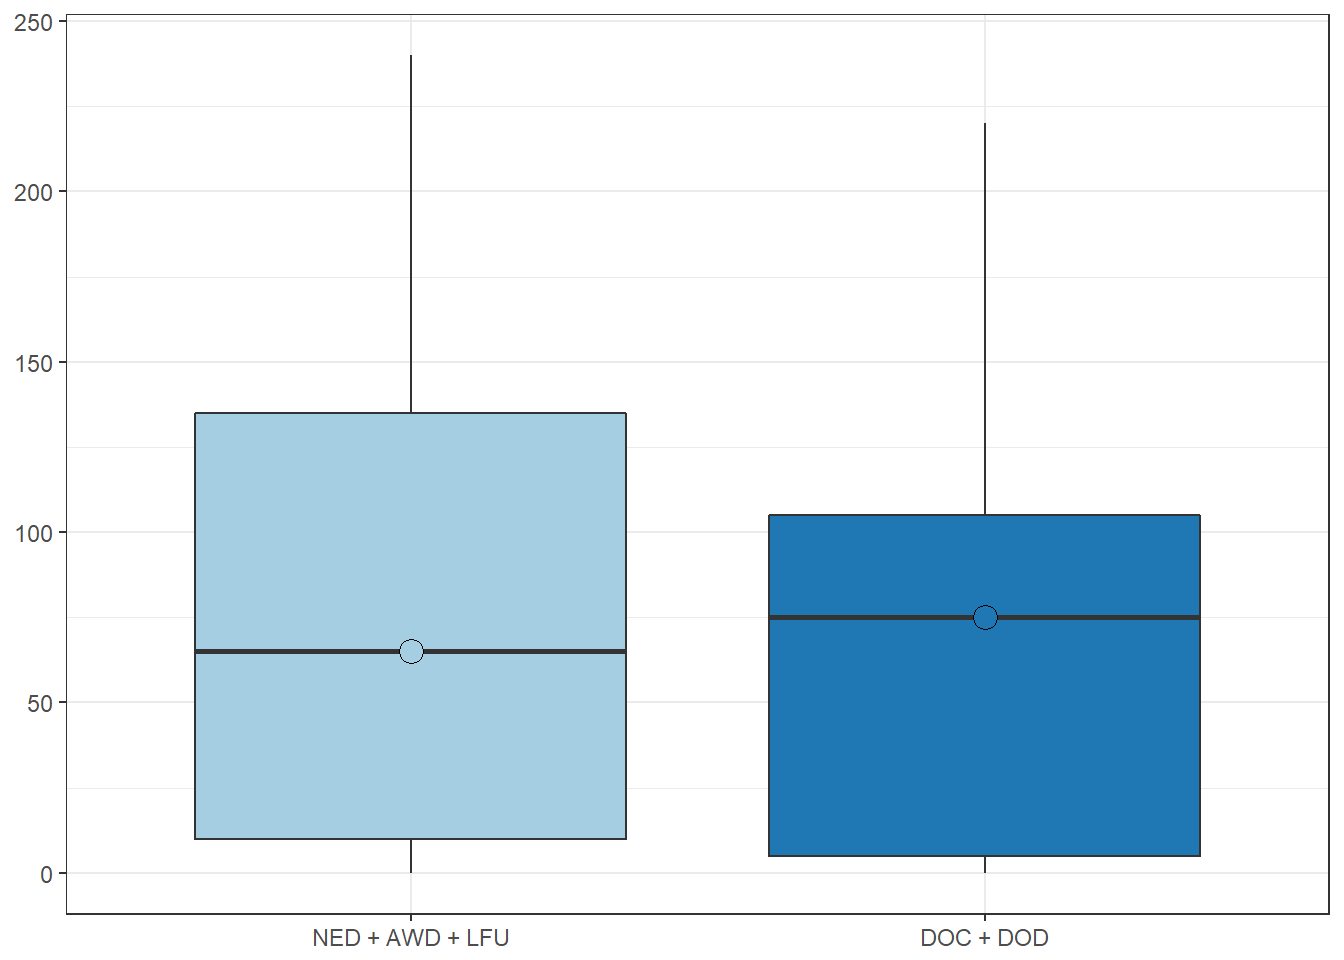
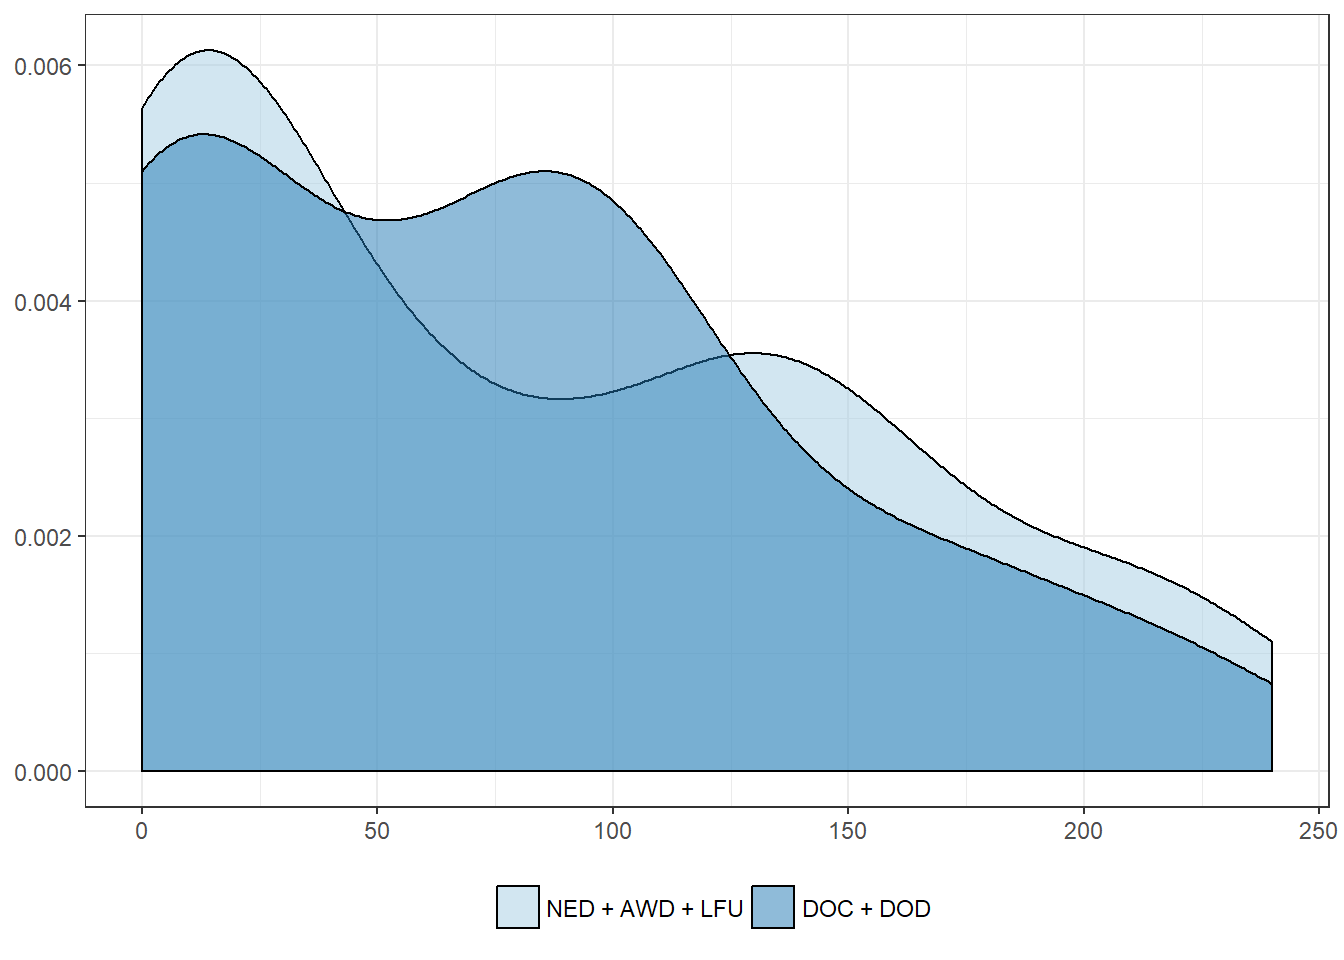
Overall mortality
| NED + AWD + LFU | DOC + DOD | |
|---|---|---|
| Mean | 79.1 | 73.5 |
| Standard deviation | 74.0 | 66.6 |
| Median | 65.0 | 75.0 |
| Interquartile range | 125.0 | 100.0 |
| Minimum | 0.0 | 0.0 |
| Maximum | 240.0 | 220.0 |
| Value | |
|---|---|
| U-statistic | 1131 |
| P statistic | 7.6e-01 |
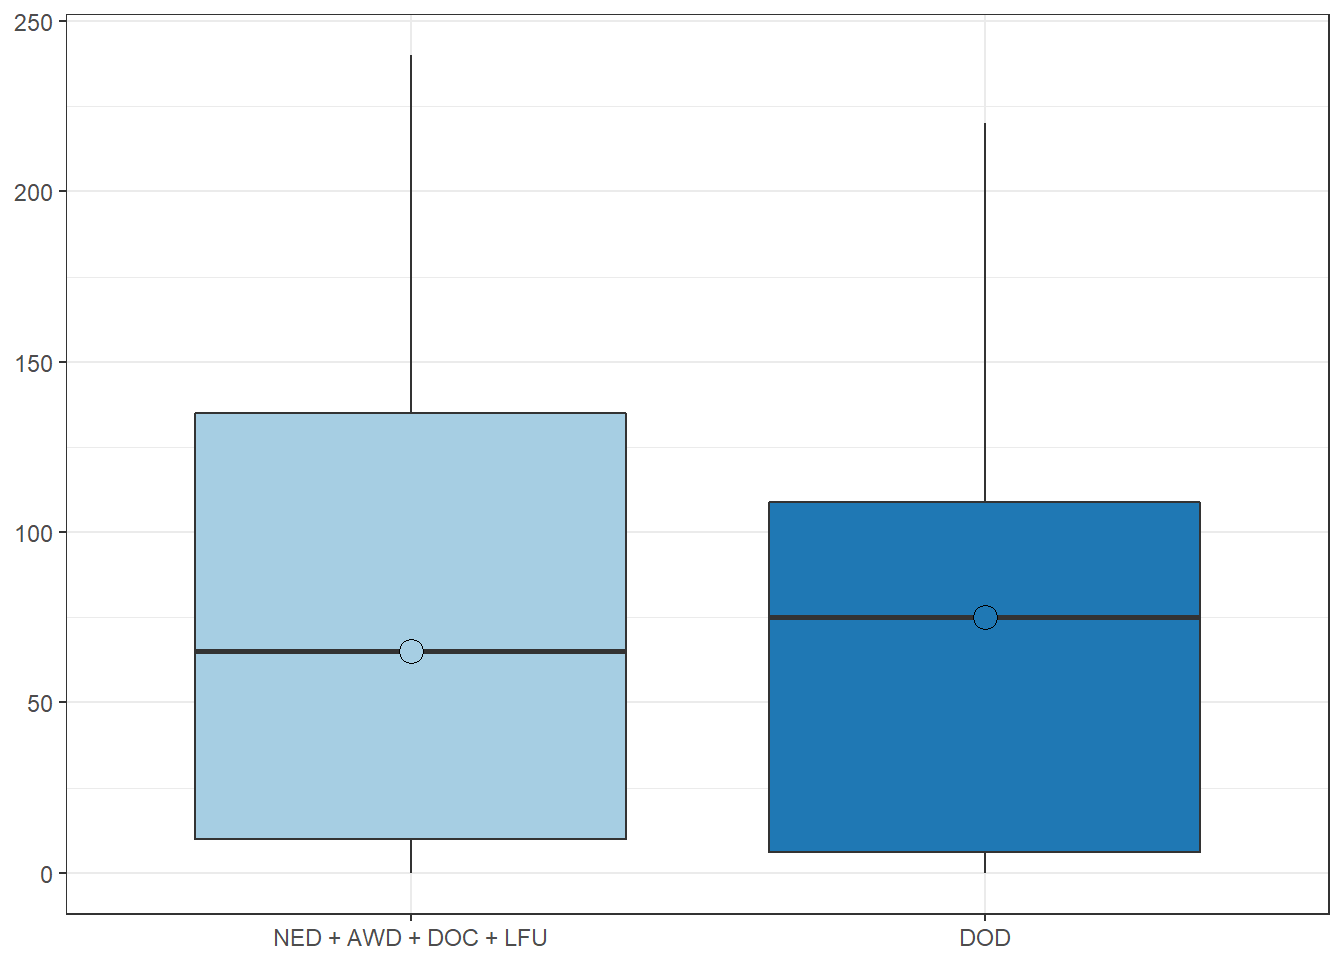
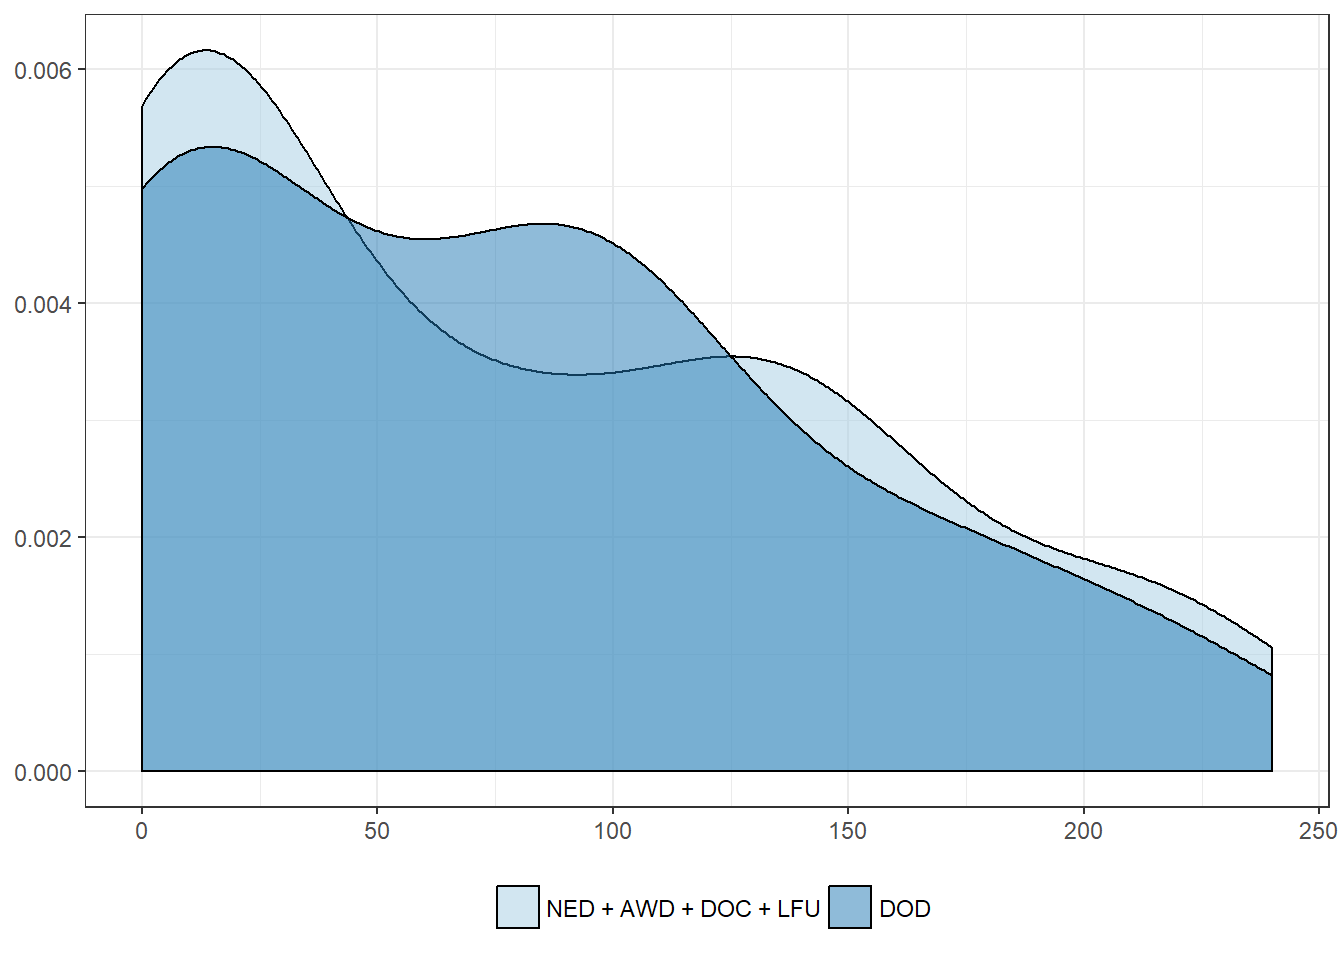
Cancer-related mortality
| NED + AWD + DOC + LFU | DOD | |
|---|---|---|
| Mean | 78.1 | 75.3 |
| Standard deviation | 73.0 | 68.6 |
| Median | 65.0 | 75.0 |
| Interquartile range | 125.0 | 102.5 |
| Minimum | 0.0 | 0.0 |
| Maximum | 240.0 | 220.0 |
| Value | |
|---|---|
| U-statistic | 1052 |
| P statistic | 9e-01 |