IFG1R maximum HER2 scores by cohort features
Clinical features
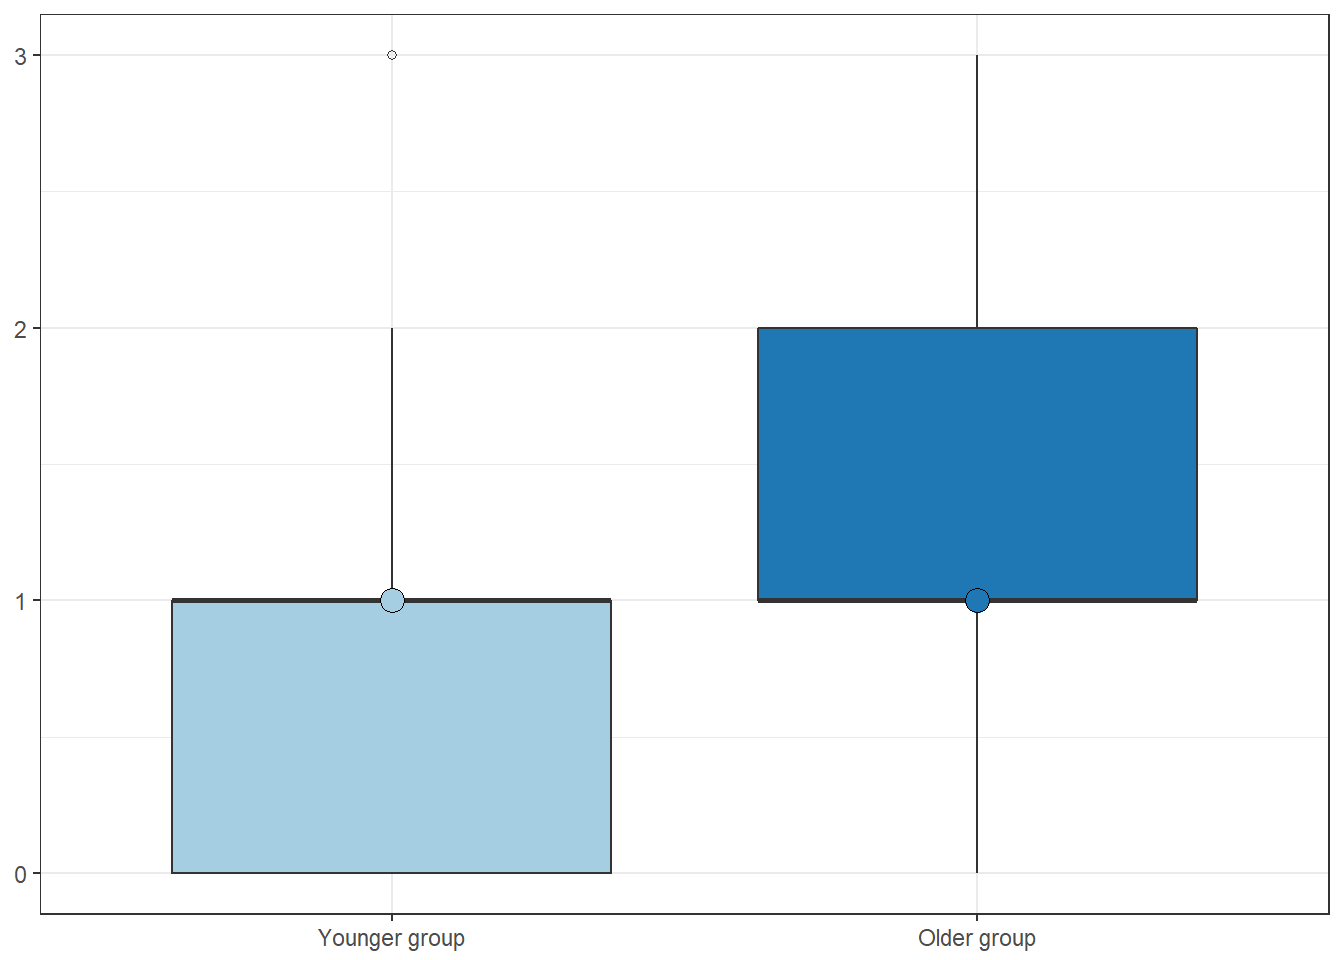
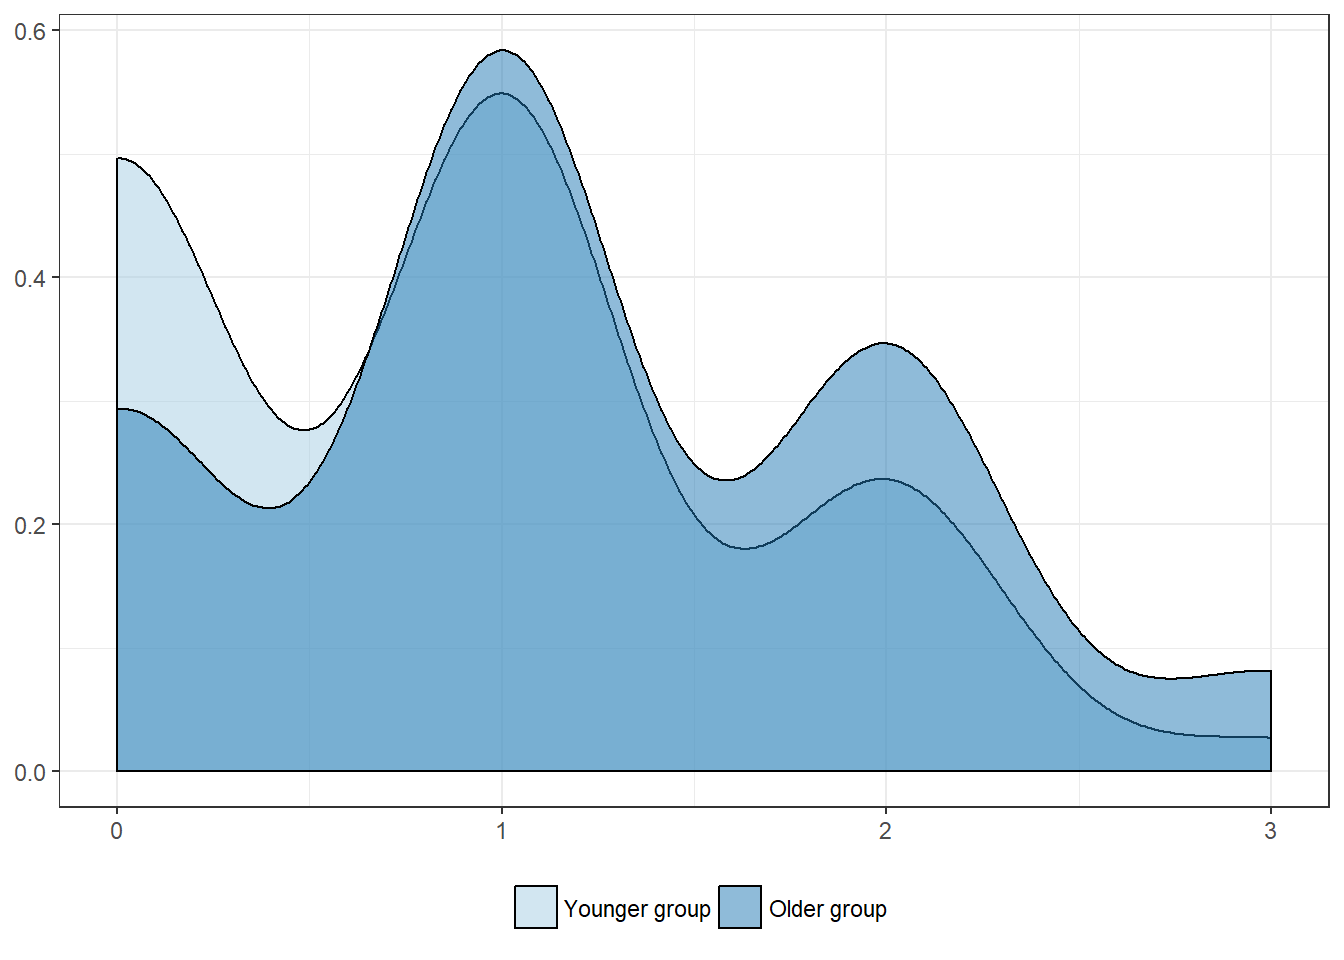
Age, in years
| Younger group | Older group | |
|---|---|---|
| Mean | 0.8 | 1.2 |
| Standard deviation | 0.8 | 0.9 |
| Median | 1.0 | 1.0 |
| Interquartile range | 1.0 | 1.0 |
| Minimum | 0.0 | 0.0 |
| Maximum | 3.0 | 3.0 |
| Value | |
|---|---|
| U-statistic | 970 |
| P statistic | 5.7e-02 |
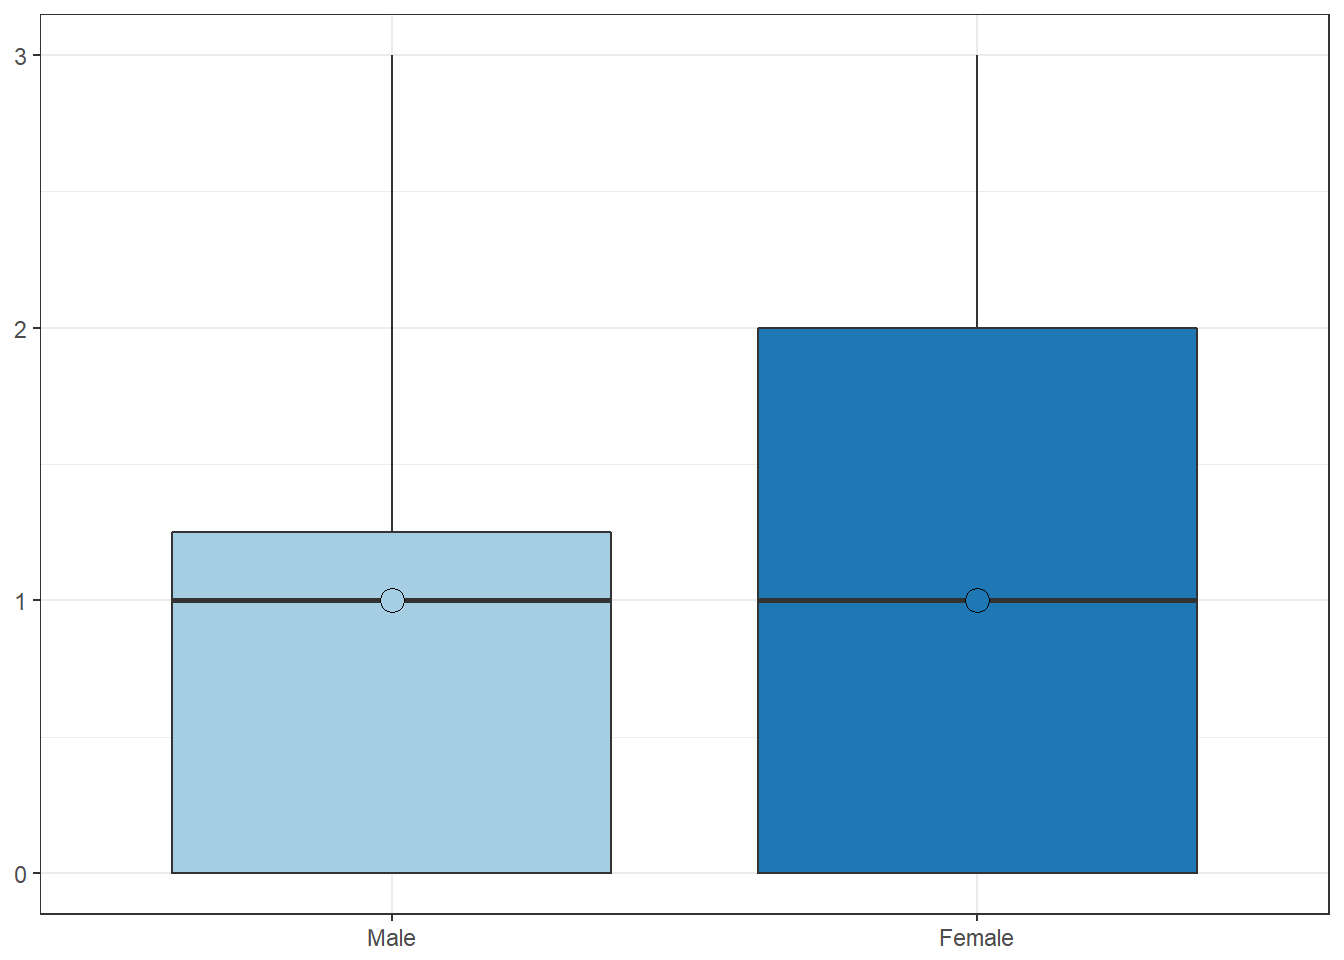
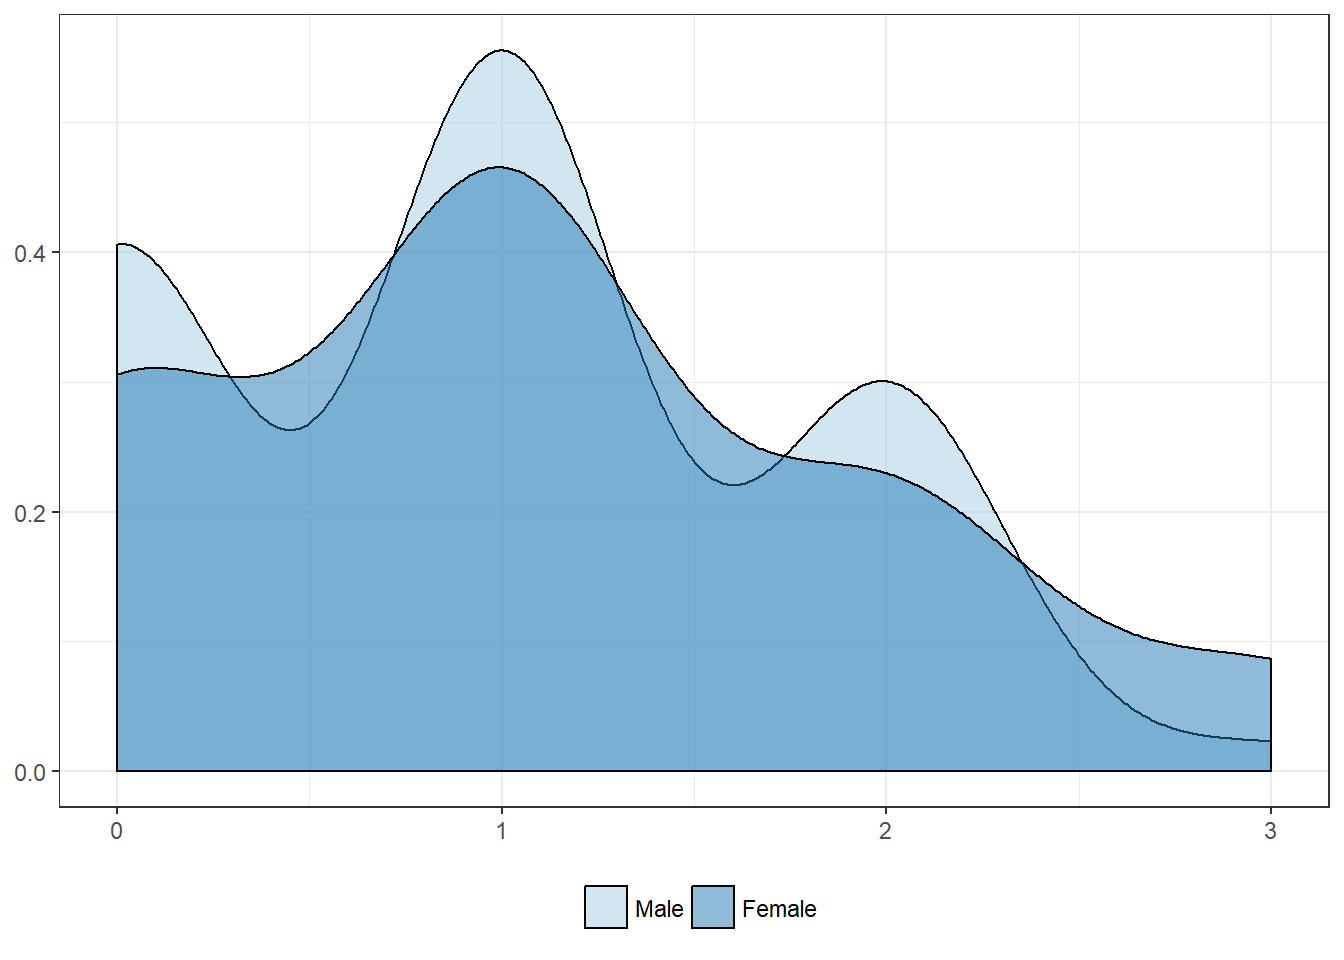
Sex
| Male | Female | |
|---|---|---|
| Mean | 1.0 | 1.1 |
| Standard deviation | 0.8 | 0.9 |
| Median | 1.0 | 1.0 |
| Interquartile range | 1.2 | 2.0 |
| Minimum | 0.0 | 0.0 |
| Maximum | 3.0 | 3.0 |
| Value | |
|---|---|
| U-statistic | 1097 |
| P statistic | 5.8e-01 |
Pathologic features
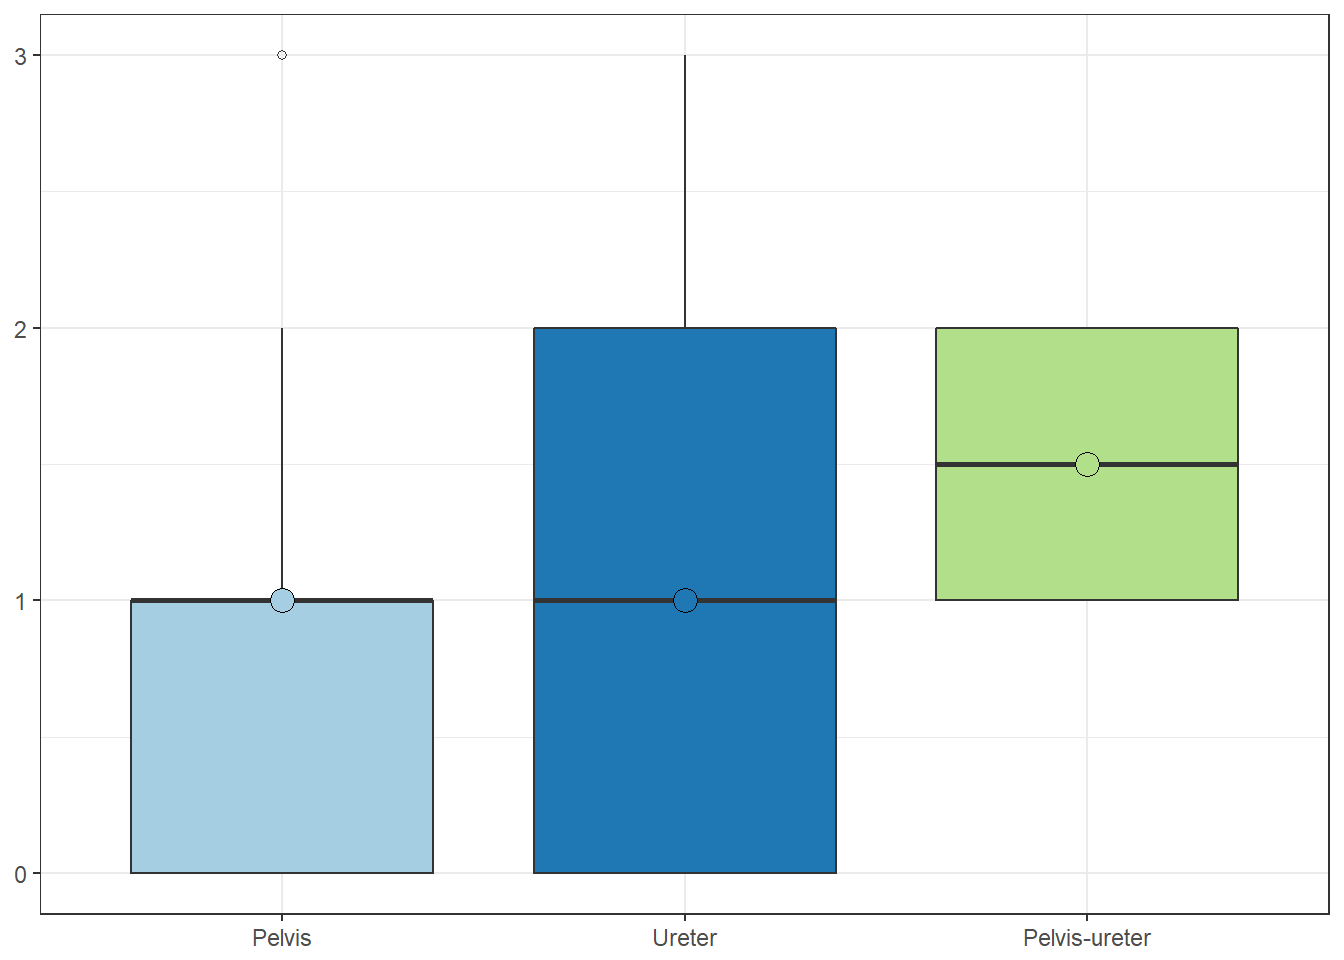
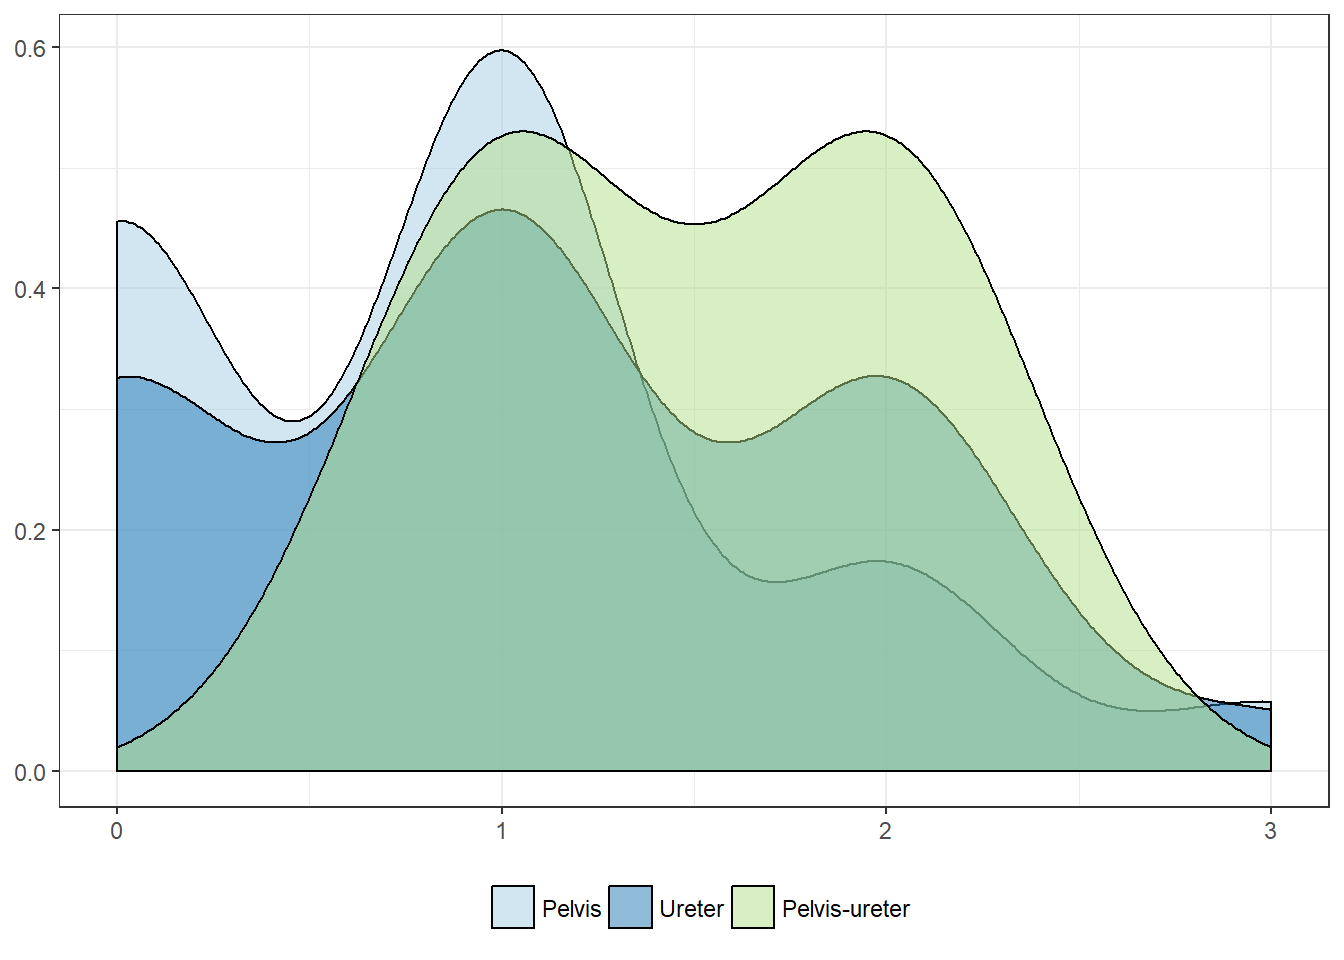
Tumor location
| Pelvis | Ureter | Pelvis-ureter | |
|---|---|---|---|
| Mean | 0.9 | 1.1 | 1.5 |
| Standard deviation | 0.8 | 0.9 | 0.6 |
| Median | 1.0 | 1.0 | 1.5 |
| Interquartile range | 1.0 | 2.0 | 1.0 |
| Minimum | 0.0 | 0.0 | 1.0 |
| Maximum | 3.0 | 3.0 | 2.0 |
| Value | |
|---|---|
| Statistic | 3.664 |
| Parameter | 2 |
| P statistic | 0.16 |
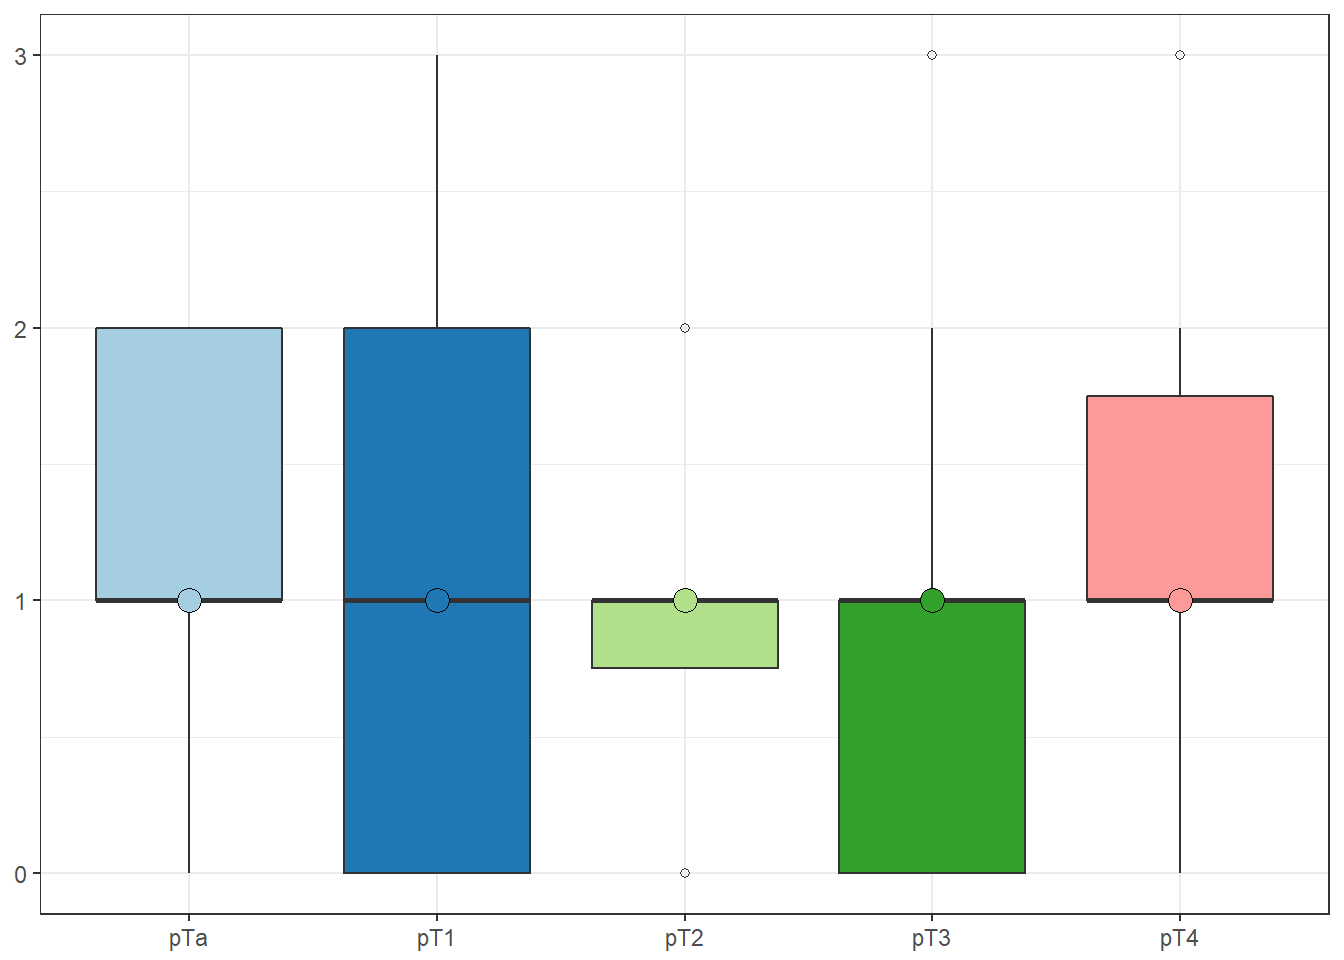
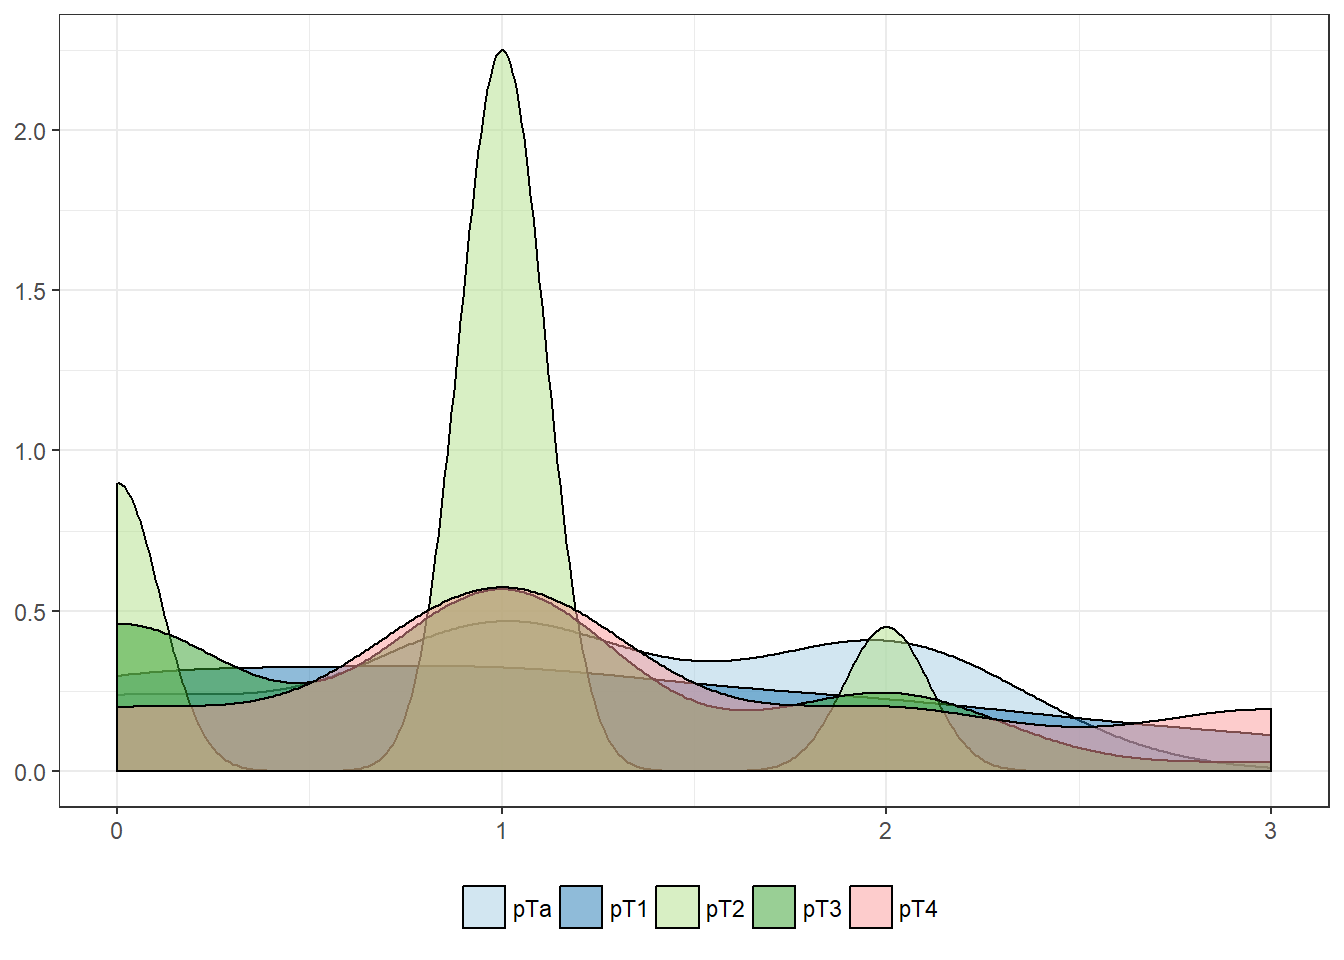
pT stage
| pTa | pT1 | pT2 | pT3 | pT4 | |
|---|---|---|---|---|---|
| Mean | 1.2 | 1.1 | 0.9 | 0.9 | 1.3 |
| Standard deviation | 0.8 | 1.0 | 0.6 | 0.8 | 1.0 |
| Median | 1.0 | 1.0 | 1.0 | 1.0 | 1.0 |
| Interquartile range | 1.0 | 2.0 | 0.2 | 1.0 | 0.8 |
| Minimum | 0.0 | 0.0 | 0.0 | 0.0 | 0.0 |
| Maximum | 2.0 | 3.0 | 2.0 | 3.0 | 3.0 |
| Value | |
|---|---|
| Statistic | 2.907 |
| Parameter | 4 |
| P statistic | 0.57 |
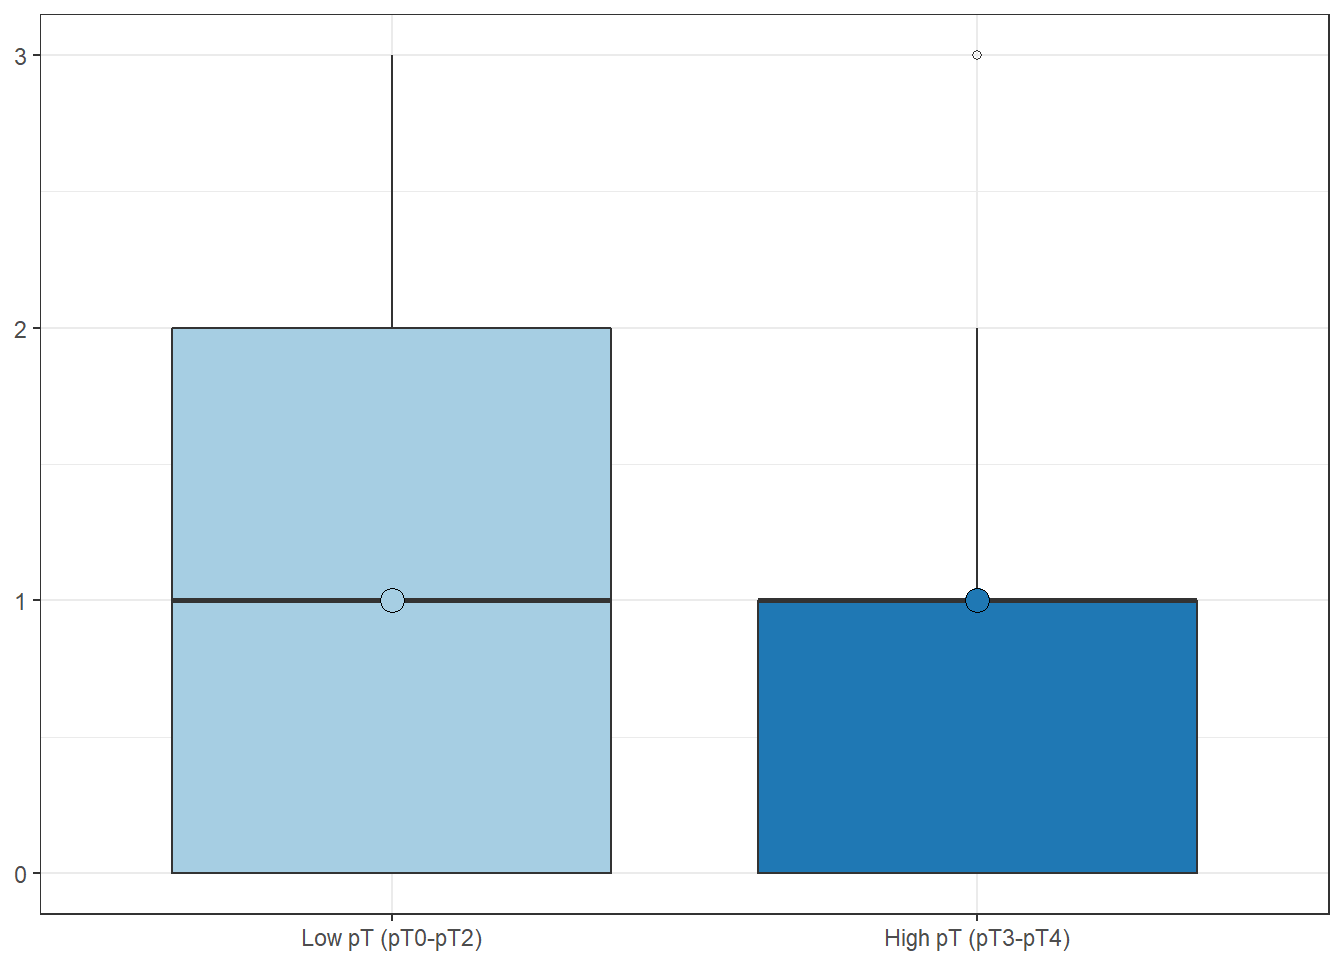
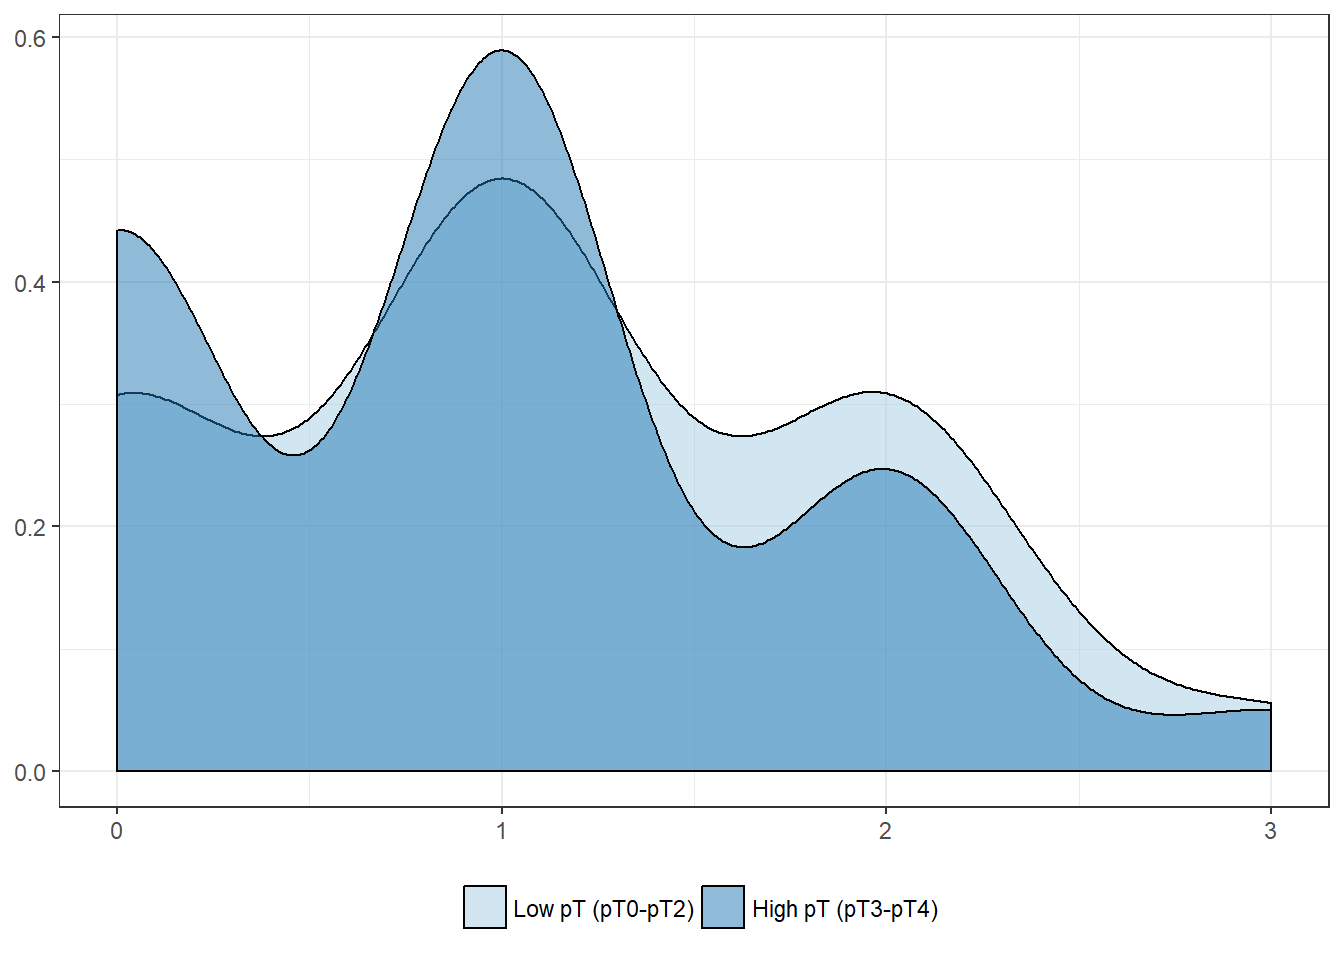
High pT stage (> pT2)
| Low pT (pT0-pT2) | High pT (pT3-pT4) | |
|---|---|---|
| Mean | 1.1 | 0.9 |
| Standard deviation | 0.8 | 0.8 |
| Median | 1.0 | 1.0 |
| Interquartile range | 2.0 | 1.0 |
| Minimum | 0.0 | 0.0 |
| Maximum | 3.0 | 3.0 |
| Value | |
|---|---|
| U-statistic | 1348 |
| P statistic | 3.2e-01 |
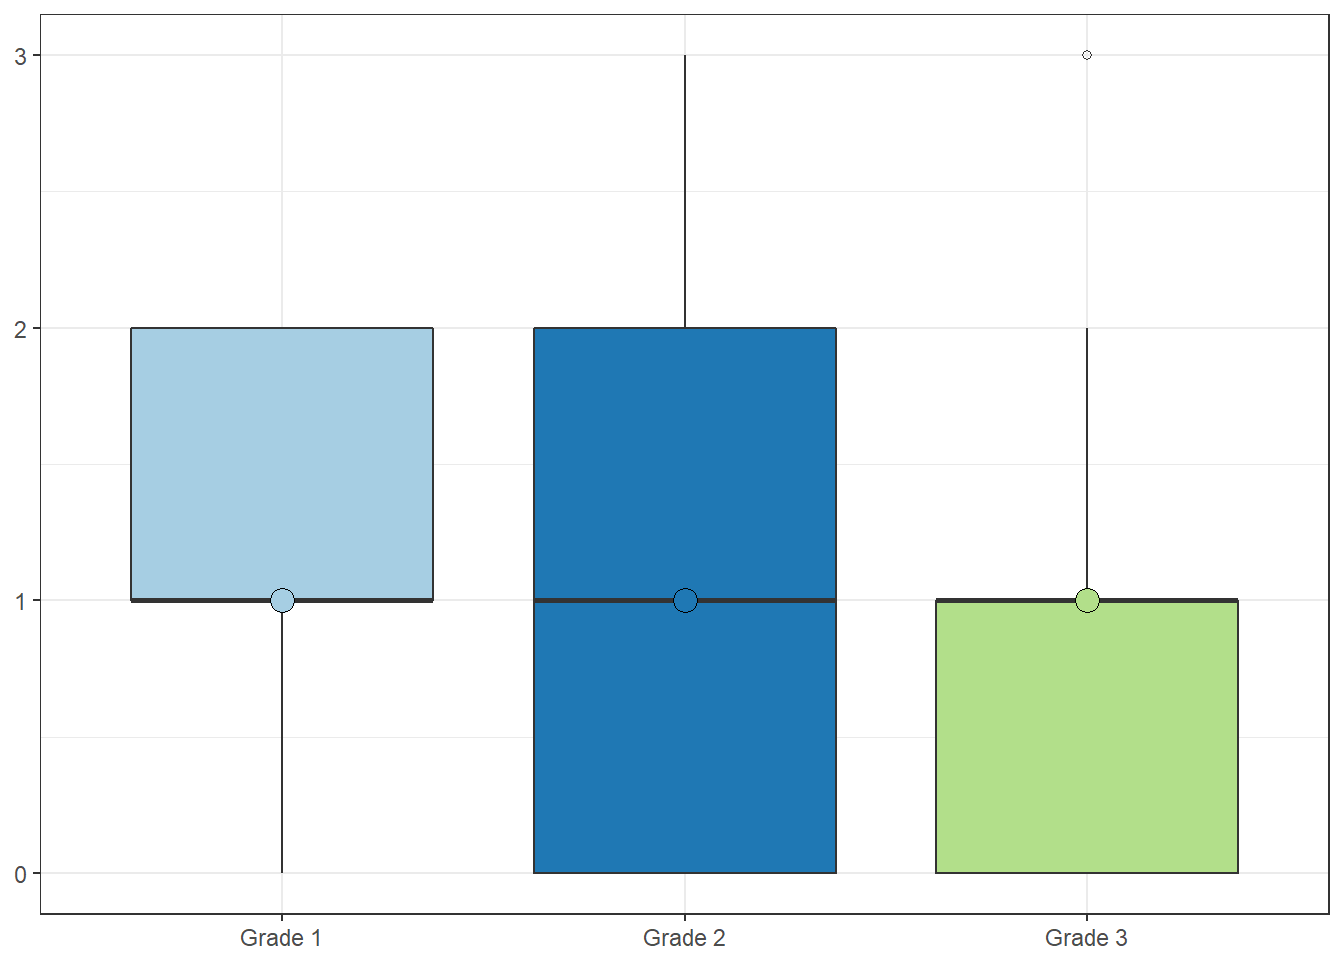
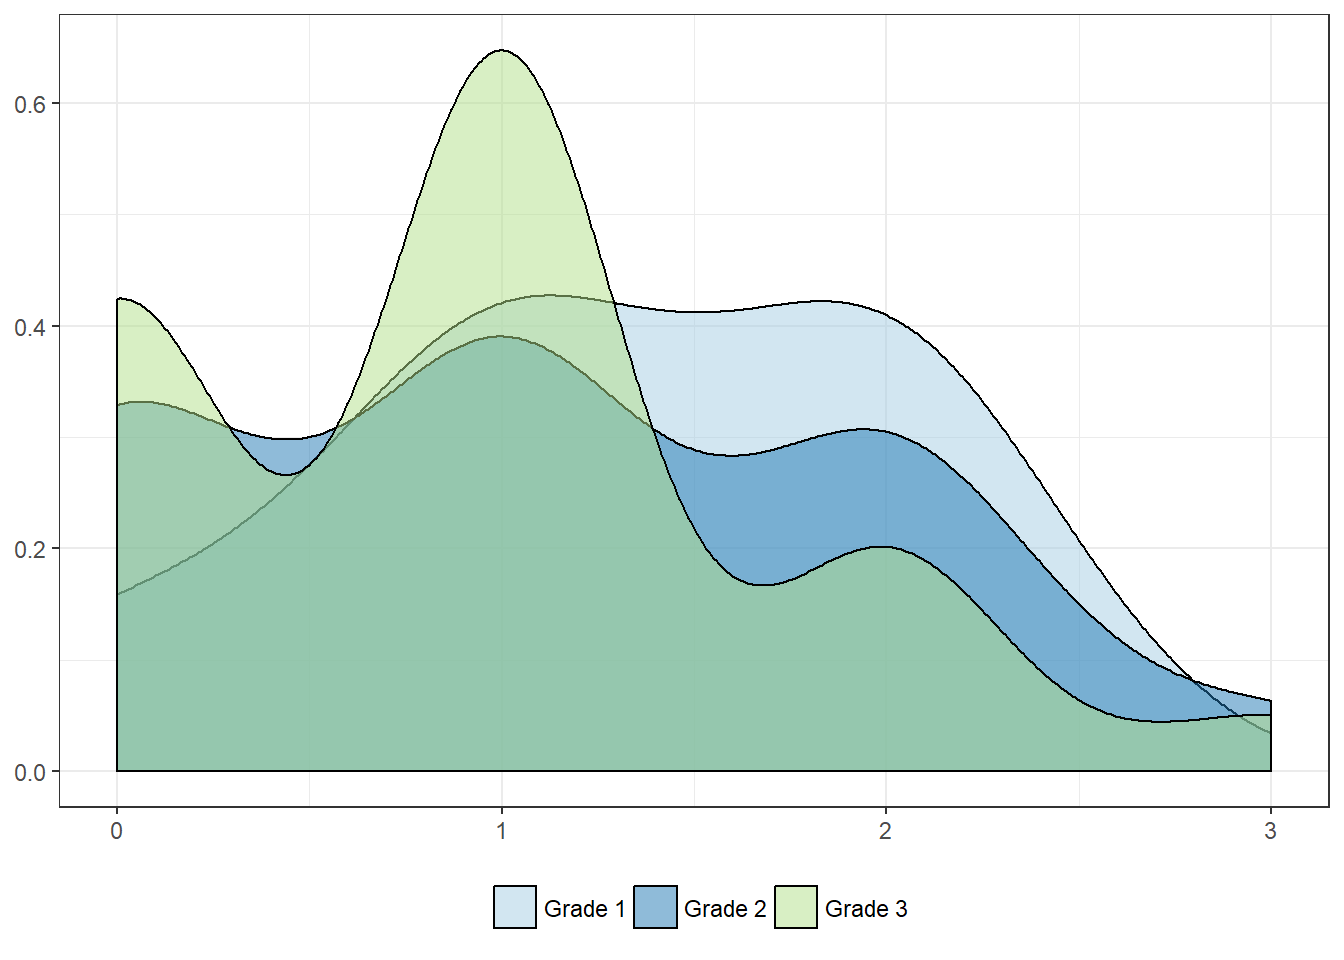
Histologic grade
| Grade 1 | Grade 2 | Grade 3 | |
|---|---|---|---|
| Mean | 1.3 | 1.1 | 0.9 |
| Standard deviation | 0.8 | 0.9 | 0.8 |
| Median | 1.0 | 1.0 | 1.0 |
| Interquartile range | 1.0 | 2.0 | 1.0 |
| Minimum | 0.0 | 0.0 | 0.0 |
| Maximum | 2.0 | 3.0 | 3.0 |
| Value | |
|---|---|
| Statistic | 2.08 |
| Parameter | 2 |
| P statistic | 0.35 |
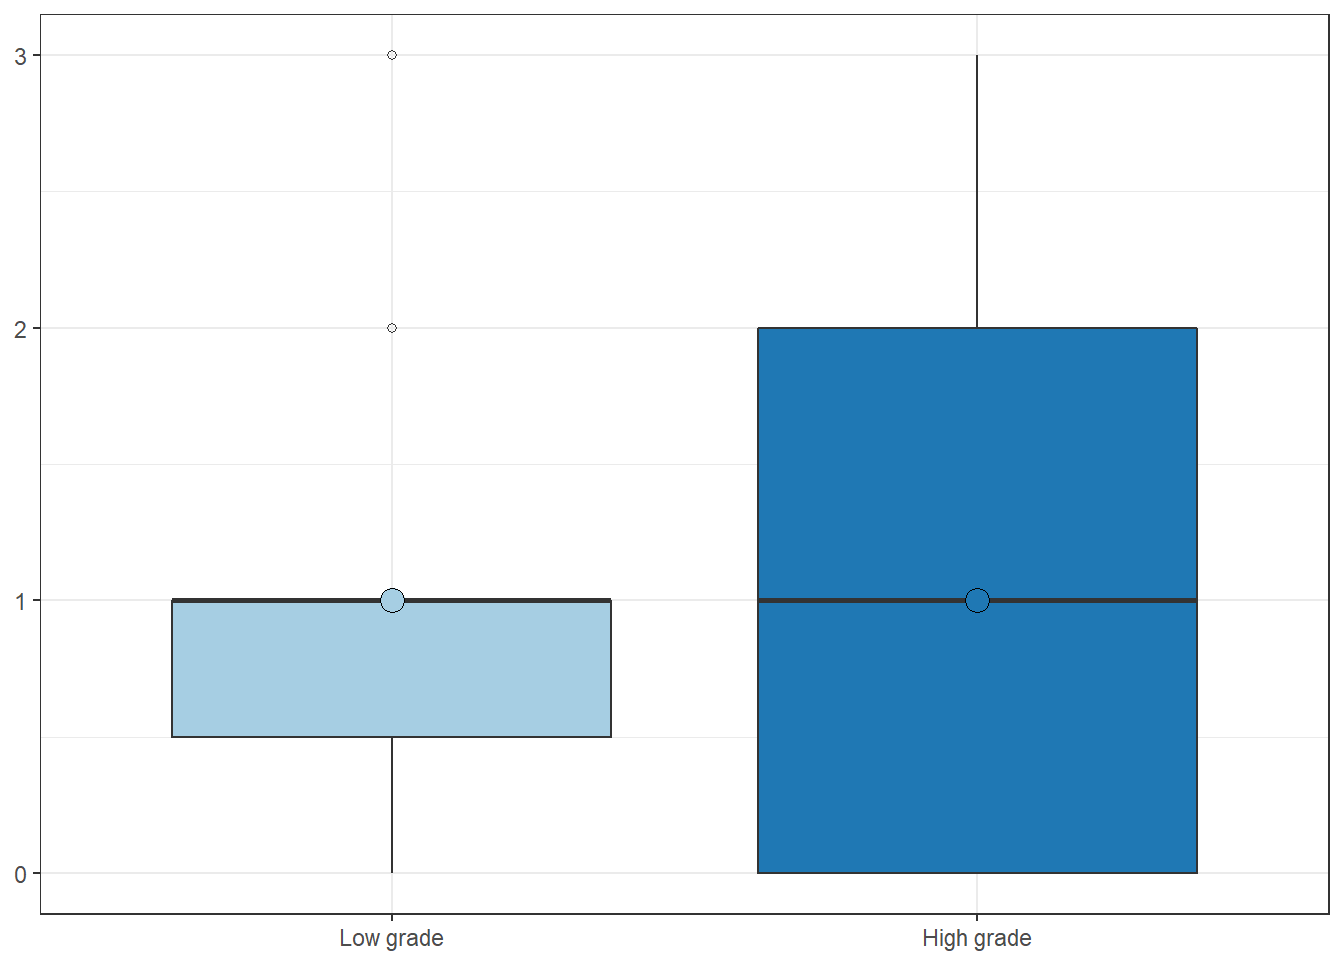
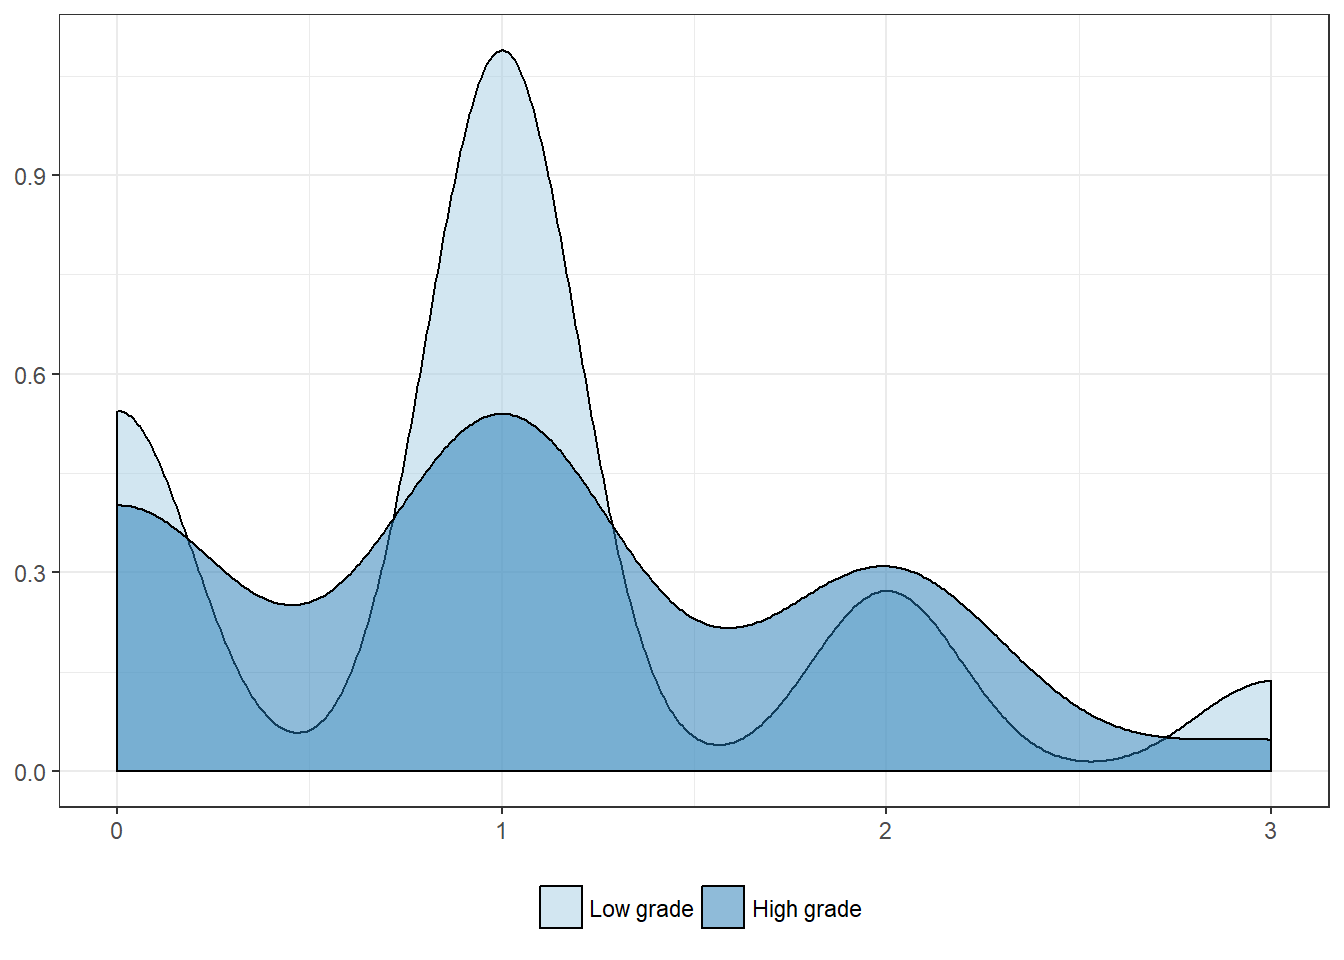
WHO histologic grade
| Low grade | High grade | |
|---|---|---|
| Mean | 1.0 | 1.0 |
| Standard deviation | 0.8 | 0.8 |
| Median | 1.0 | 1.0 |
| Interquartile range | 0.5 | 2.0 |
| Minimum | 0.0 | 0.0 |
| Maximum | 3.0 | 3.0 |
| Value | |
|---|---|
| U-statistic | 624 |
| P statistic | 9.6e-01 |
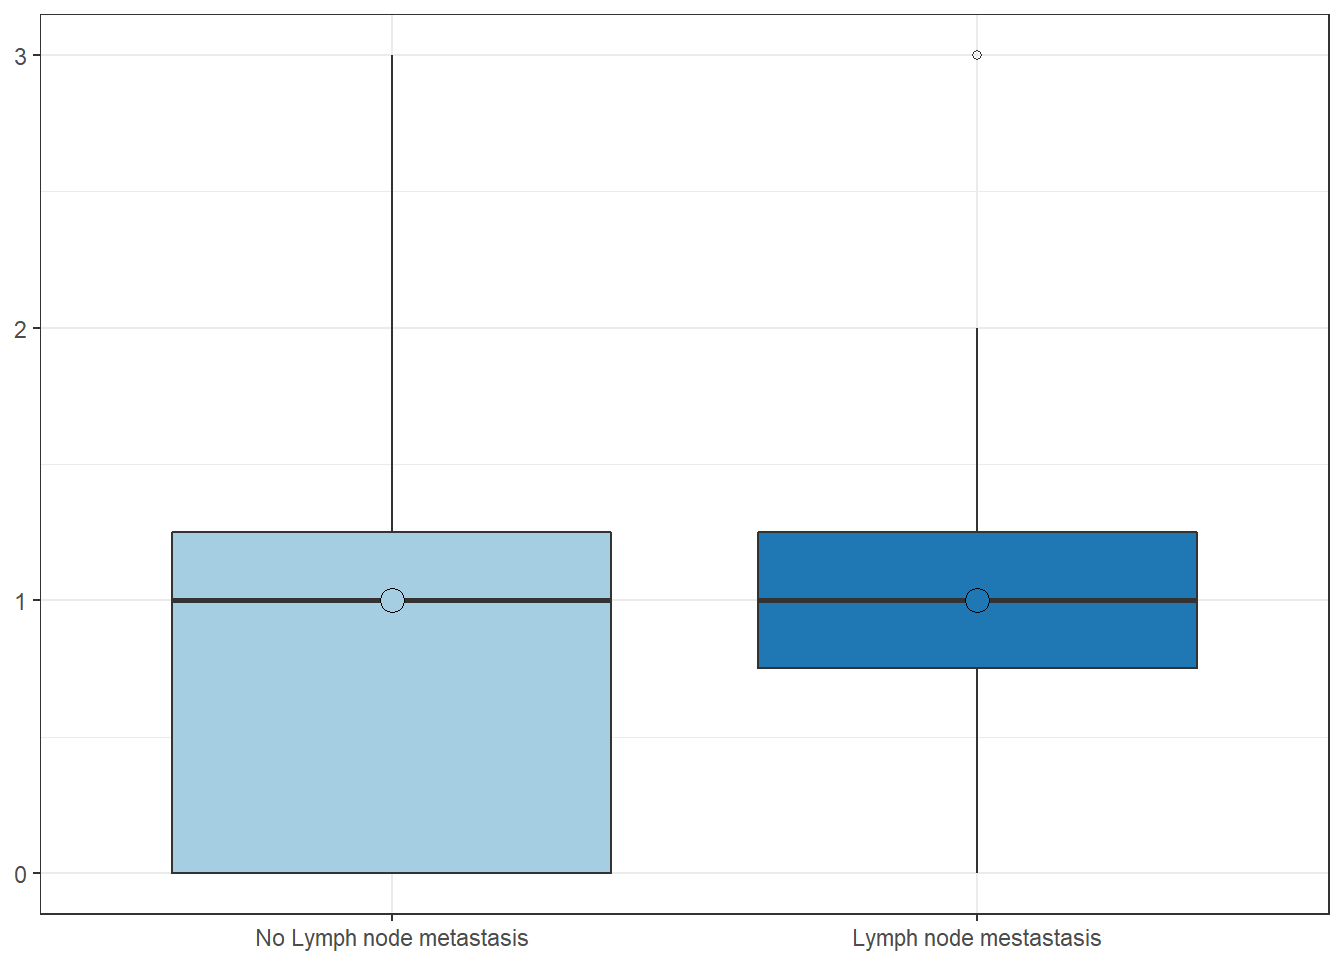
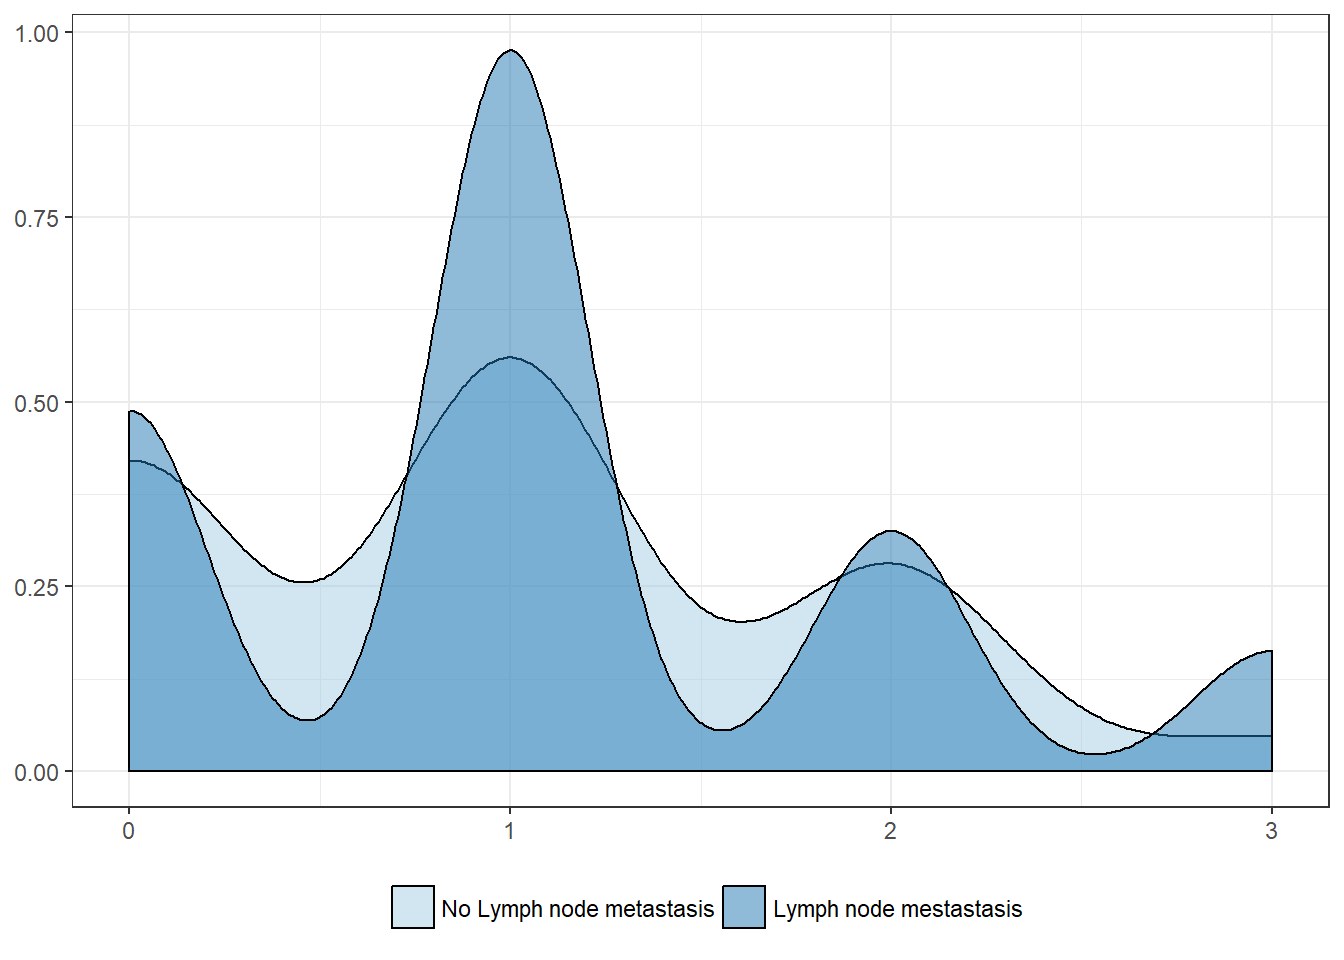
Lymph nodes metastasis
| No Lymph node metastasis | Lymph node mestastasis | |
|---|---|---|
| Mean | 1.0 | 1.1 |
| Standard deviation | 0.8 | 0.9 |
| Median | 1.0 | 1.0 |
| Interquartile range | 1.2 | 0.5 |
| Minimum | 0.0 | 0.0 |
| Maximum | 3.0 | 3.0 |
| Value | |
|---|---|
| U-statistic | 471 |
| P statistic | 7e-01 |
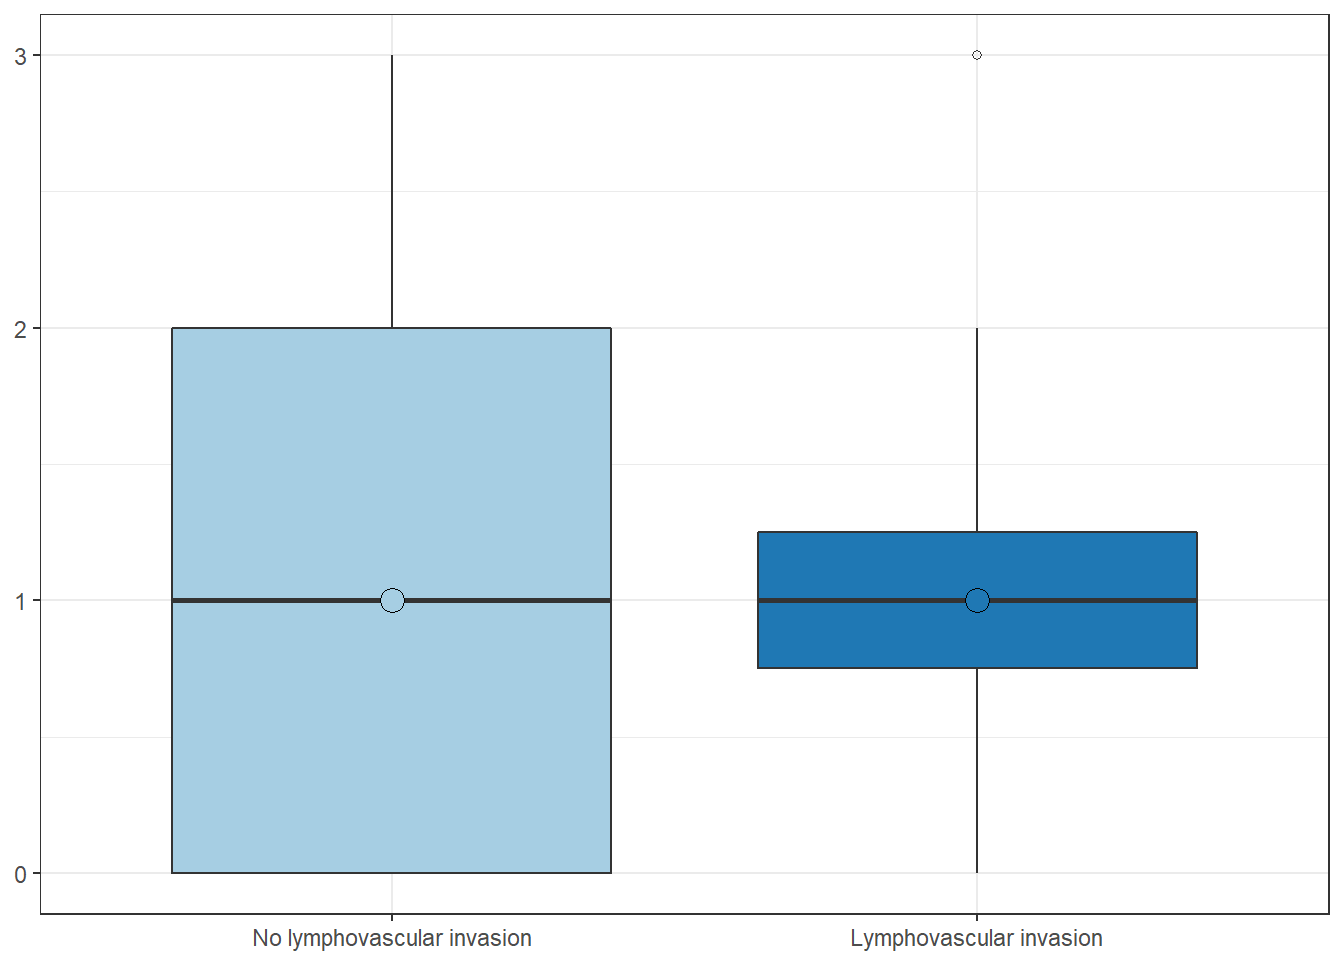
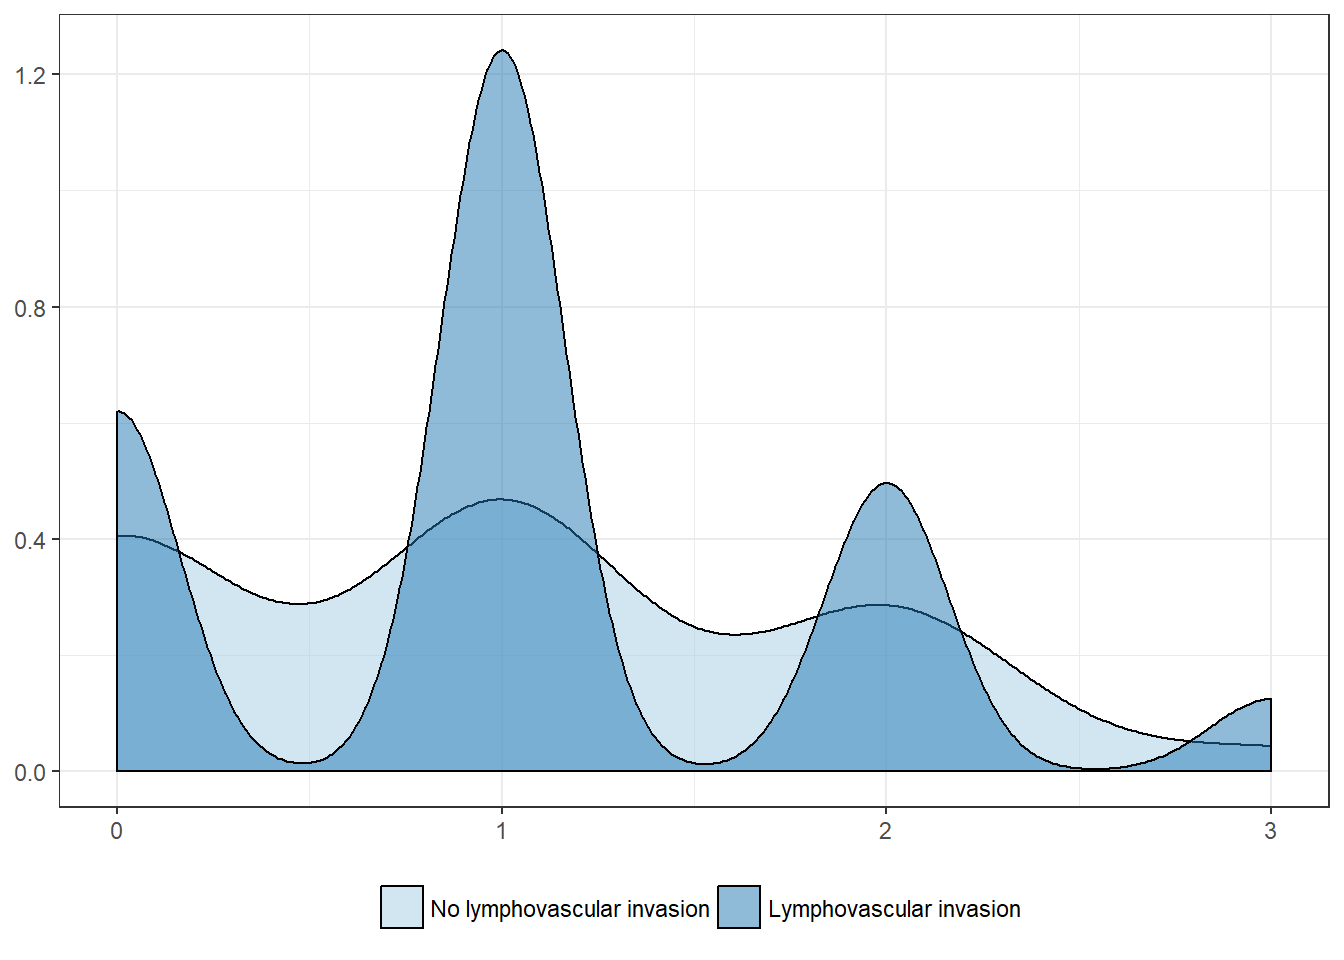
Lymphovascular invasion
| No lymphovascular invasion | Lymphovascular invasion | |
|---|---|---|
| Mean | 1.0 | 1.1 |
| Standard deviation | 0.9 | 0.8 |
| Median | 1.0 | 1.0 |
| Interquartile range | 2.0 | 0.5 |
| Minimum | 0.0 | 0.0 |
| Maximum | 3.0 | 3.0 |
| Value | |
|---|---|
| U-statistic | 1114 |
| P statistic | 6.2e-01 |
Outcome
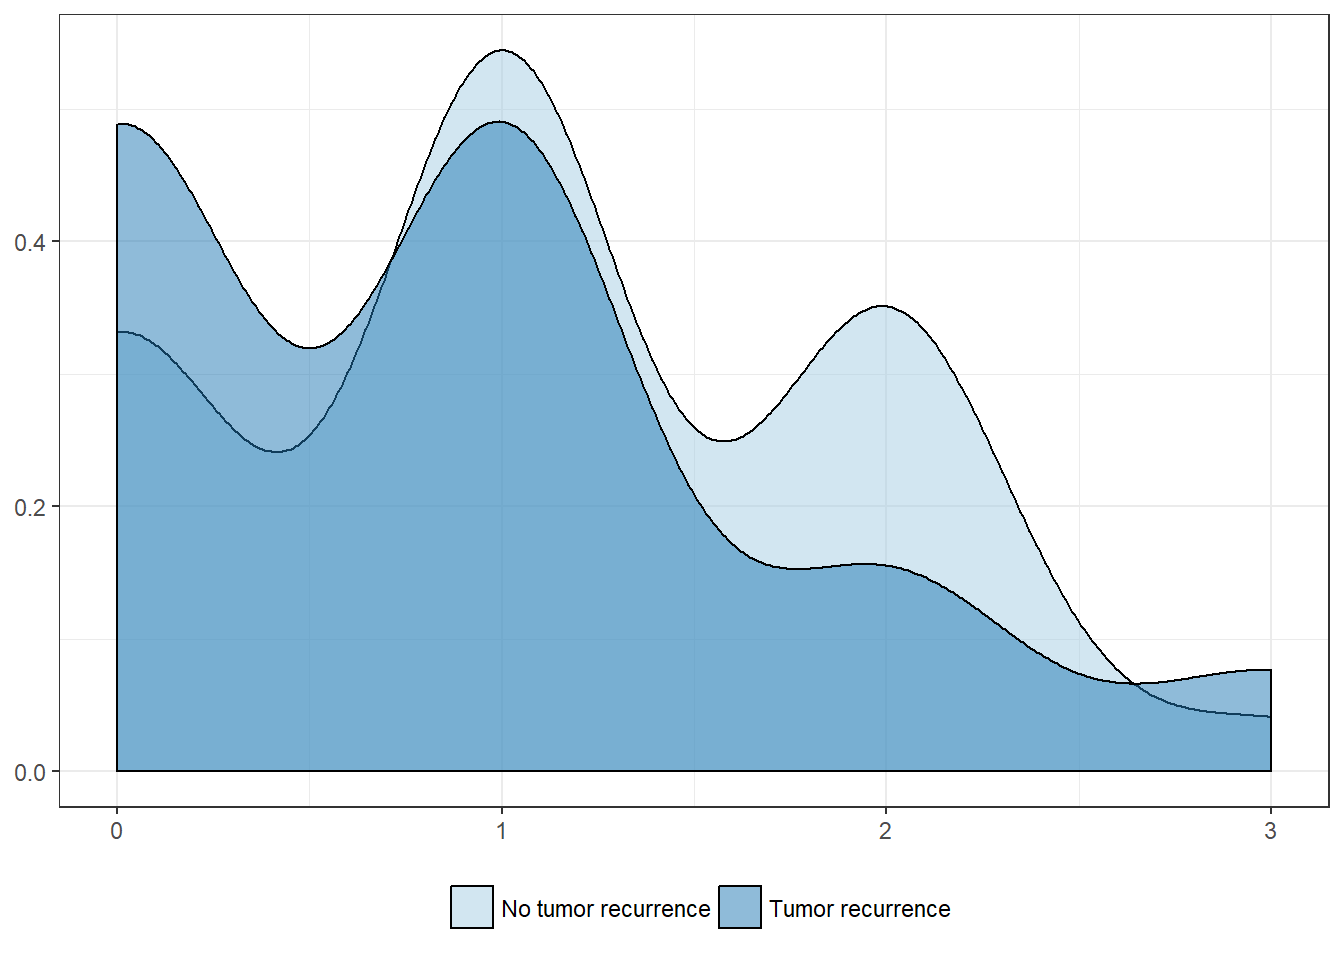
Tumor recurrence
| No tumor recurrence | Tumor recurrence | |
|---|---|---|
| Mean | 1.1 | 0.8 |
| Standard deviation | 0.8 | 0.9 |
| Median | 1.0 | 1.0 |
| Interquartile range | 2.0 | 1.0 |
| Minimum | 0.0 | 0.0 |
| Maximum | 3.0 | 3.0 |
| Value | |
|---|---|
| U-statistic | 1222 |
| P statistic | 1.4e-01 |

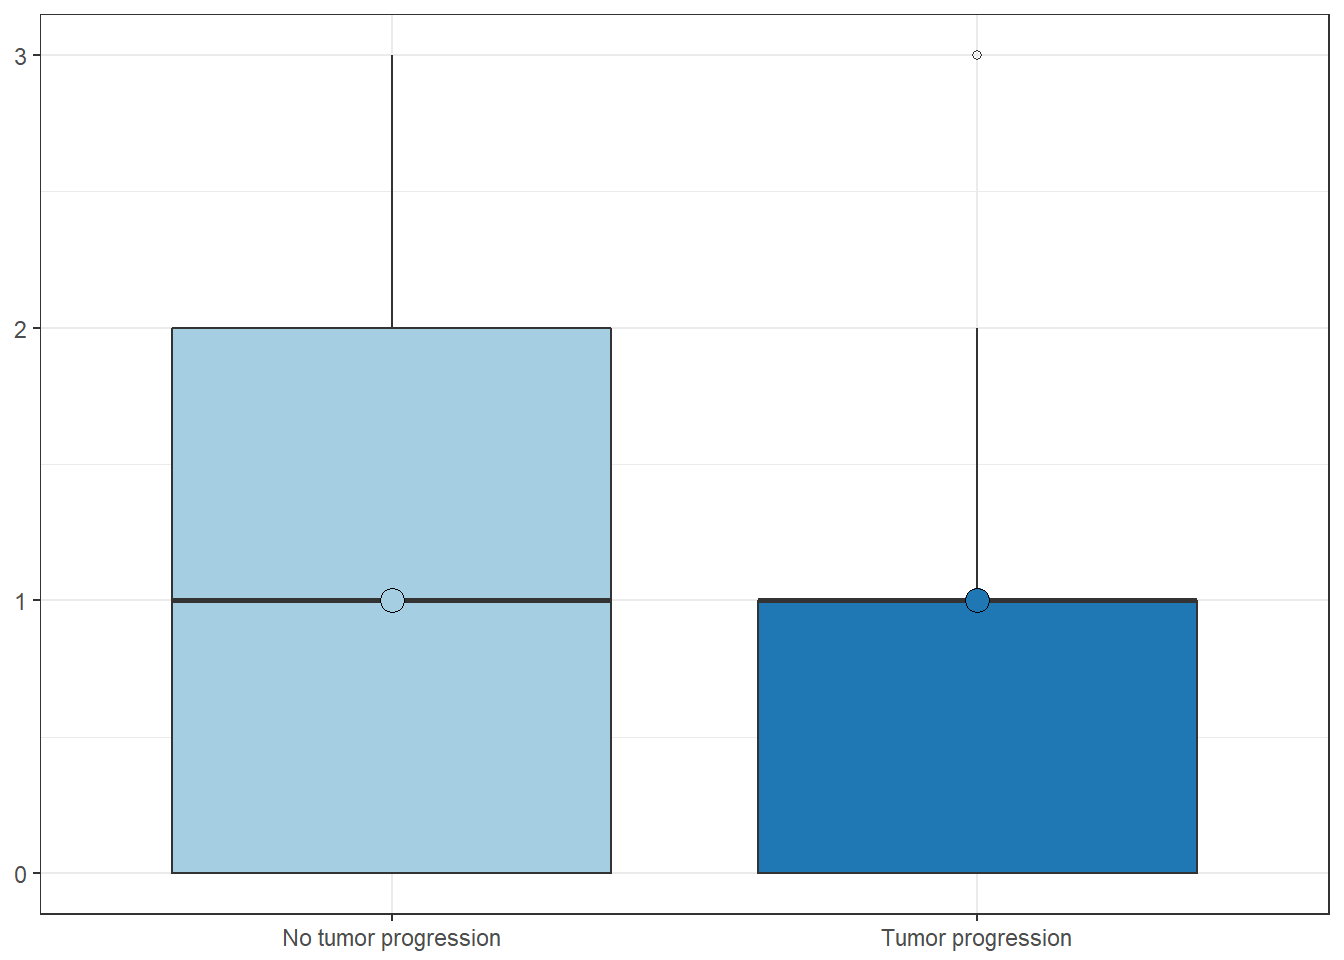
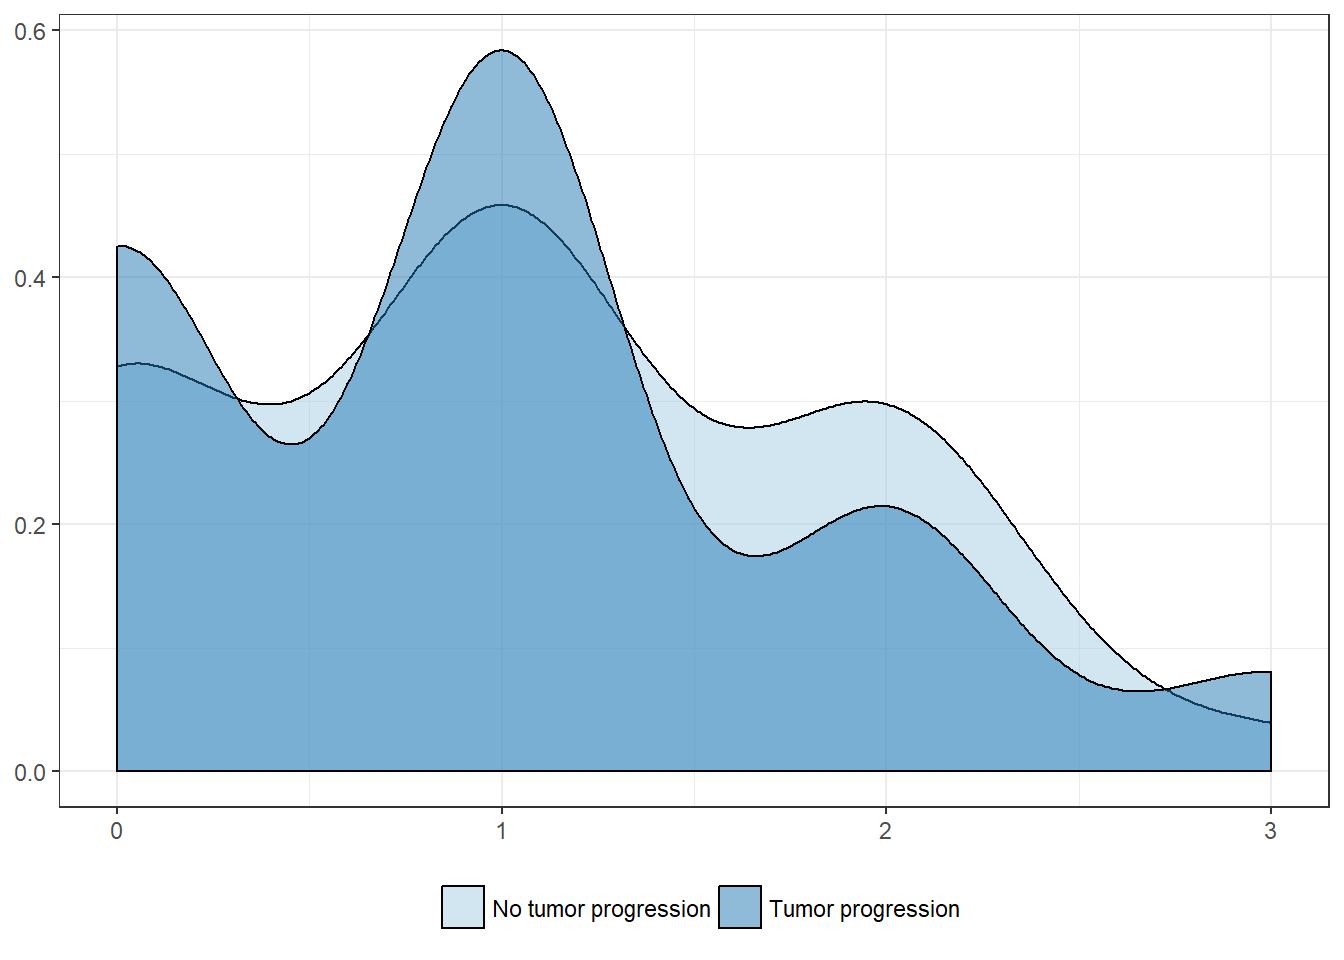
Tumor progression
| No tumor progression | Tumor progression | |
|---|---|---|
| Mean | 1.0 | 1.0 |
| Standard deviation | 0.8 | 0.9 |
| Median | 1.0 | 1.0 |
| Interquartile range | 2.0 | 1.0 |
| Minimum | 0.0 | 0.0 |
| Maximum | 3.0 | 3.0 |
| Value | |
|---|---|
| U-statistic | 884 |
| P statistic | 6.2e-01 |
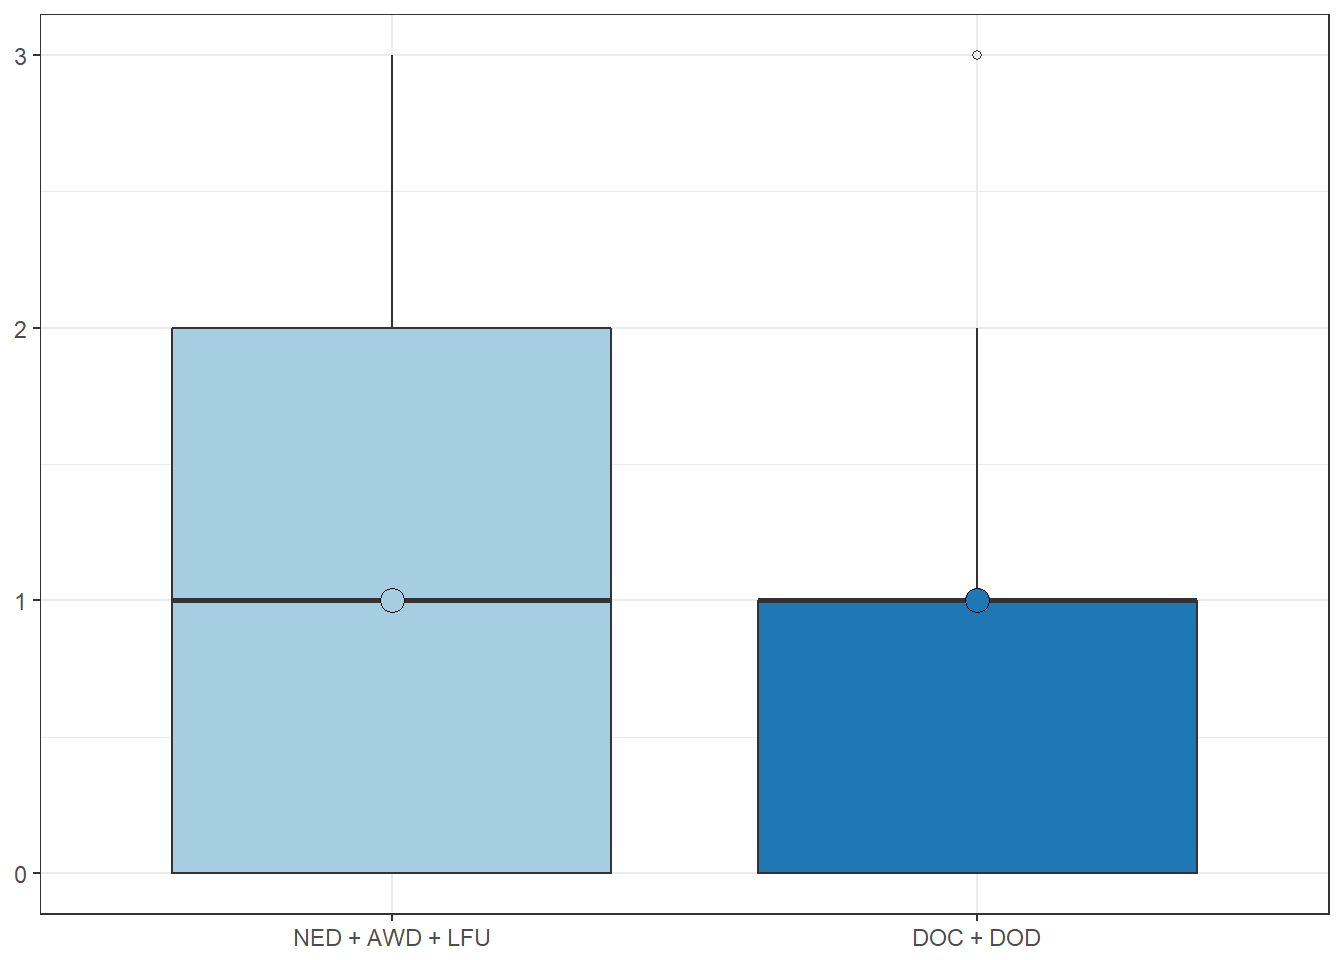
Overall mortality
| NED + AWD + LFU | DOC + DOD | |
|---|---|---|
| Mean | 1.0 | 0.9 |
| Standard deviation | 0.9 | 0.8 |
| Median | 1.0 | 1.0 |
| Interquartile range | 2.0 | 1.0 |
| Minimum | 0.0 | 0.0 |
| Maximum | 3.0 | 3.0 |
| Value | |
|---|---|
| U-statistic | 1180 |
| P statistic | 4.7e-01 |

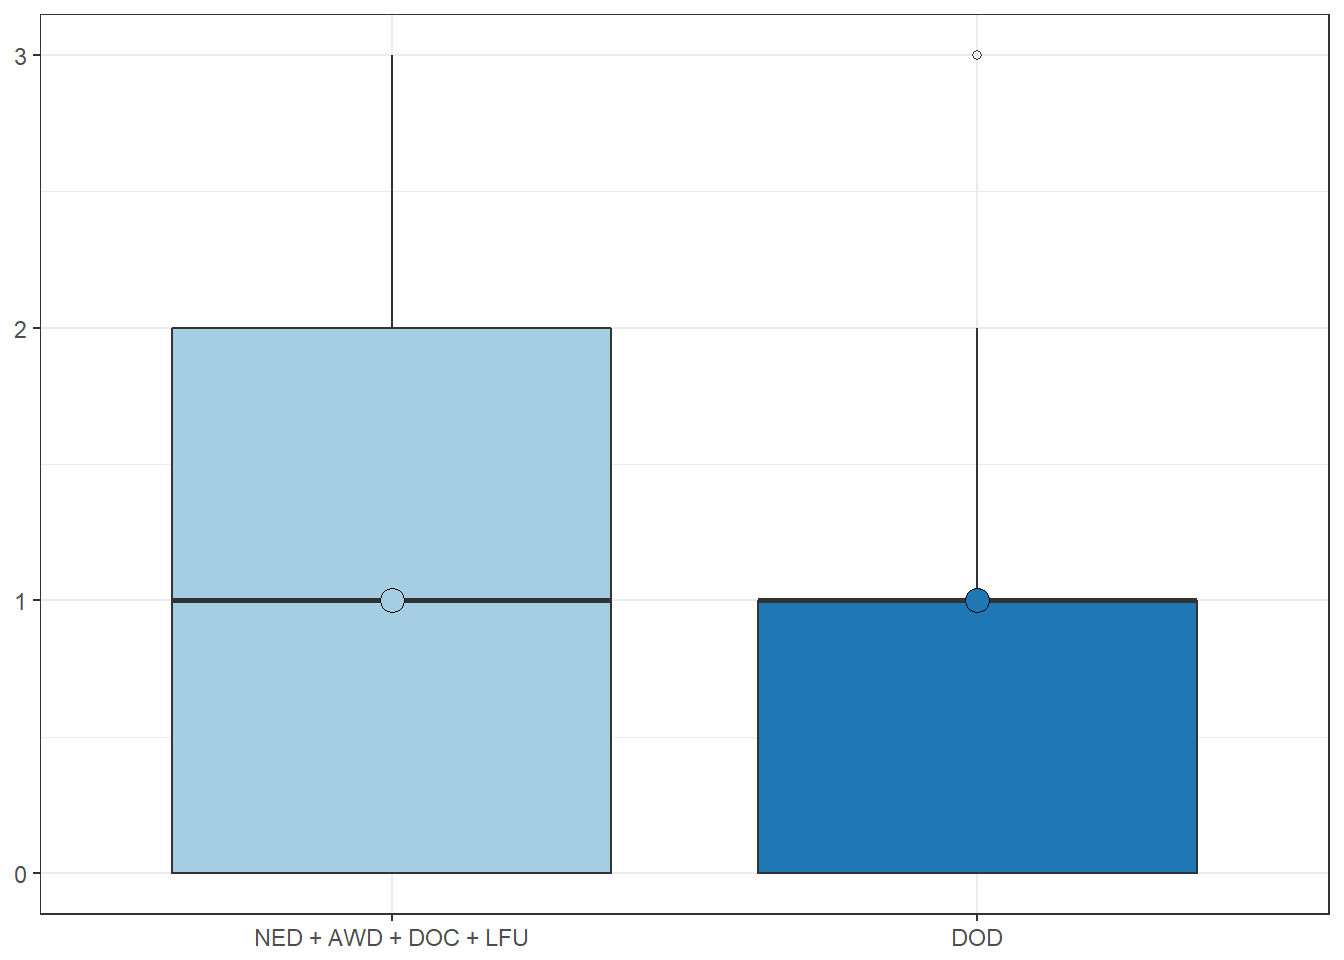
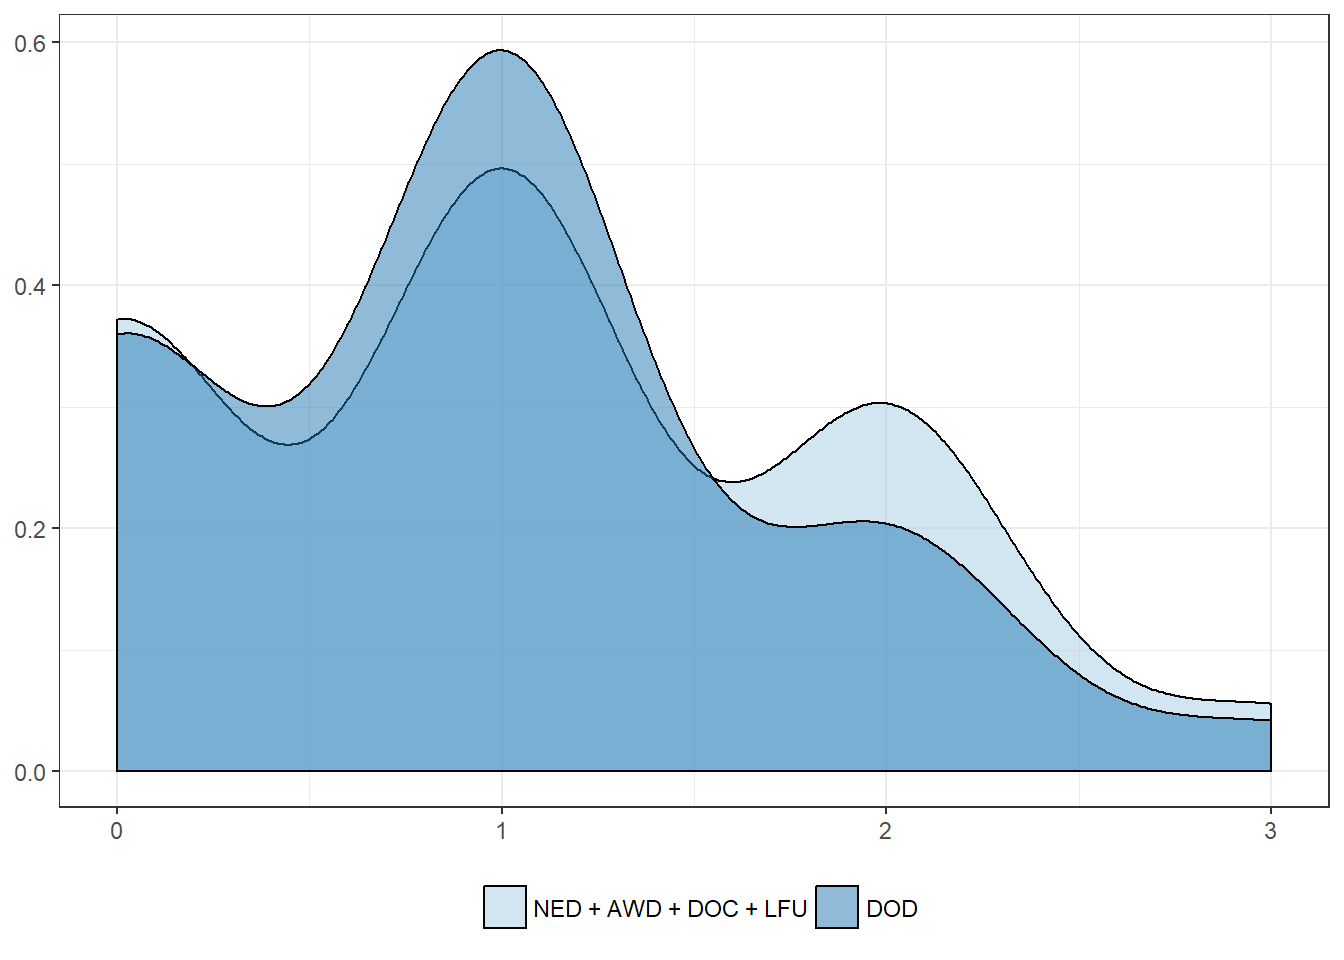
Cancer-related mortality
| NED + AWD + DOC + LFU | DOD | |
|---|---|---|
| Mean | 1.0 | 0.9 |
| Standard deviation | 0.9 | 0.8 |
| Median | 1.0 | 1.0 |
| Interquartile range | 2.0 | 1.0 |
| Minimum | 0.0 | 0.0 |
| Maximum | 3.0 | 3.0 |
| Value | |
|---|---|
| U-statistic | 1096 |
| P statistic | 6.3e-01 |