IFG1R median H-scores by cohort features
Clinical features
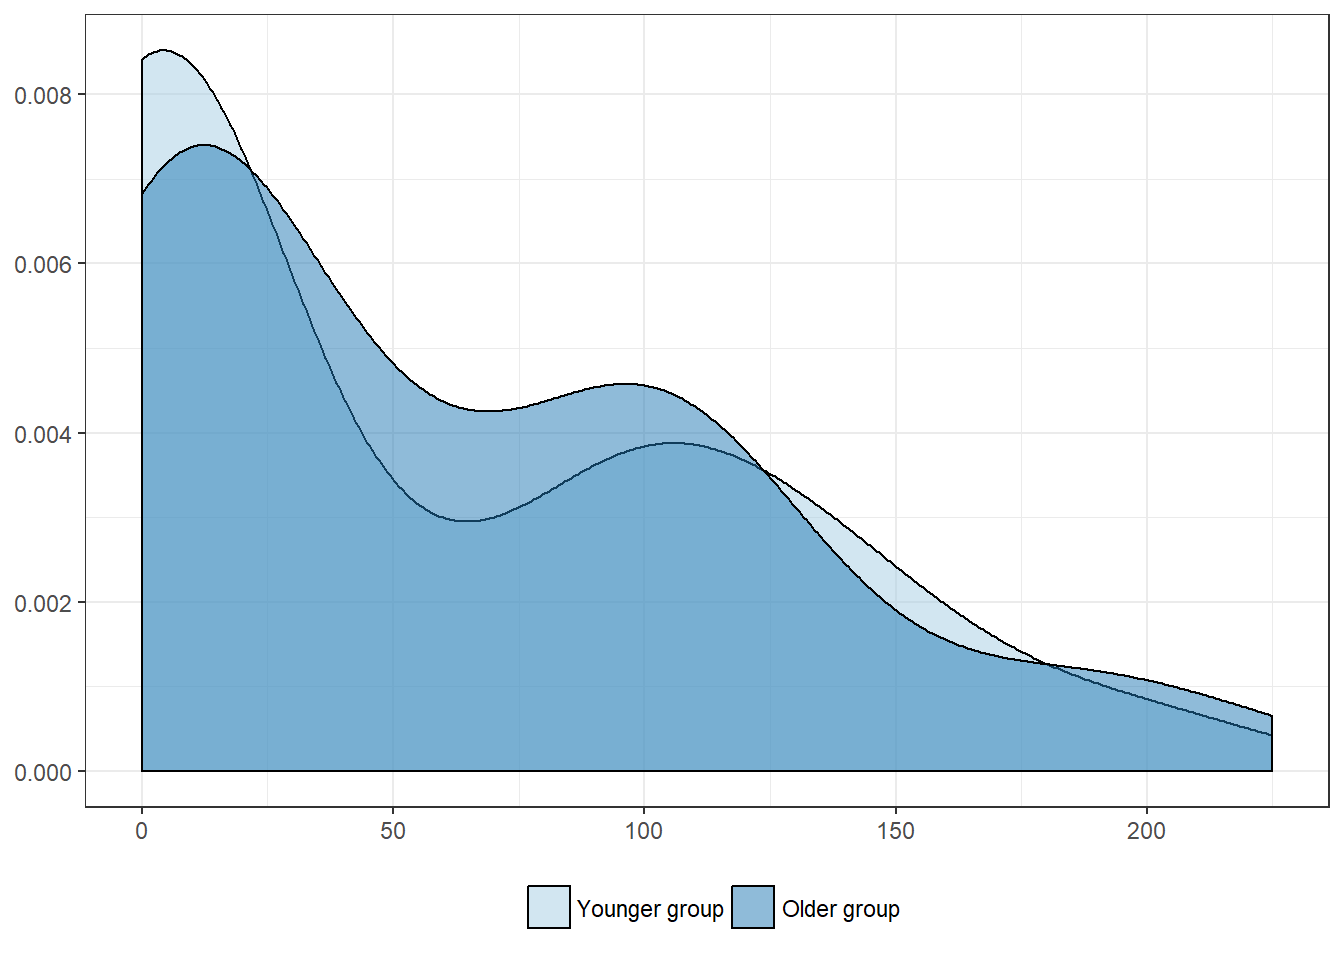
Age, in years
| Younger group | Older group | |
|---|---|---|
| Mean | 53.1 | 61.5 |
| Standard deviation | 62.3 | 61.1 |
| Median | 8.0 | 45.0 |
| Interquartile range | 99.0 | 94.5 |
| Minimum | 0.0 | 0.0 |
| Maximum | 210.0 | 225.0 |
| Value | |
|---|---|
| U-statistic | 1086 |
| P statistic | 3.3e-01 |

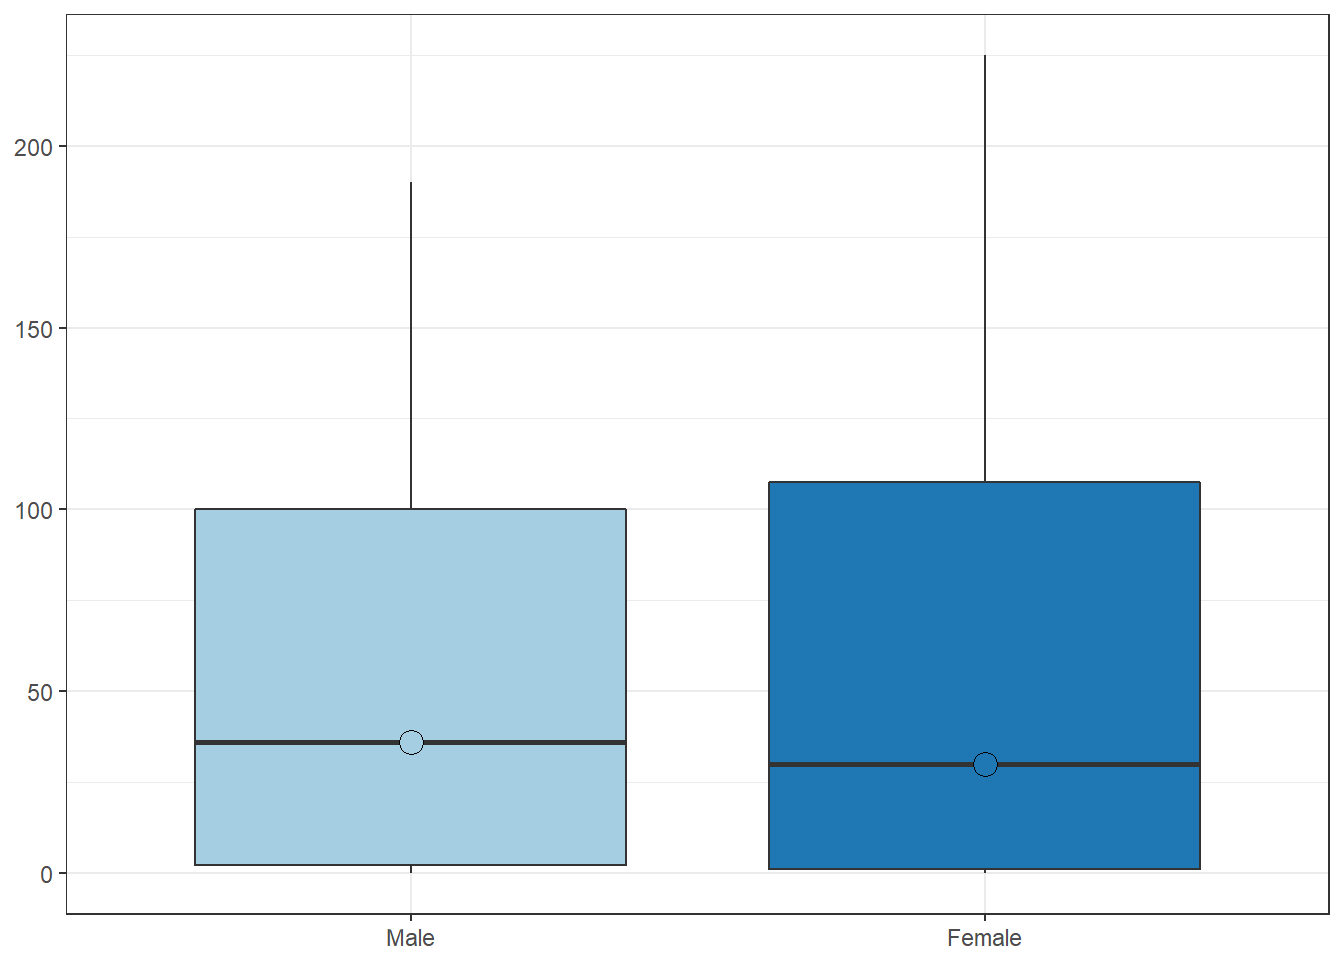
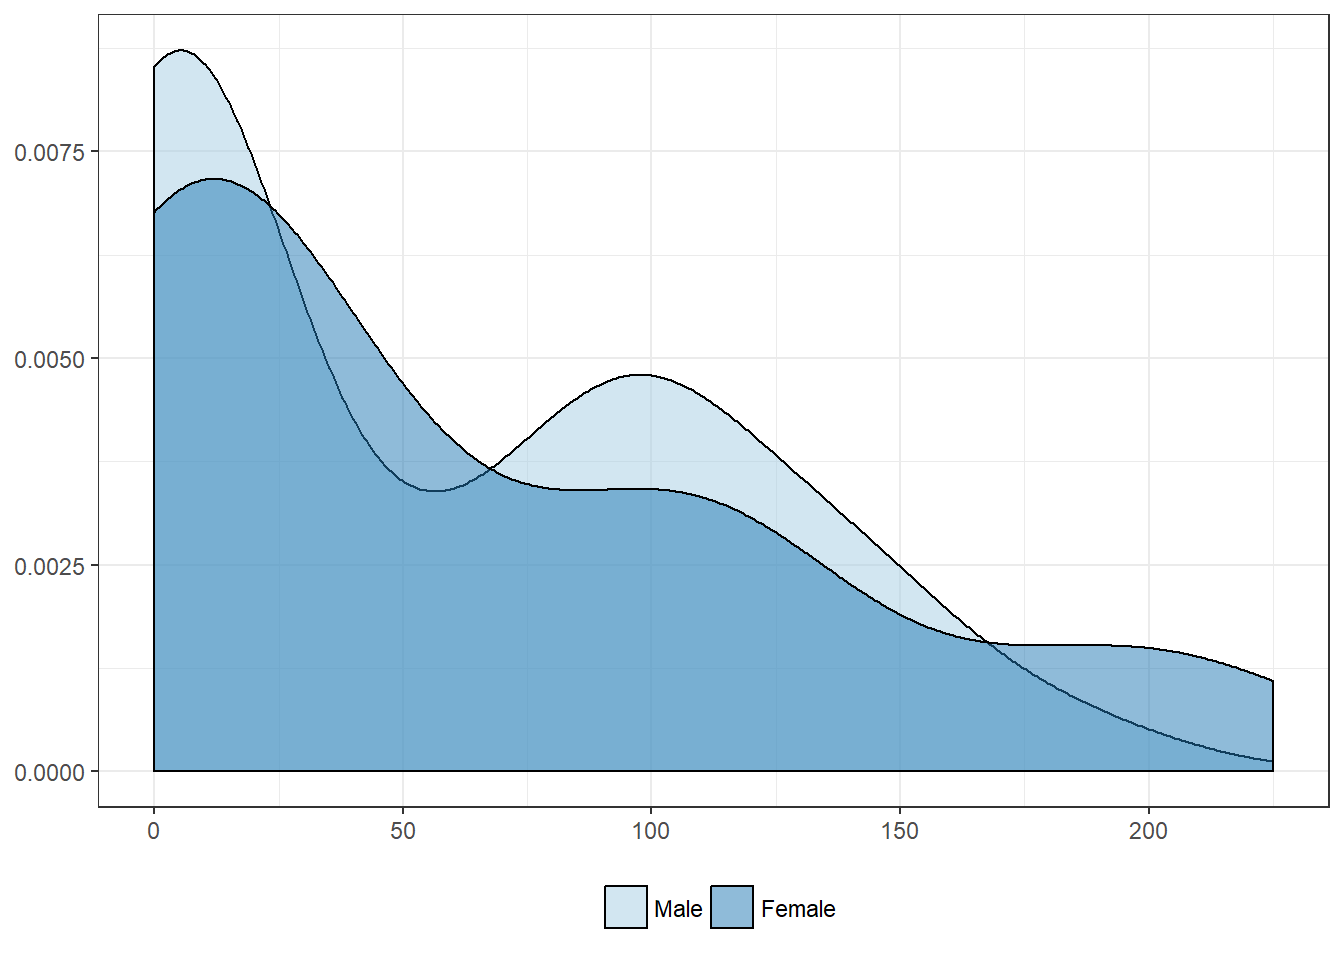
Sex
| Male | Female | |
|---|---|---|
| Mean | 54.7 | 61.2 |
| Standard deviation | 56.9 | 68.6 |
| Median | 36.0 | 30.0 |
| Interquartile range | 97.9 | 106.5 |
| Minimum | 0.0 | 0.0 |
| Maximum | 190.0 | 225.0 |
| Value | |
|---|---|
| U-statistic | 1164 |
| P statistic | 9.7e-01 |
Pathologic features
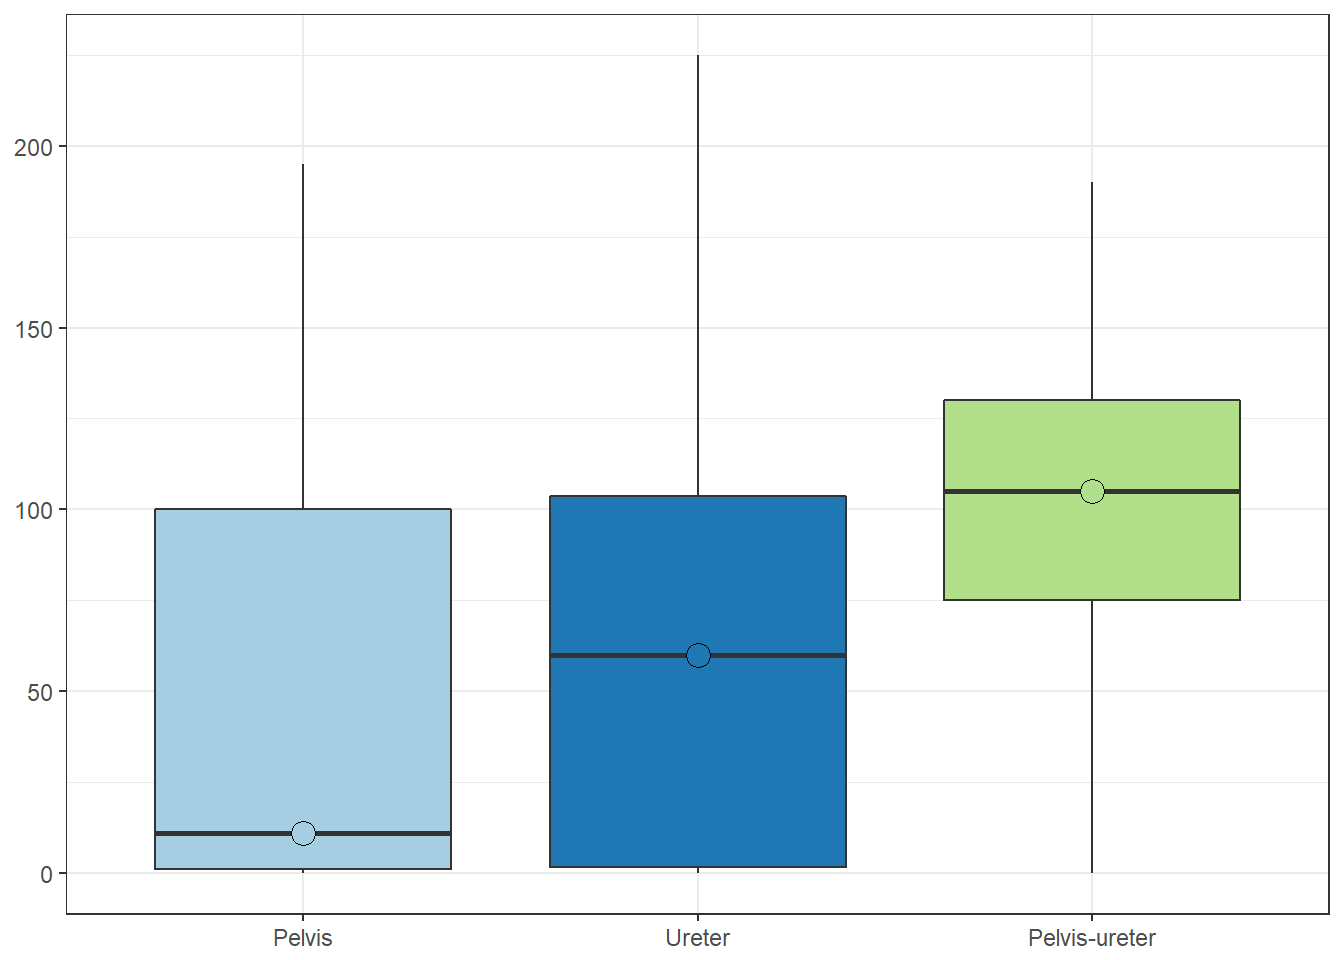
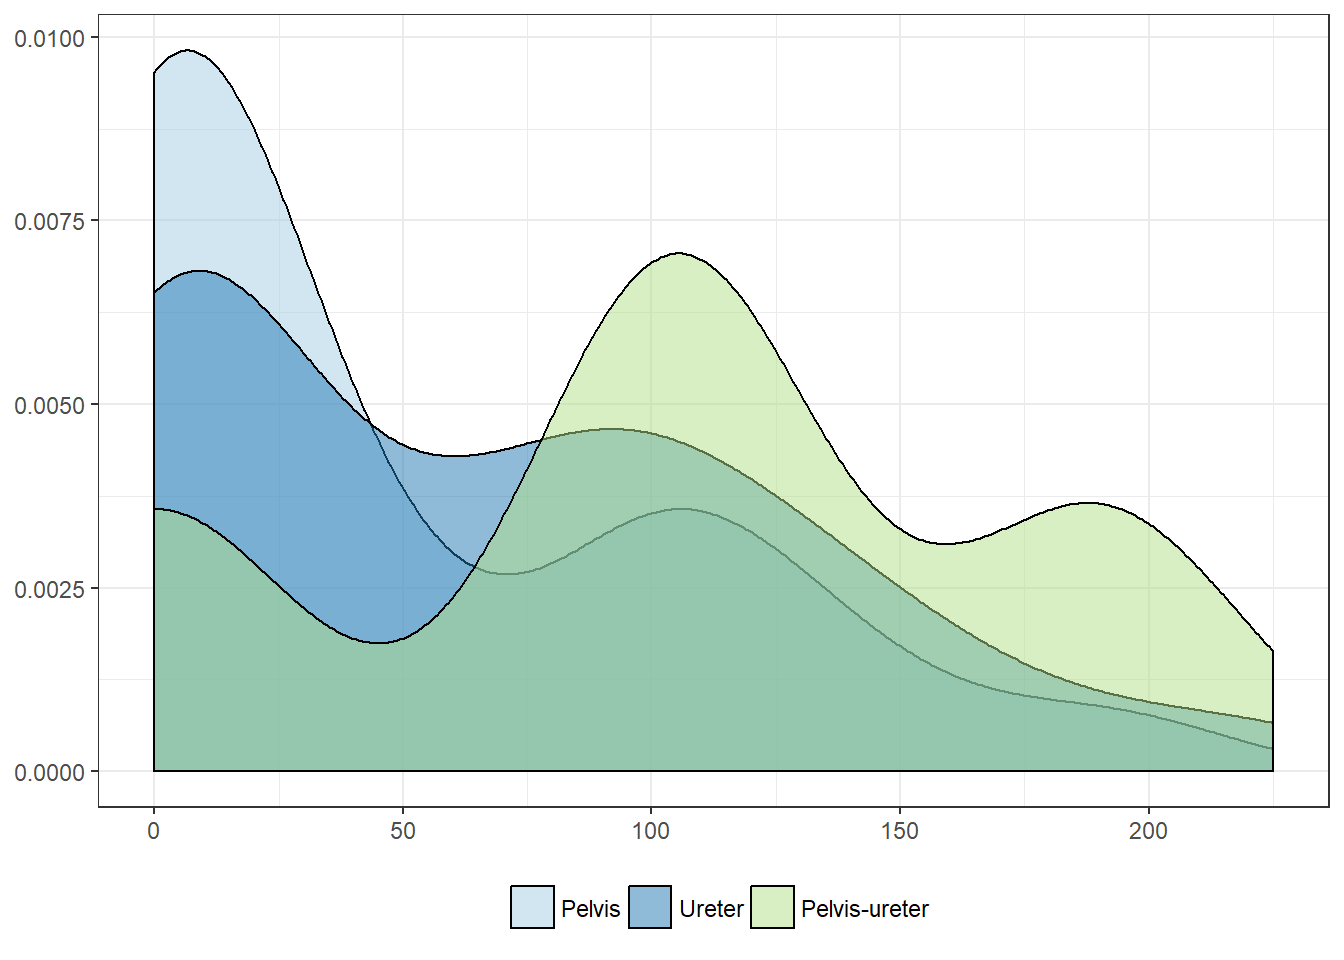
Tumor location
| Pelvis | Ureter | Pelvis-ureter | |
|---|---|---|---|
| Mean | 45.7 | 64.3 | 100.0 |
| Standard deviation | 57.5 | 62.5 | 77.9 |
| Median | 11.0 | 60.0 | 105.0 |
| Interquartile range | 99.0 | 102.2 | 55.0 |
| Minimum | 0.0 | 0.0 | 0.0 |
| Maximum | 195.0 | 225.0 | 190.0 |
| Value | |
|---|---|
| Statistic | 2.478 |
| Parameter | 2 |
| P statistic | 0.29 |
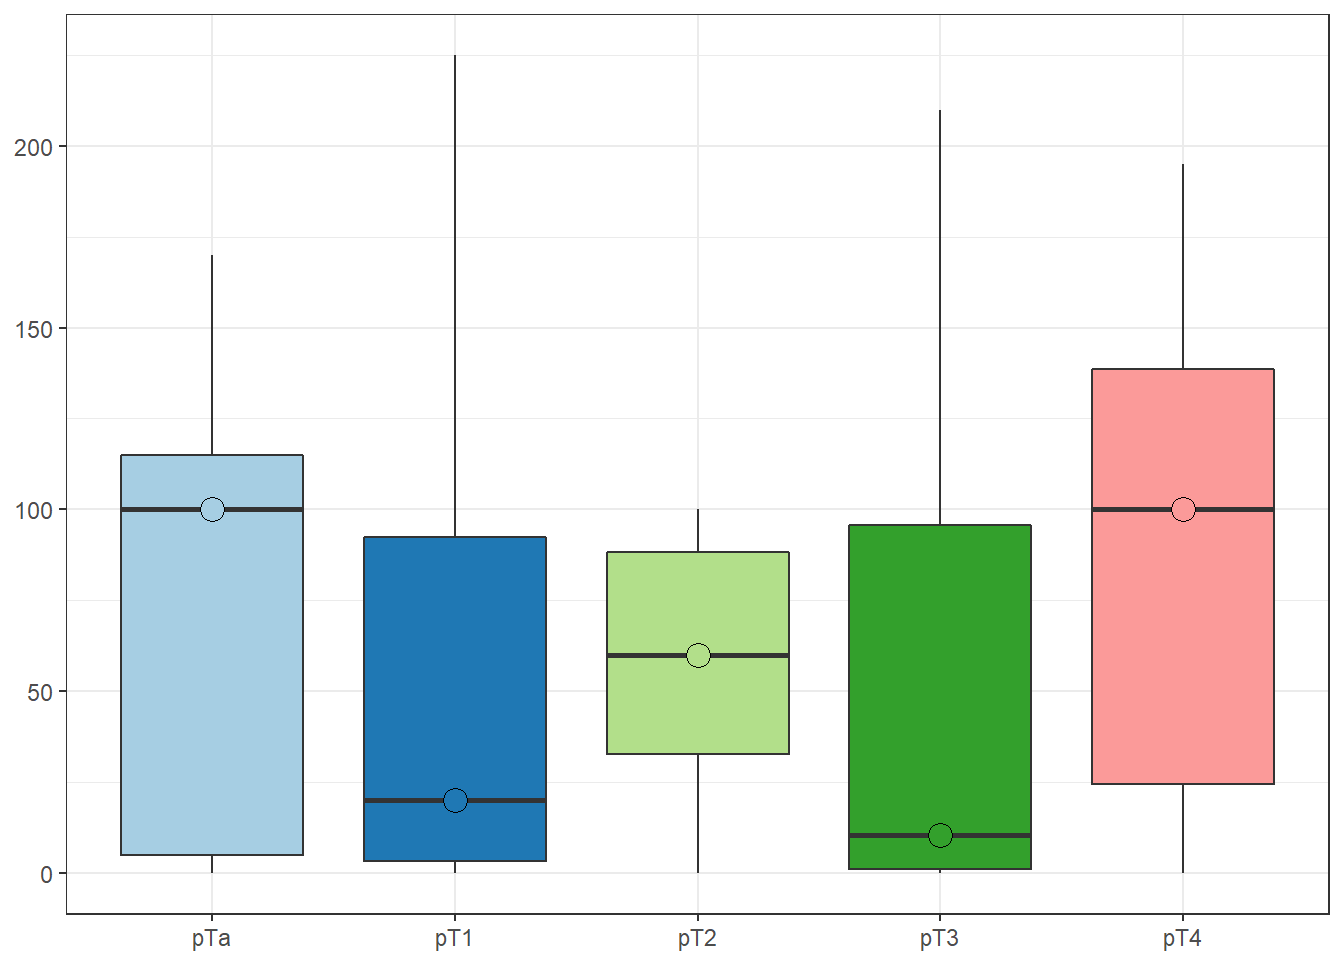
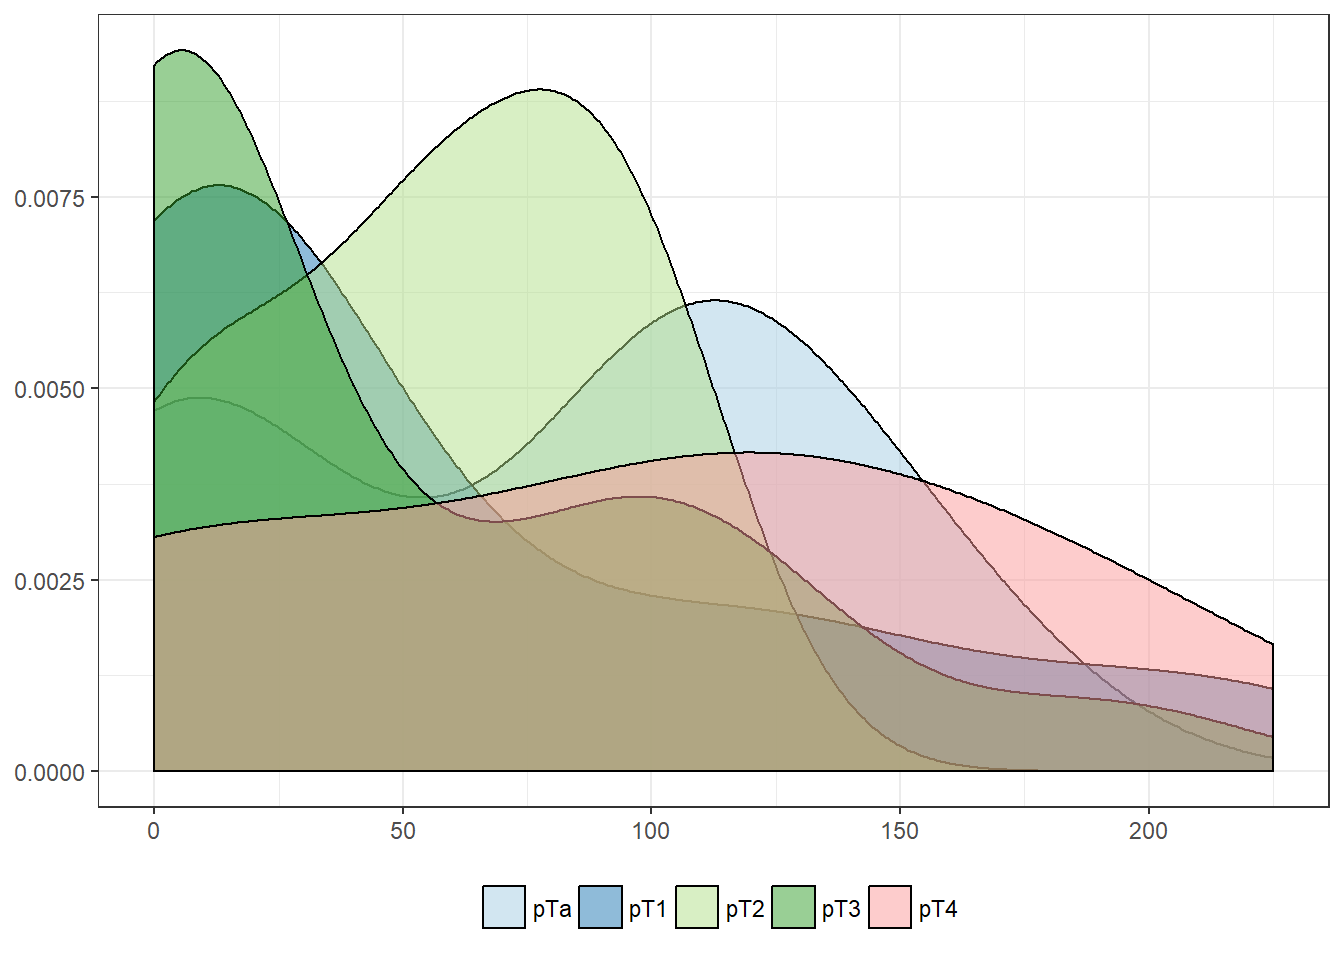
pT stage
| pTa | pT1 | pT2 | pT3 | pT4 | |
|---|---|---|---|---|---|
| Mean | 75.2 | 54.9 | 56.4 | 47.0 | 91.0 |
| Standard deviation | 58.9 | 71.0 | 37.6 | 59.0 | 78.6 |
| Median | 100.0 | 20.0 | 60.0 | 10.5 | 100.0 |
| Interquartile range | 110.0 | 89.4 | 55.6 | 94.6 | 114.2 |
| Minimum | 0.0 | 0.0 | 0.0 | 0.0 | 0.0 |
| Maximum | 170.0 | 225.0 | 100.0 | 210.0 | 195.0 |
| Value | |
|---|---|
| Statistic | 4.948 |
| Parameter | 4 |
| P statistic | 0.29 |
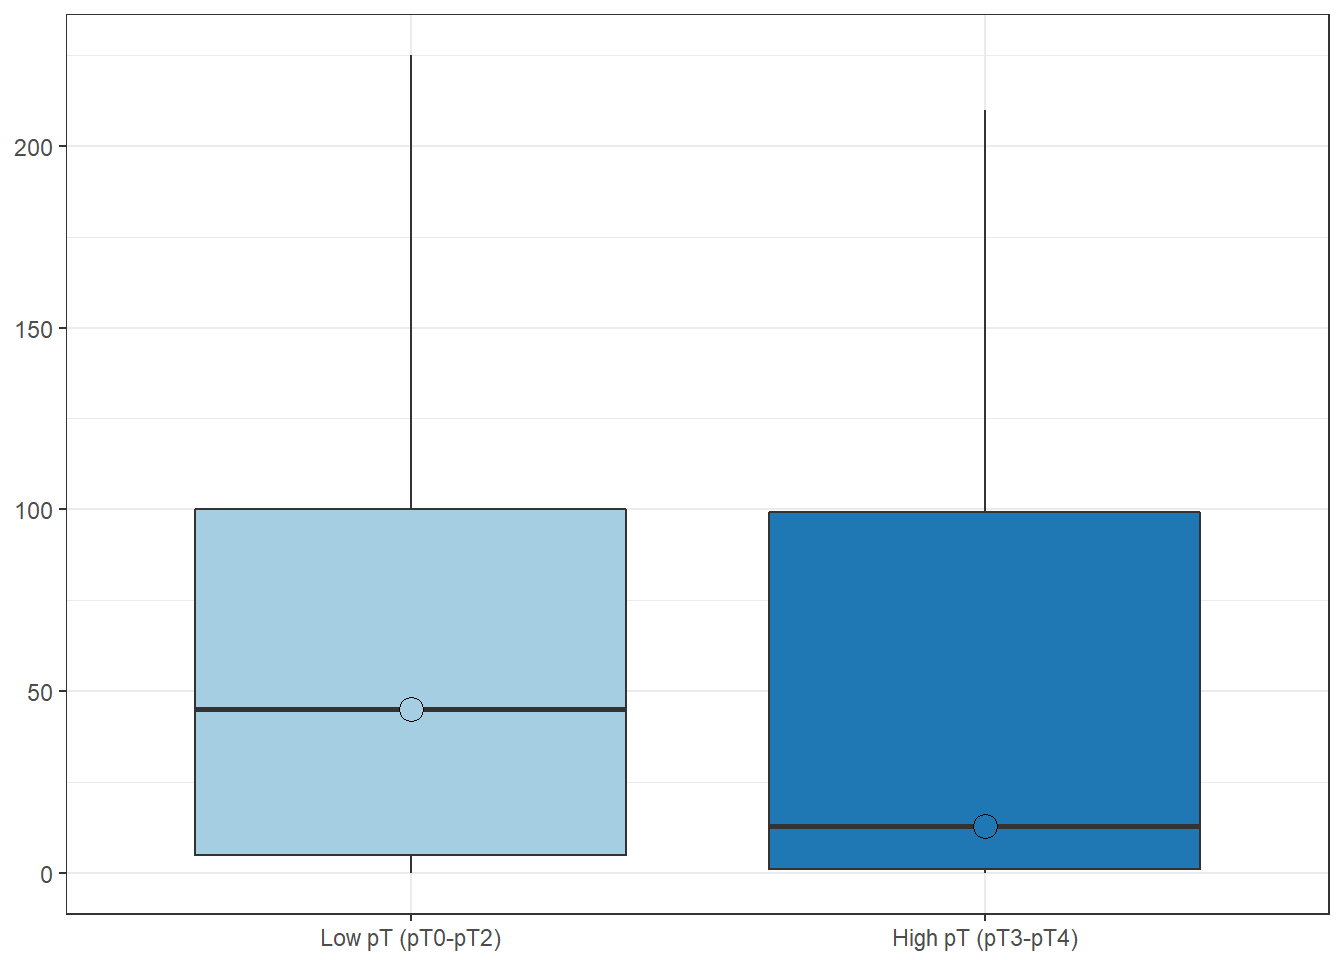
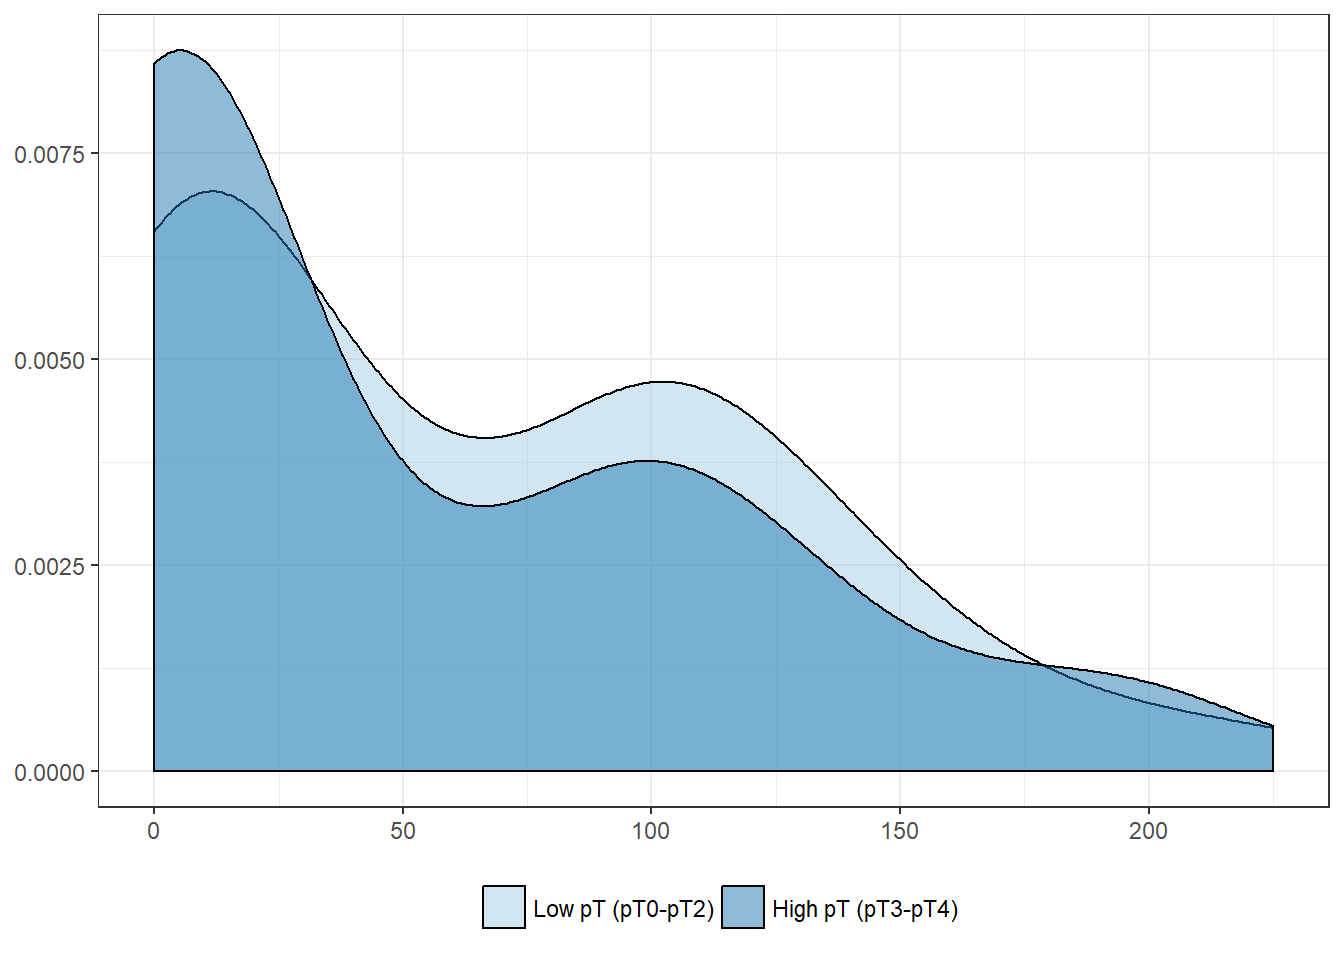
High pT stage (> pT2)
| Low pT (pT0-pT2) | High pT (pT3-pT4) | |
|---|---|---|
| Mean | 63.8 | 51.9 |
| Standard deviation | 60.8 | 62.2 |
| Median | 45.0 | 13.0 |
| Interquartile range | 95.0 | 98.4 |
| Minimum | 0.0 | 0.0 |
| Maximum | 225.0 | 210.0 |
| Value | |
|---|---|
| U-statistic | 1411 |
| P statistic | 1.7e-01 |
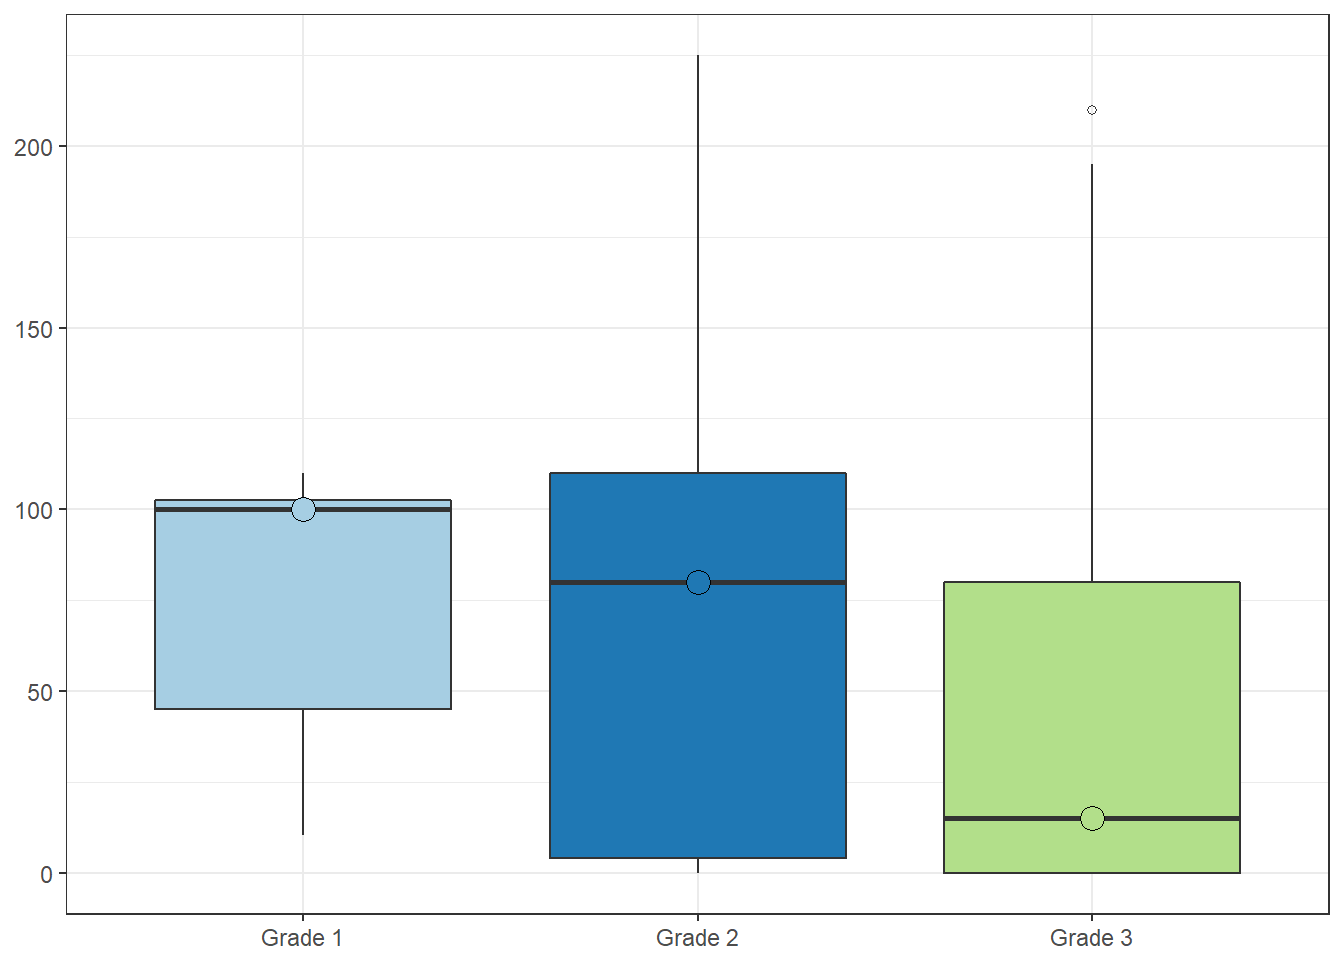
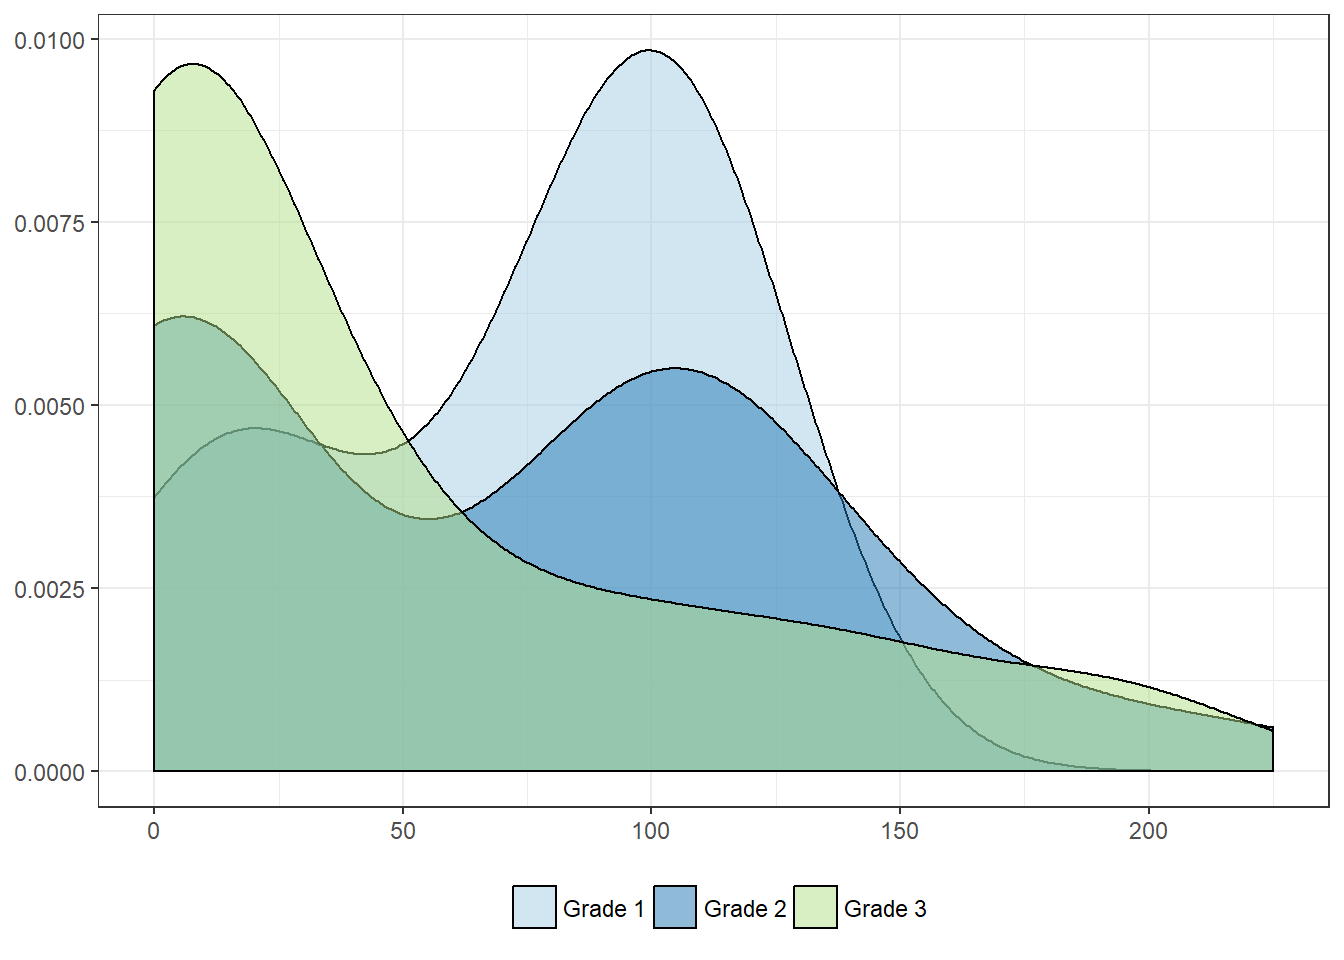
Histologic grade
| Grade 1 | Grade 2 | Grade 3 | |
|---|---|---|---|
| Mean | 73.6 | 68.0 | 47.2 |
| Standard deviation | 42.0 | 63.3 | 61.4 |
| Median | 100.0 | 80.0 | 15.0 |
| Interquartile range | 57.5 | 106.0 | 80.0 |
| Minimum | 10.5 | 0.0 | 0.0 |
| Maximum | 110.0 | 225.0 | 210.0 |
| Value | |
|---|---|
| Statistic | 5.477 |
| Parameter | 2 |
| P statistic | 0.065 |
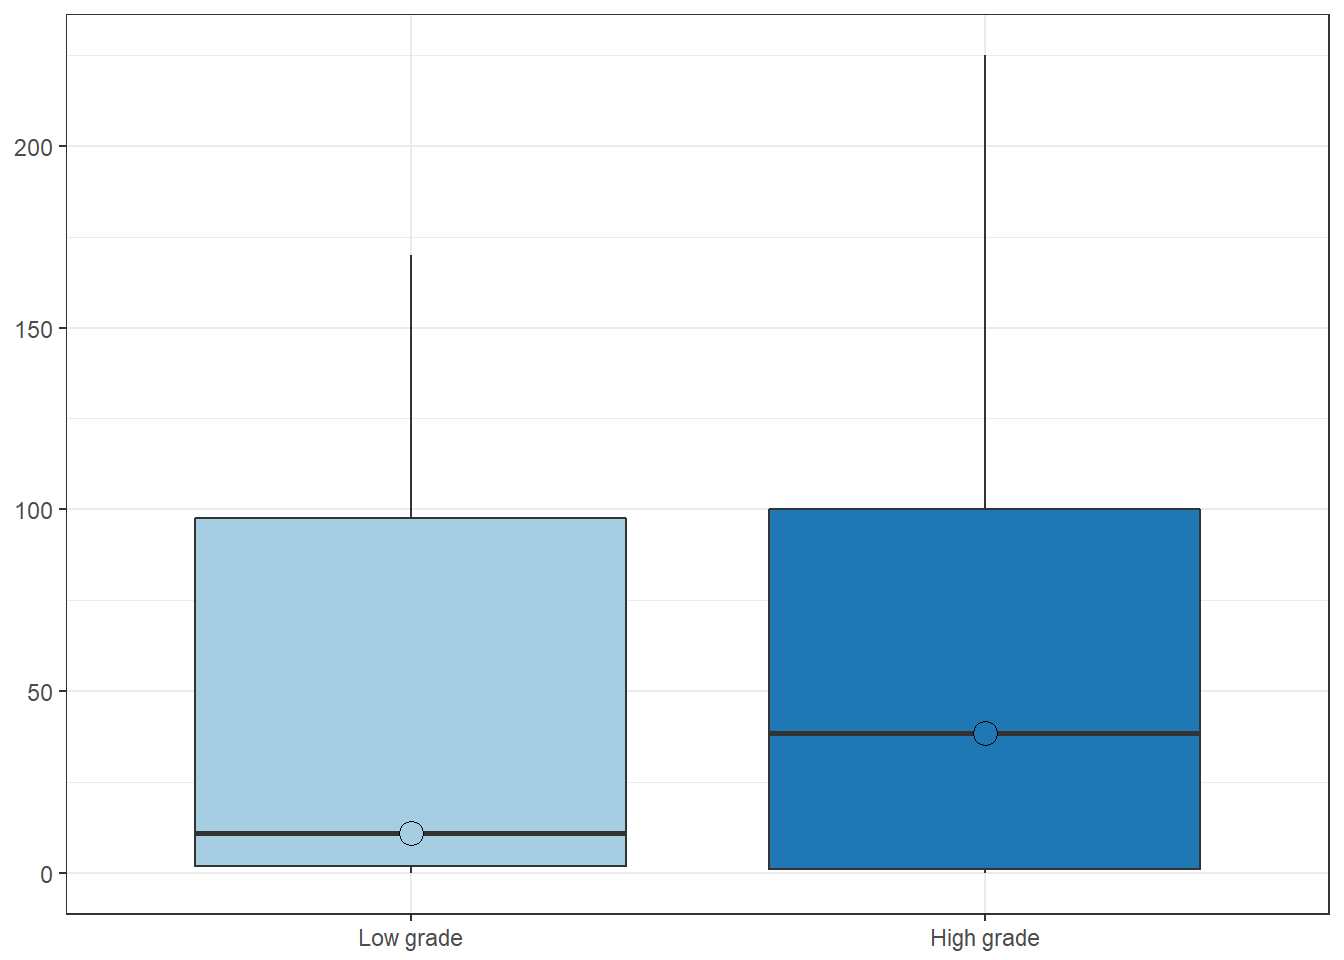
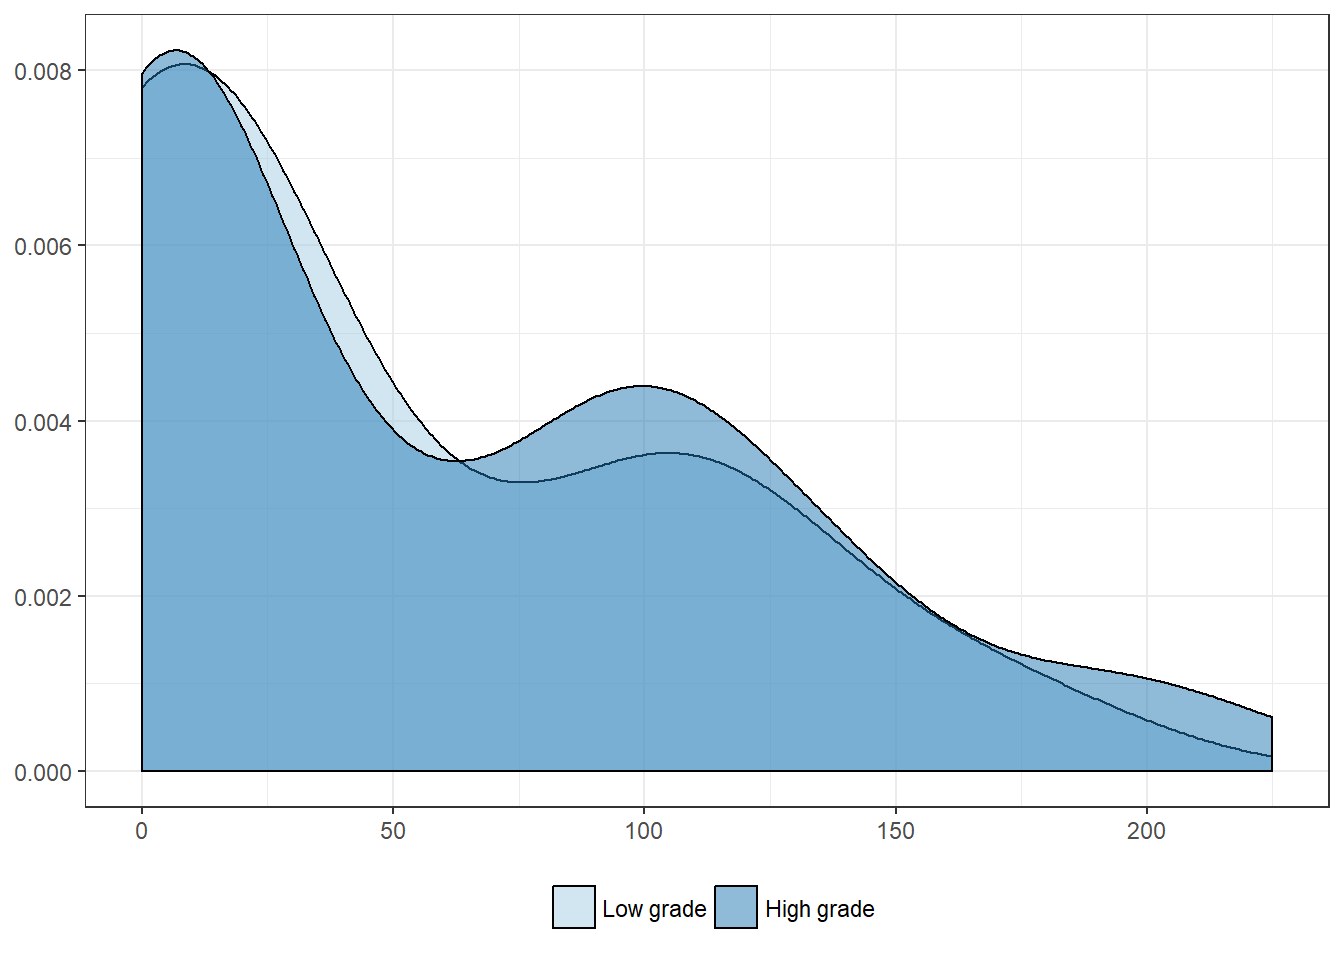
WHO histologic grade
| Low grade | High grade | |
|---|---|---|
| Mean | 47.2 | 59.1 |
| Standard deviation | 57.0 | 62.4 |
| Median | 11.0 | 38.5 |
| Interquartile range | 95.8 | 99.0 |
| Minimum | 0.0 | 0.0 |
| Maximum | 170.0 | 225.0 |
| Value | |
|---|---|
| U-statistic | 592 |
| P statistic | 7.1e-01 |
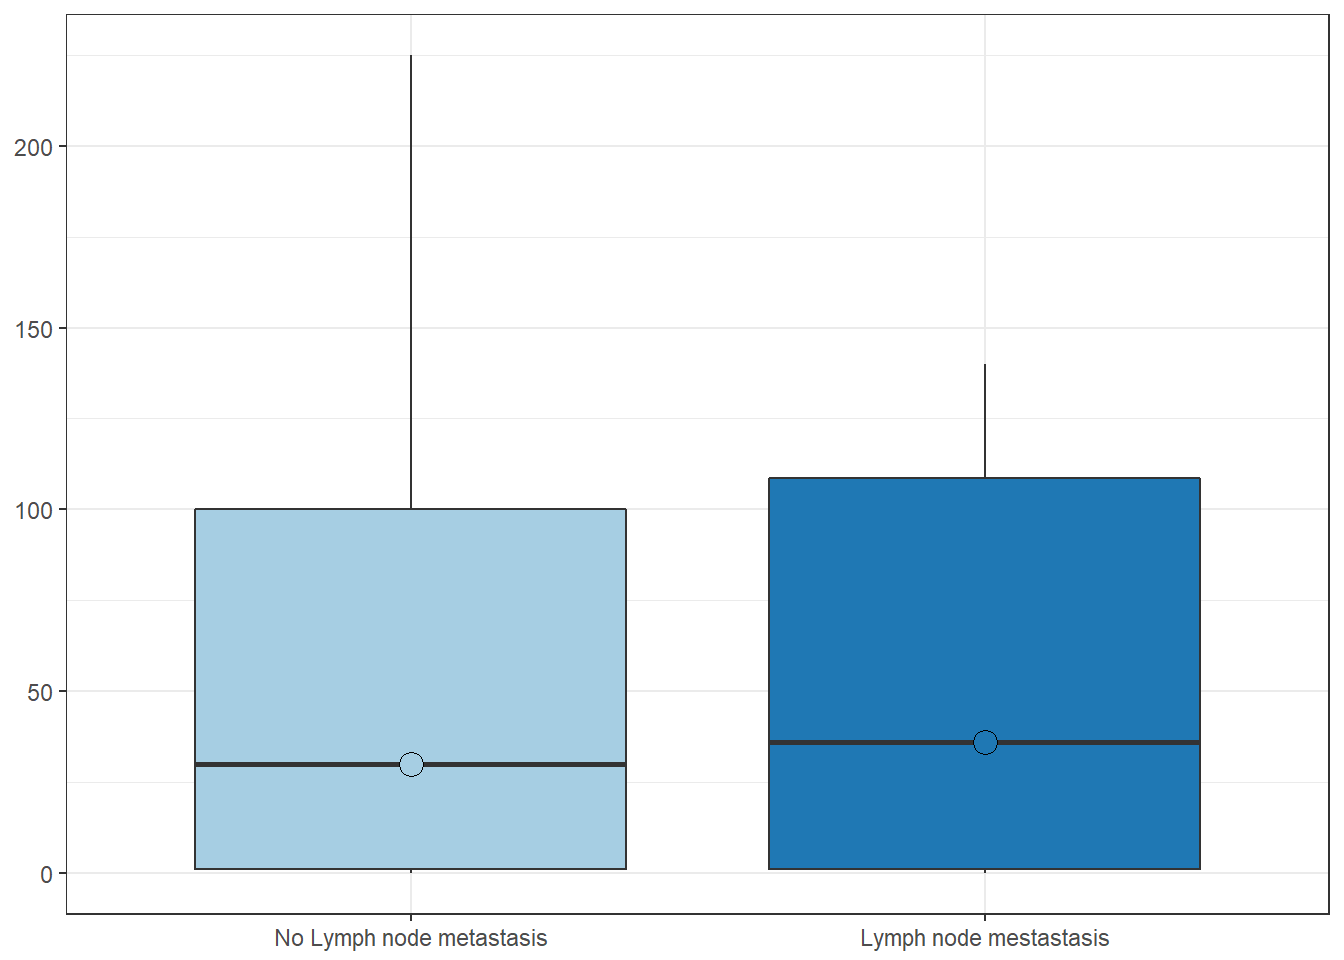
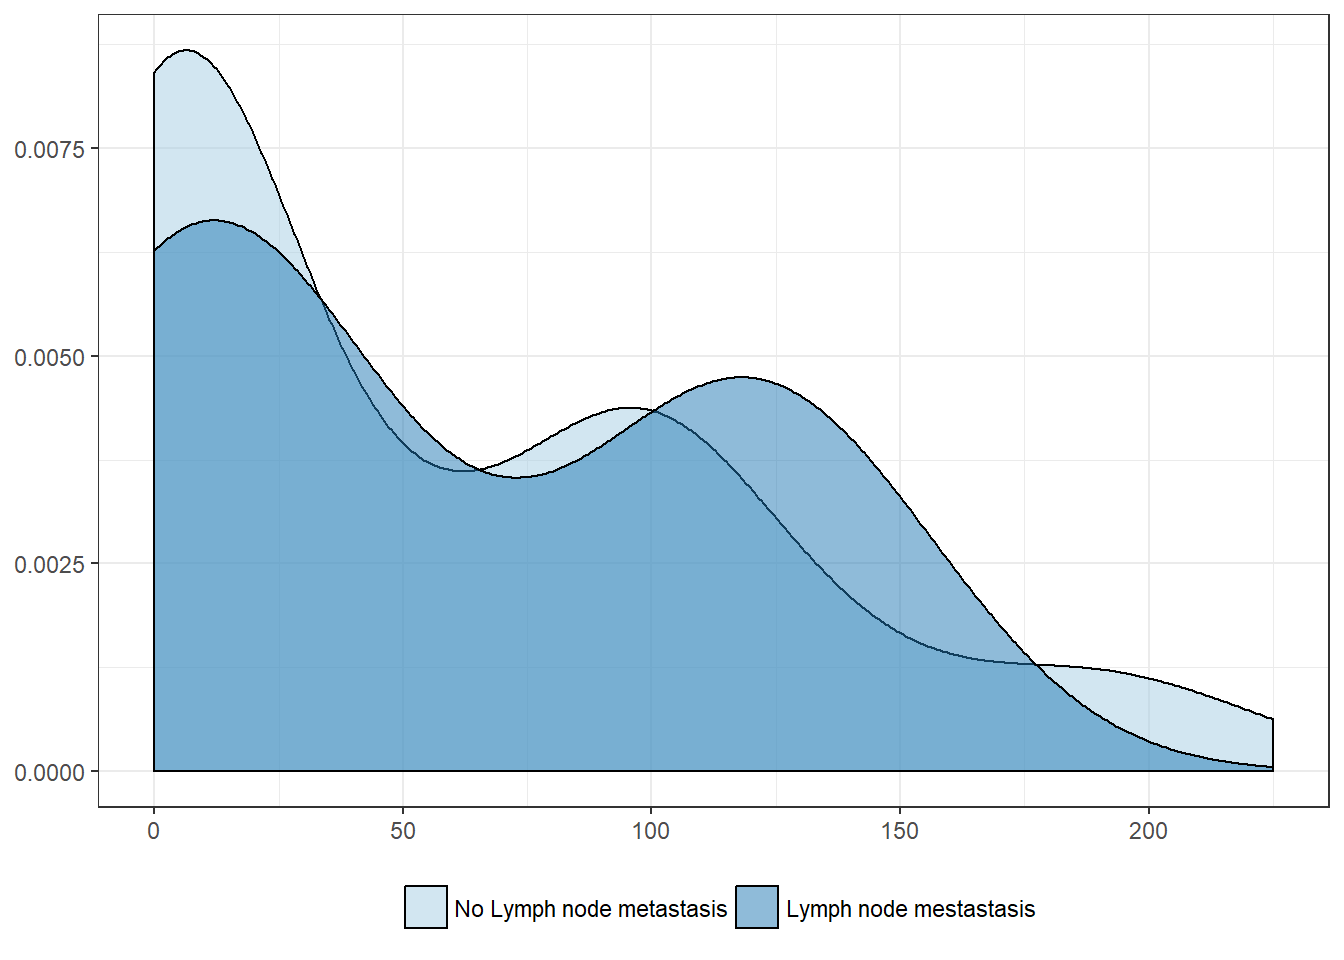
Lymph nodes metastasis
| No Lymph node metastasis | Lymph node mestastasis | |
|---|---|---|
| Mean | 56.0 | 57.5 |
| Standard deviation | 61.9 | 57.5 |
| Median | 30.0 | 36.0 |
| Interquartile range | 99.0 | 107.7 |
| Minimum | 0.0 | 0.0 |
| Maximum | 225.0 | 140.0 |
| Value | |
|---|---|
| U-statistic | 462 |
| P statistic | 6.5e-01 |
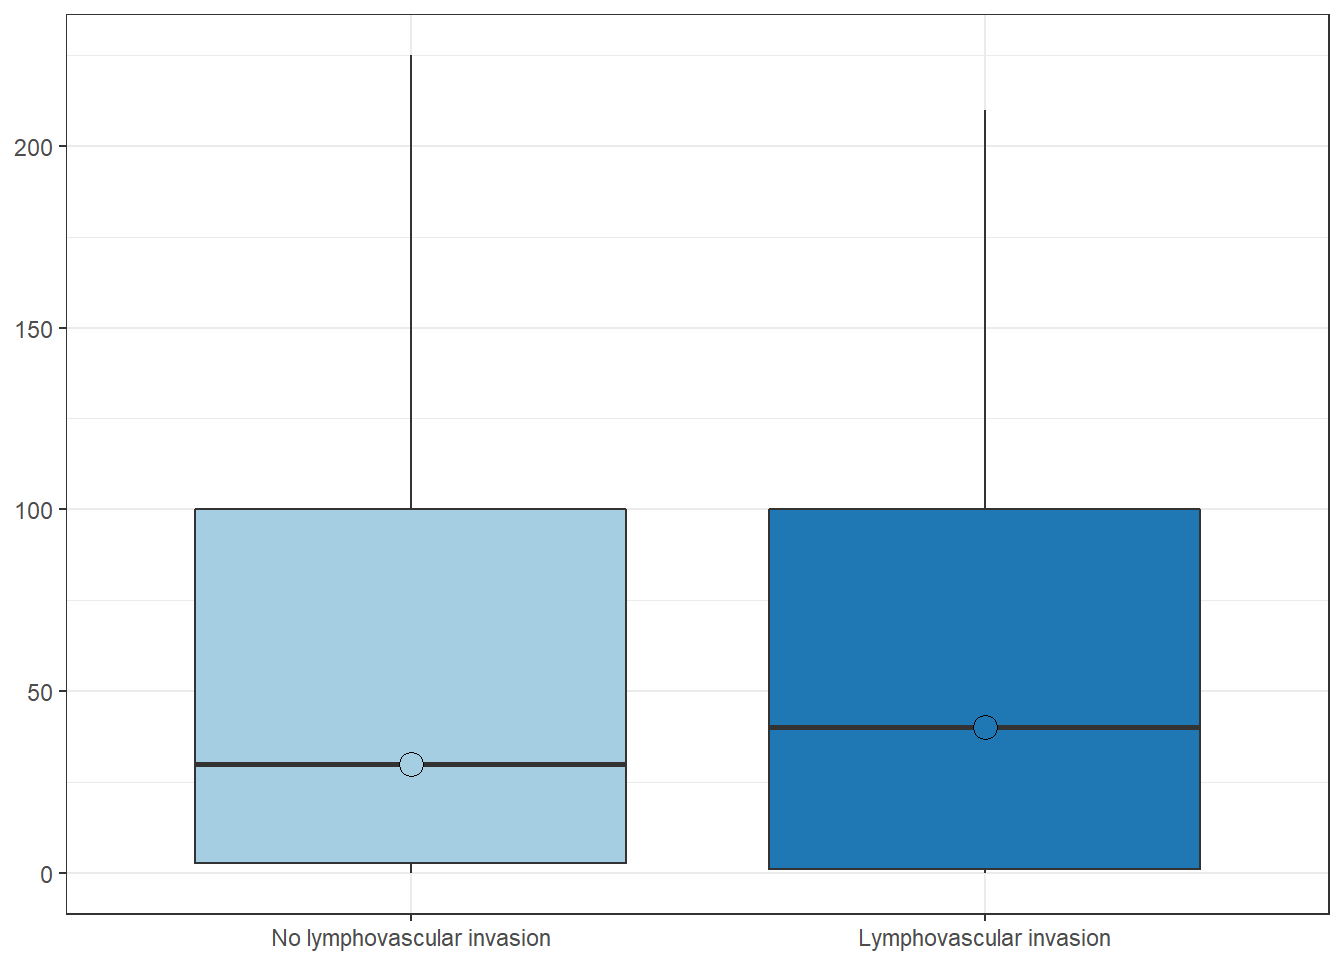
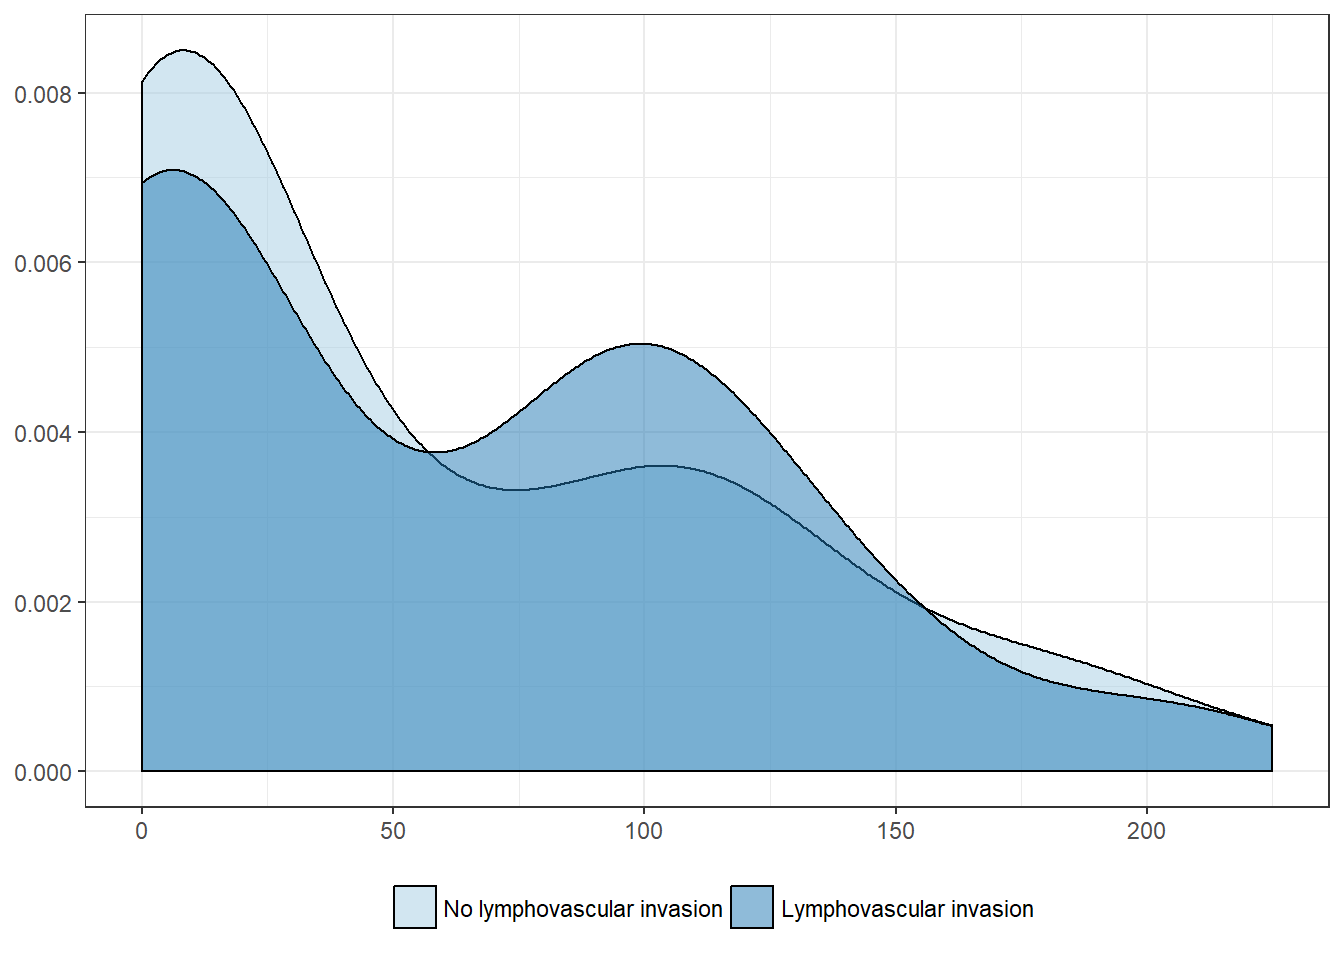
Lymphovascular invasion
| No lymphovascular invasion | Lymphovascular invasion | |
|---|---|---|
| Mean | 55.5 | 59.9 |
| Standard deviation | 62.4 | 60.8 |
| Median | 30.0 | 40.0 |
| Interquartile range | 97.2 | 99.0 |
| Minimum | 0.0 | 0.0 |
| Maximum | 225.0 | 210.0 |
| Value | |
|---|---|
| U-statistic | 1192 |
| P statistic | 9.3e-01 |
Outcome
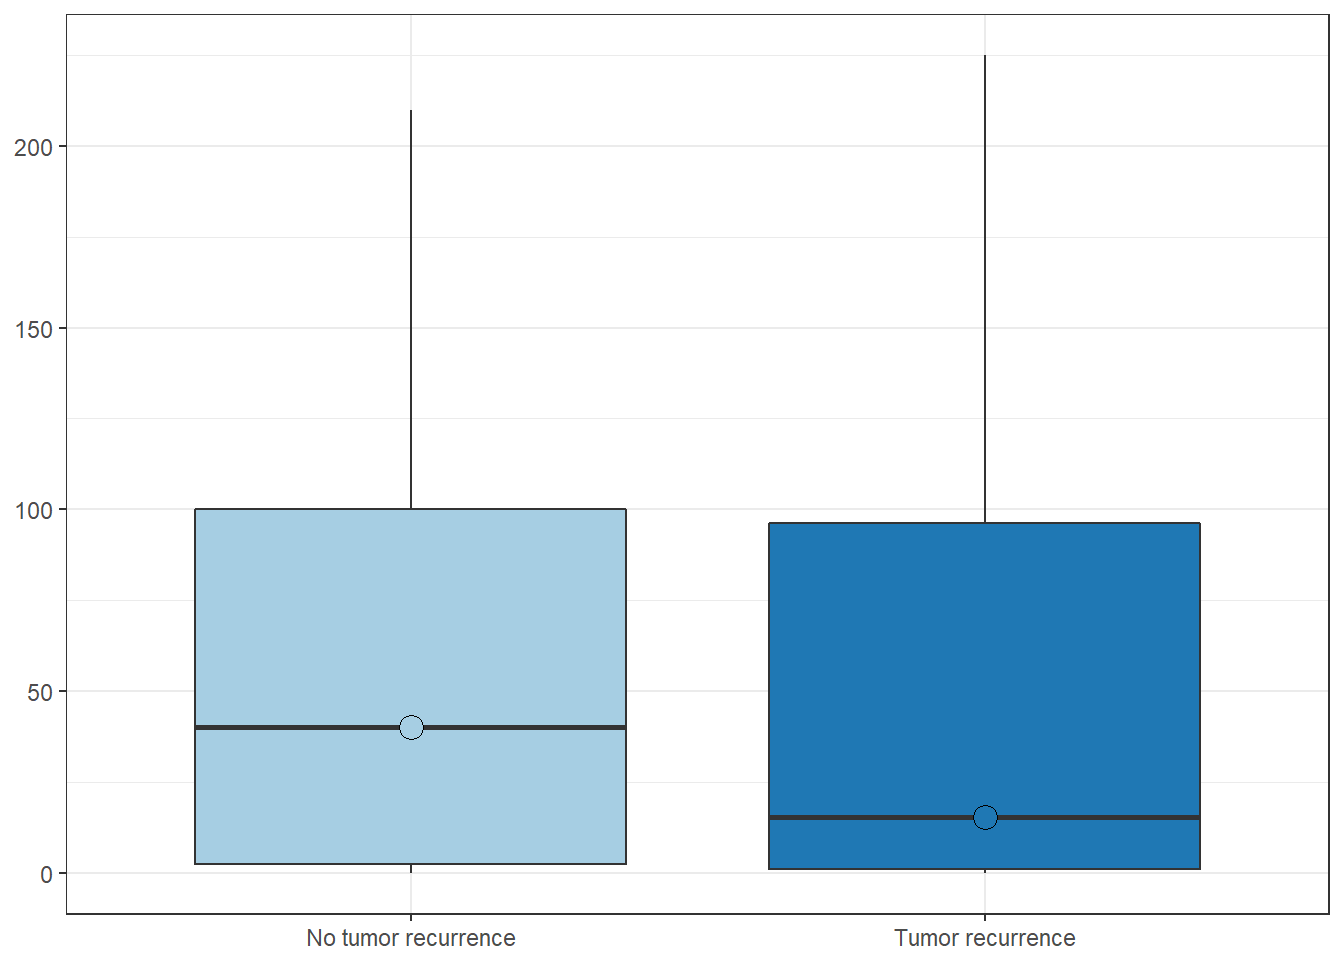
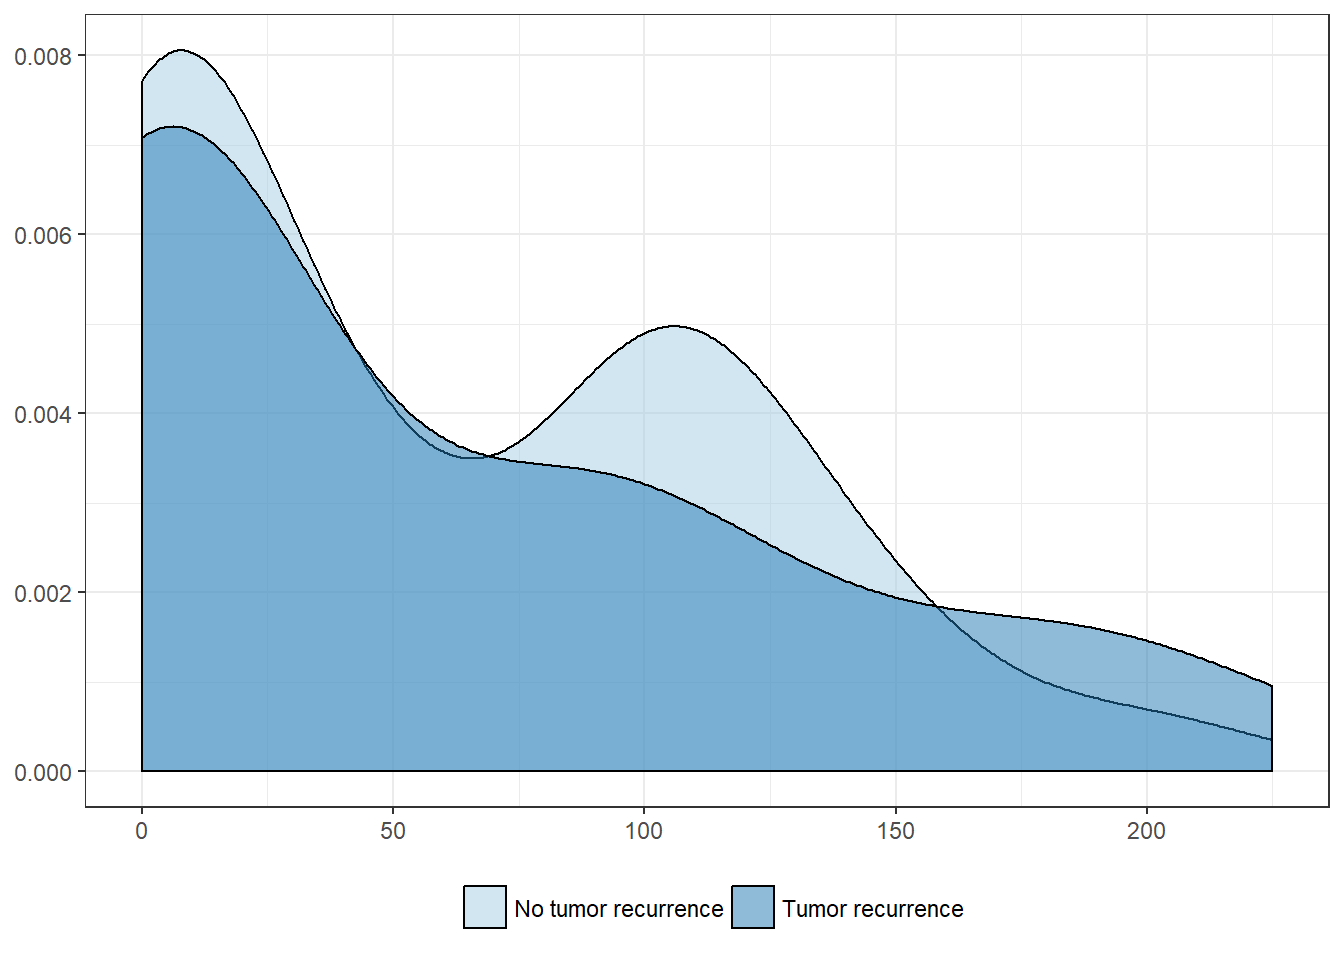
Tumor recurrence
| No tumor recurrence | Tumor recurrence | |
|---|---|---|
| Mean | 58.5 | 57.2 |
| Standard deviation | 58.3 | 69.5 |
| Median | 40.0 | 15.2 |
| Interquartile range | 97.5 | 95.2 |
| Minimum | 0.0 | 0.0 |
| Maximum | 210.0 | 225.0 |
| Value | |
|---|---|
| U-statistic | 1105 |
| P statistic | 6.2e-01 |
Tumor progression
| No tumor progression | Tumor progression | |
|---|---|---|
| Mean | 52.1 | 57.8 |
| Standard deviation | 53.6 | 65.9 |
| Median | 30.0 | 35.0 |
| Interquartile range | 98.6 | 99.0 |
| Minimum | 0.0 | 0.0 |
| Maximum | 170.0 | 225.0 |
| Value | |
|---|---|
| U-statistic | 838 |
| P statistic | 9.6e-01 |


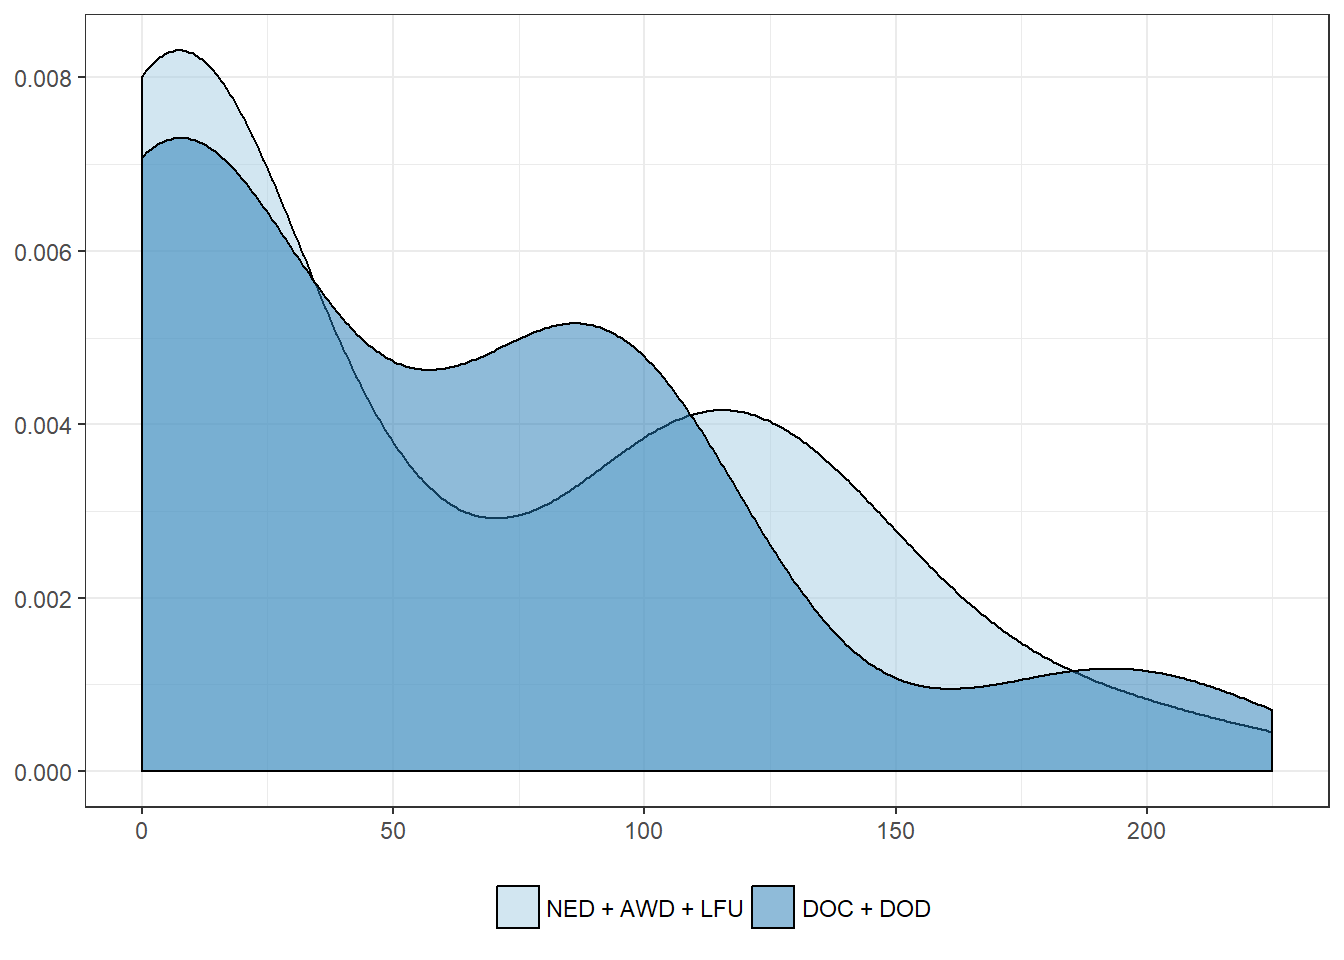
Overall mortality
| NED + AWD + LFU | DOC + DOD | |
|---|---|---|
| Mean | 58.2 | 55.3 |
| Standard deviation | 62.5 | 60.3 |
| Median | 32.5 | 37.0 |
| Interquartile range | 108.6 | 94.0 |
| Minimum | 0.0 | 0.0 |
| Maximum | 225.0 | 210.0 |
| Value | |
|---|---|
| U-statistic | 1156 |
| P statistic | 6.2e-01 |
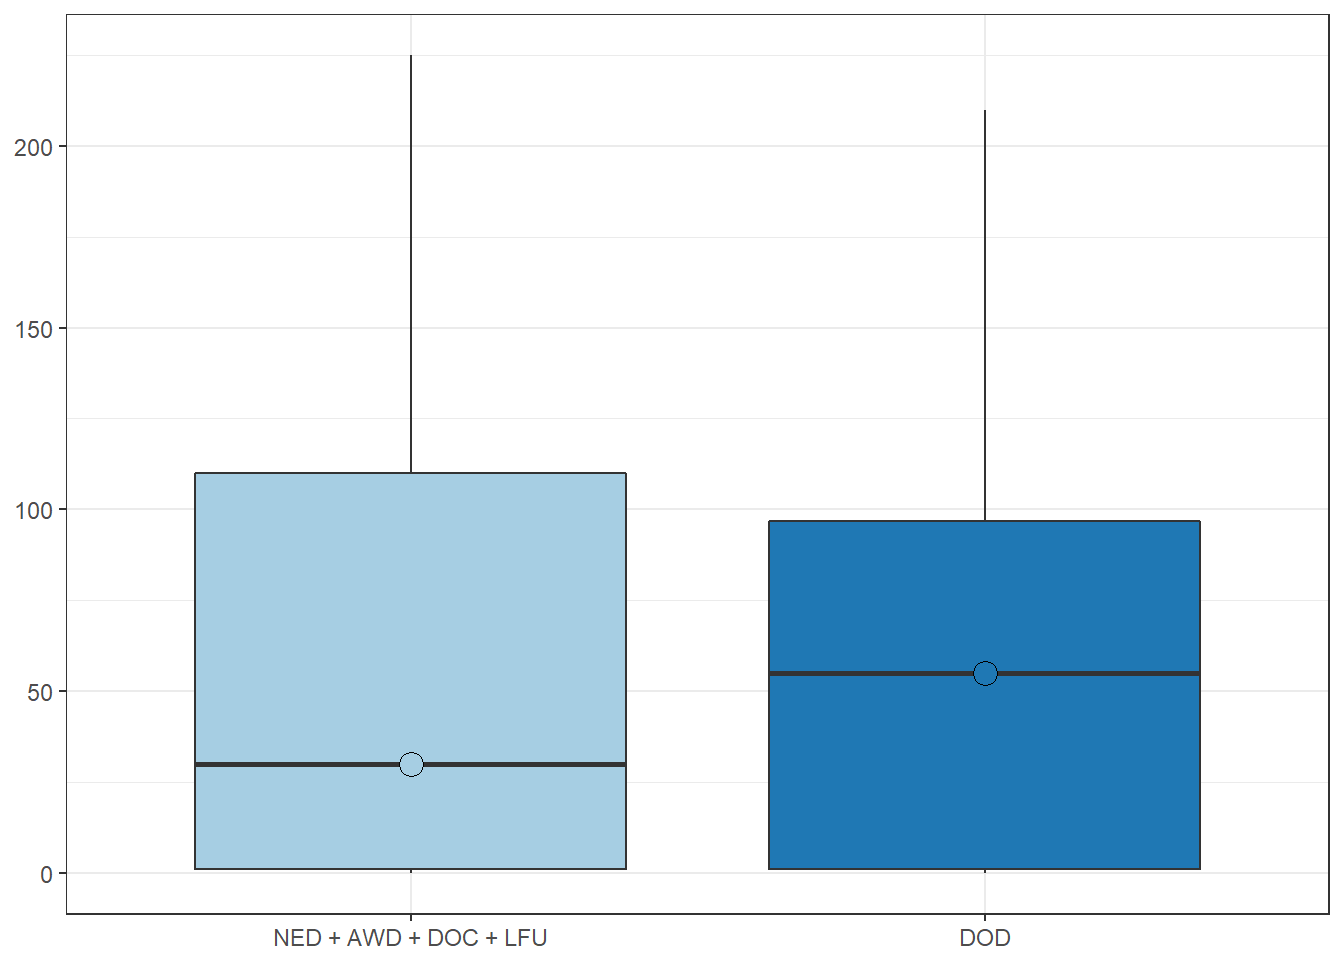
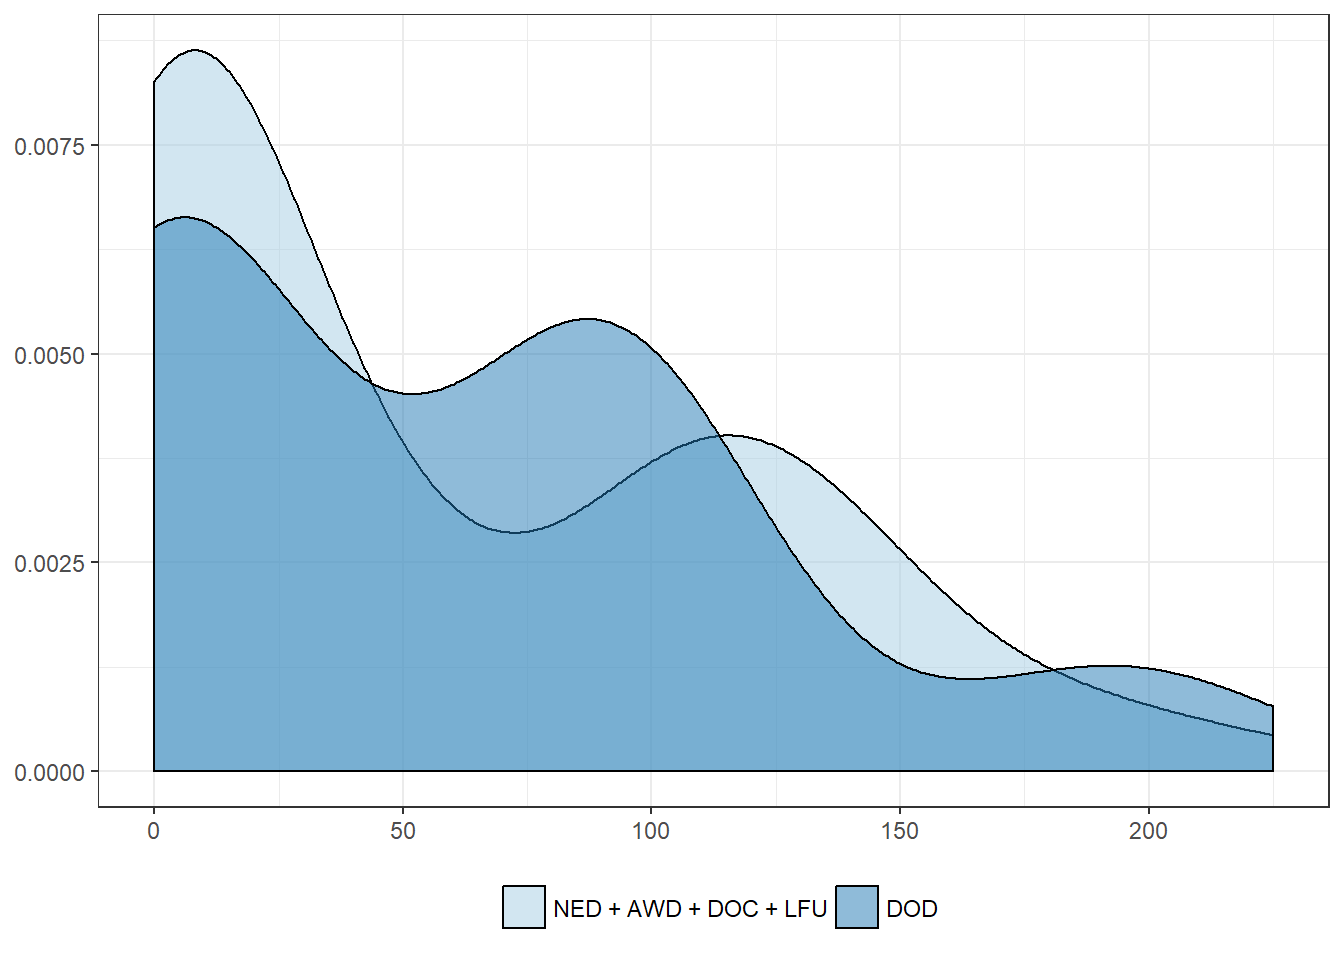
Cancer-related mortality
| NED + AWD + DOC + LFU | DOD | |
|---|---|---|
| Mean | 56.6 | 58.8 |
| Standard deviation | 61.7 | 62.0 |
| Median | 30.0 | 55.0 |
| Interquartile range | 109.0 | 95.9 |
| Minimum | 0.0 | 0.0 |
| Maximum | 225.0 | 210.0 |
| Value | |
|---|---|
| U-statistic | 1057 |
| P statistic | 8.7e-01 |