IGF1R and clinicopathologic and outcome features
Clinical features
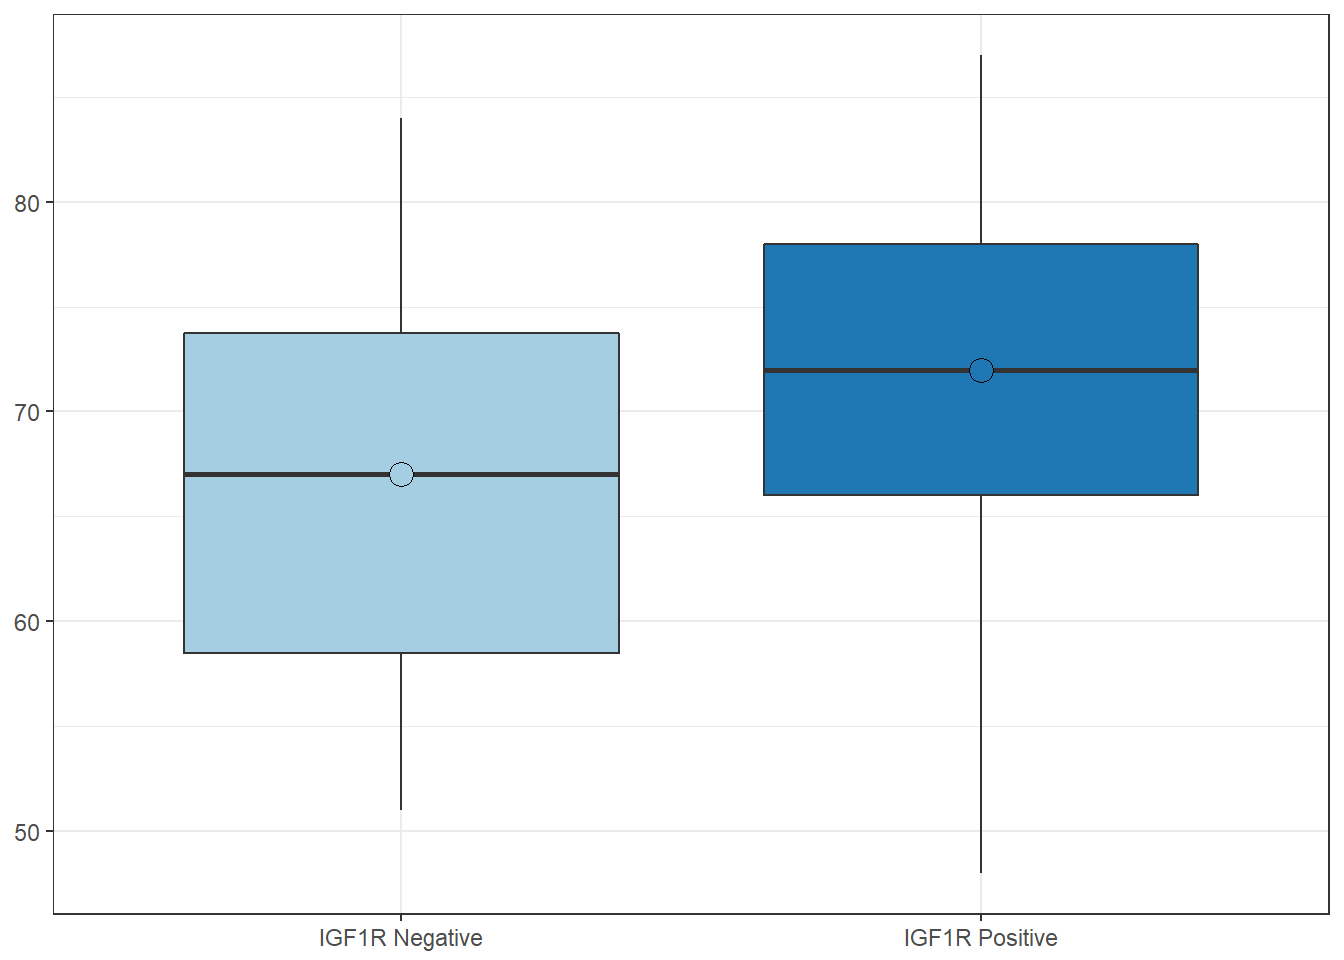
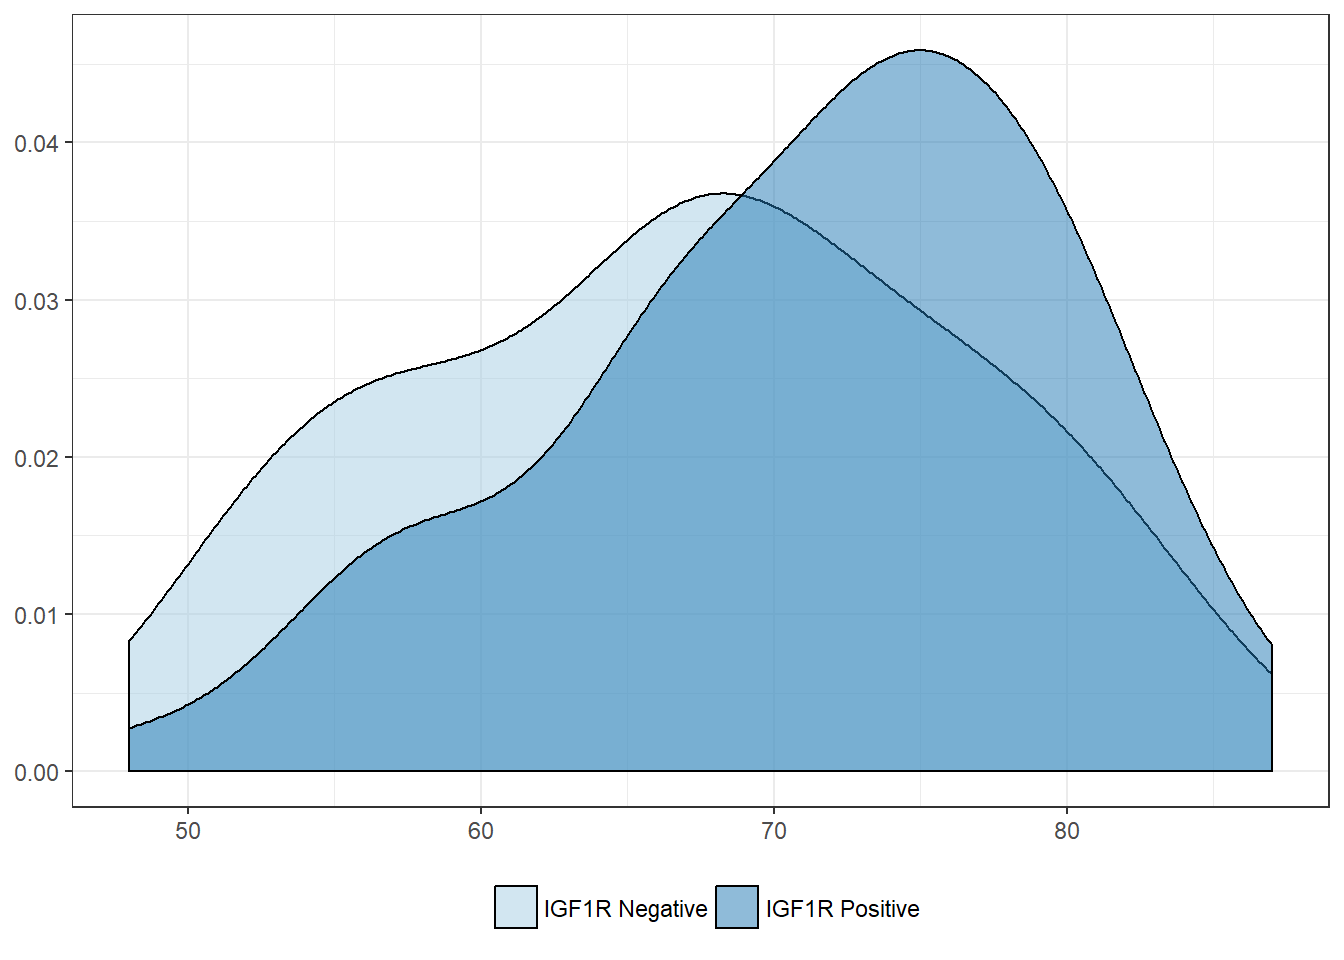
Age
| IGF1R Negative | IGF1R Positive | |
|---|---|---|
| Mean | 67.1 | 71.2 |
| Standard deviation | 9.4 | 8.5 |
| Median | 67.0 | 72.0 |
| Interquartile range | 15.2 | 12.0 |
| Minimum | 51.0 | 48.0 |
| Maximum | 84.0 | 87.0 |
| Value | |
|---|---|
| U-statistic | 769 |
| P statistic | 4.3e-02 |
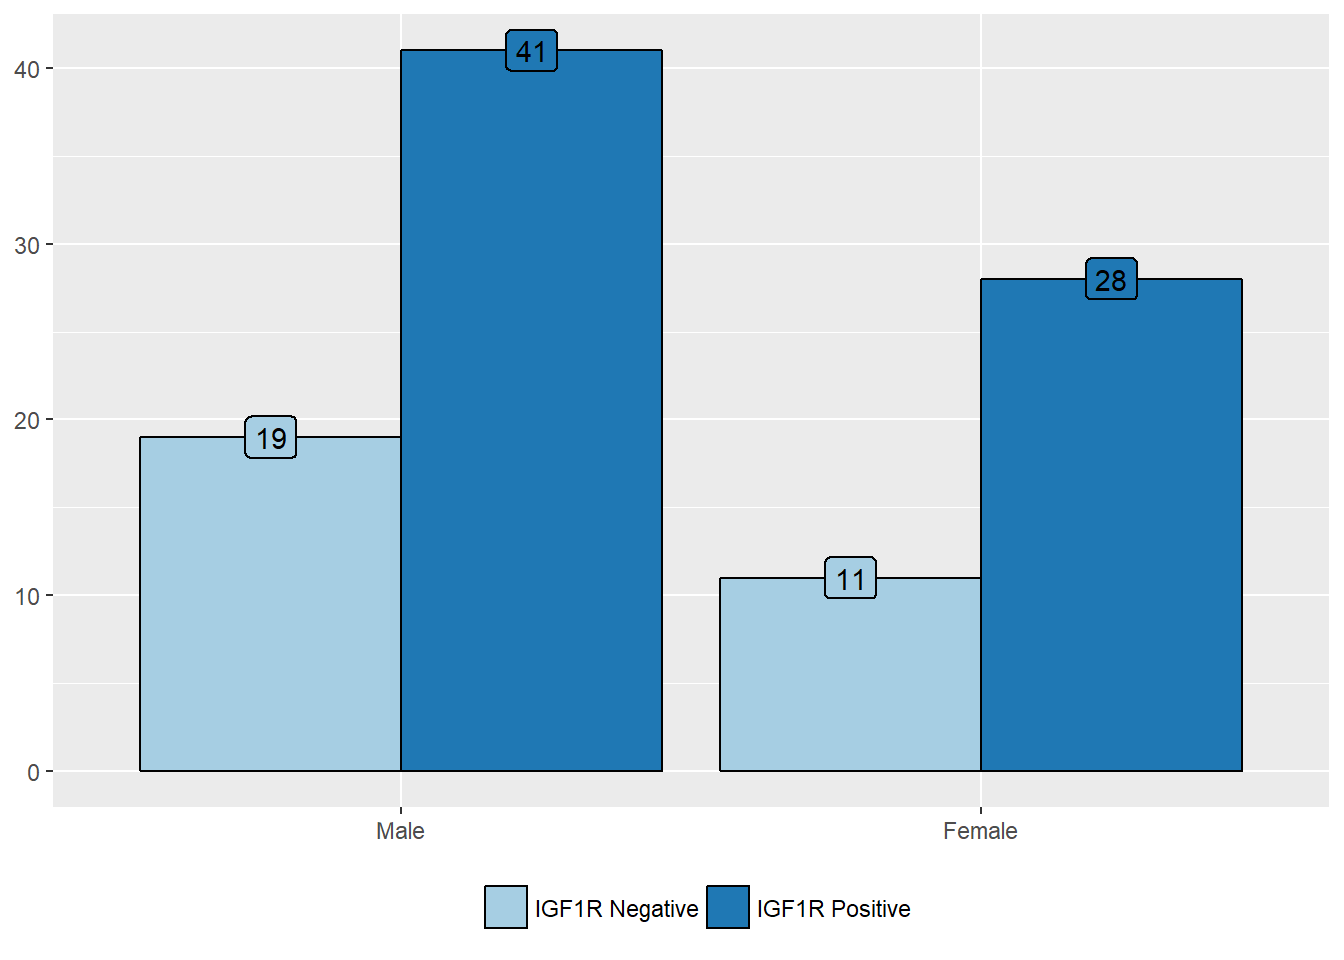
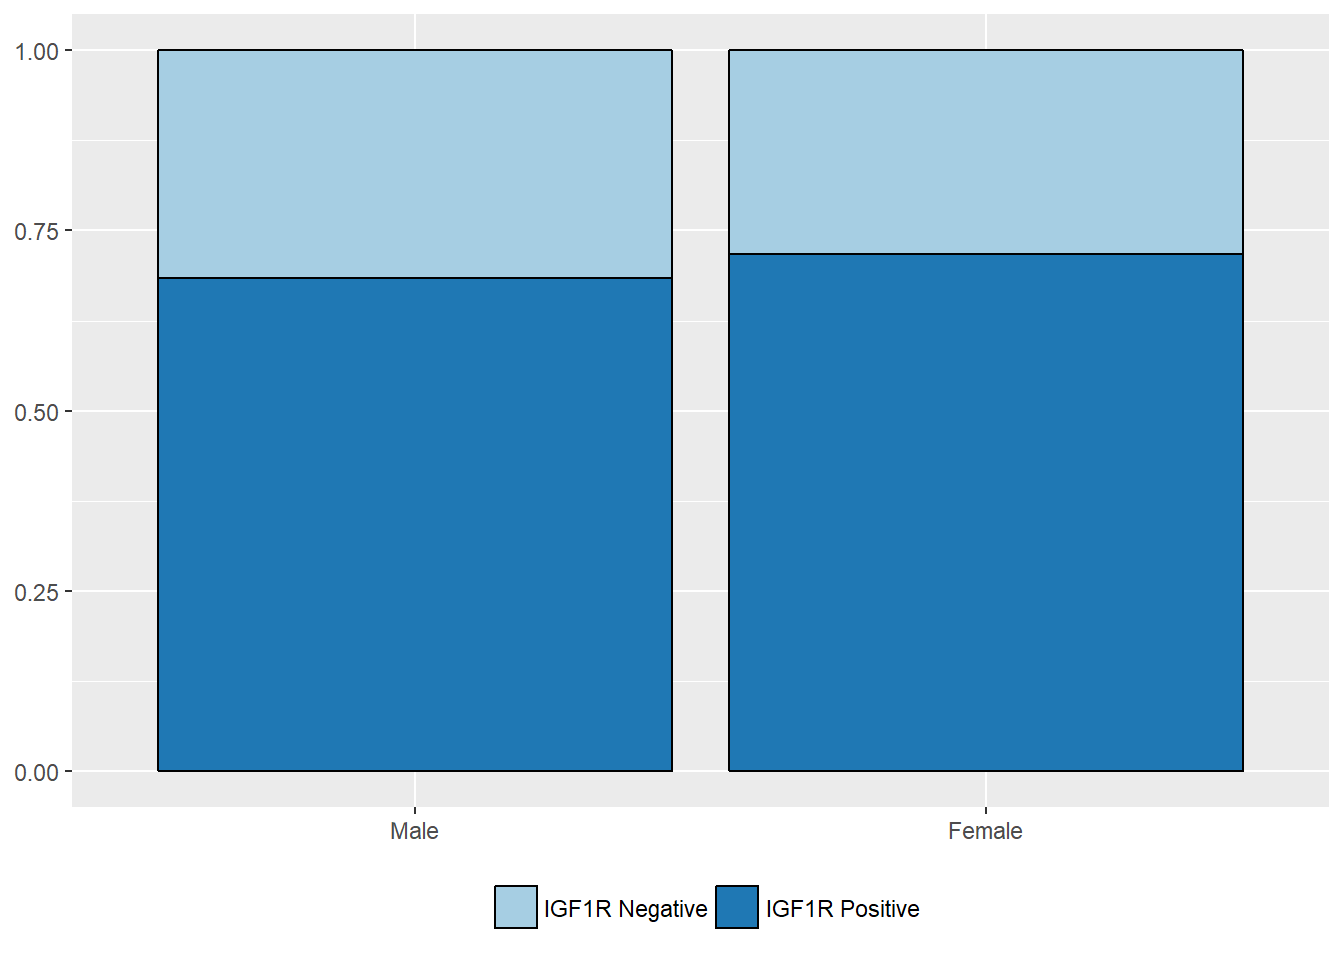
Sex
| IGF1R Negative (%) | IGF1R Positive (%) | |
|---|---|---|
| Male | 19 (63.3) | 41 (59.4) |
| Female | 11 (36.7) | 28 (40.6) |
| Value | |
|---|---|
| Statistic | 0.02028 |
| Parameter | 1 |
| P statistic | 0.89 |
Pathologic features
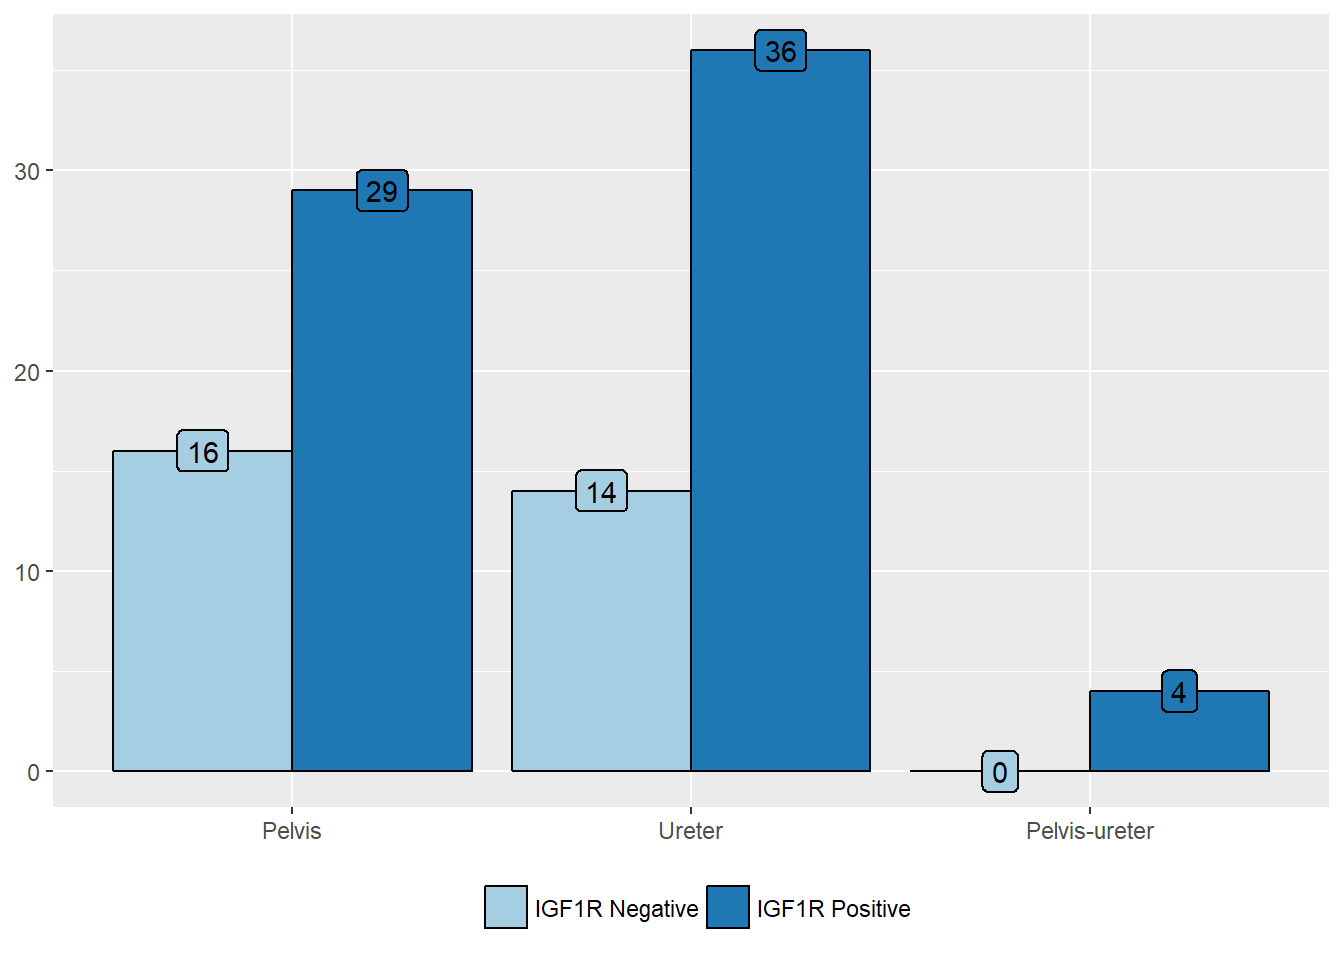
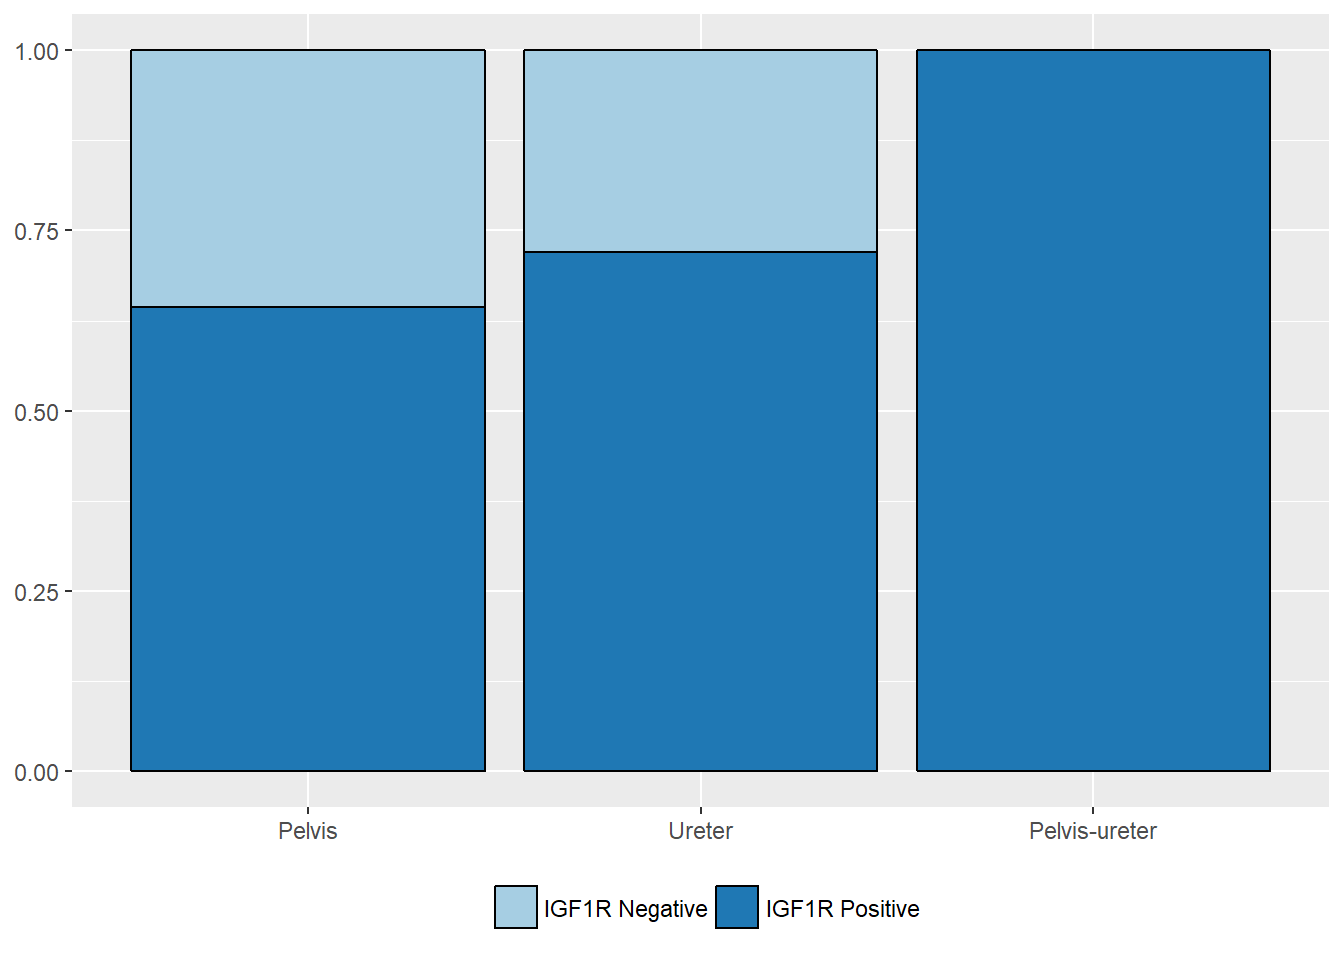
Tumor location
| IGF1R Negative (%) | IGF1R Positive (%) | |
|---|---|---|
| Pelvis | 16 (53.3) | 29 (42) |
| Ureter | 14 (46.7) | 36 (52.2) |
| Pelvis-ureter | 0 (0) | 4 (5.8) |
| Value | |
|---|---|
| Statistic | 2.453 |
| Parameter | 2 |
| P statistic | 0.29 |
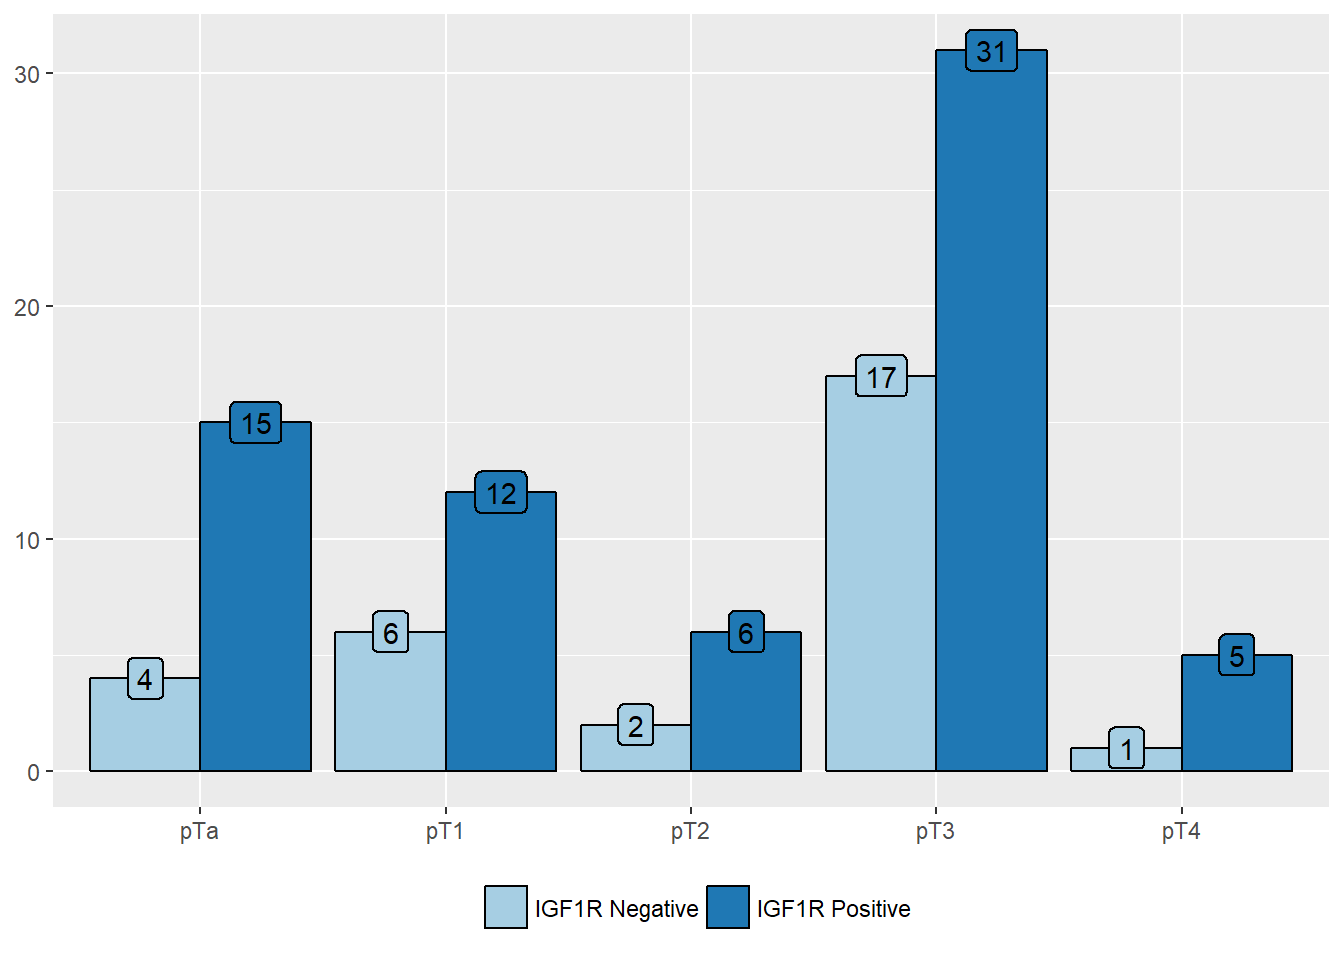
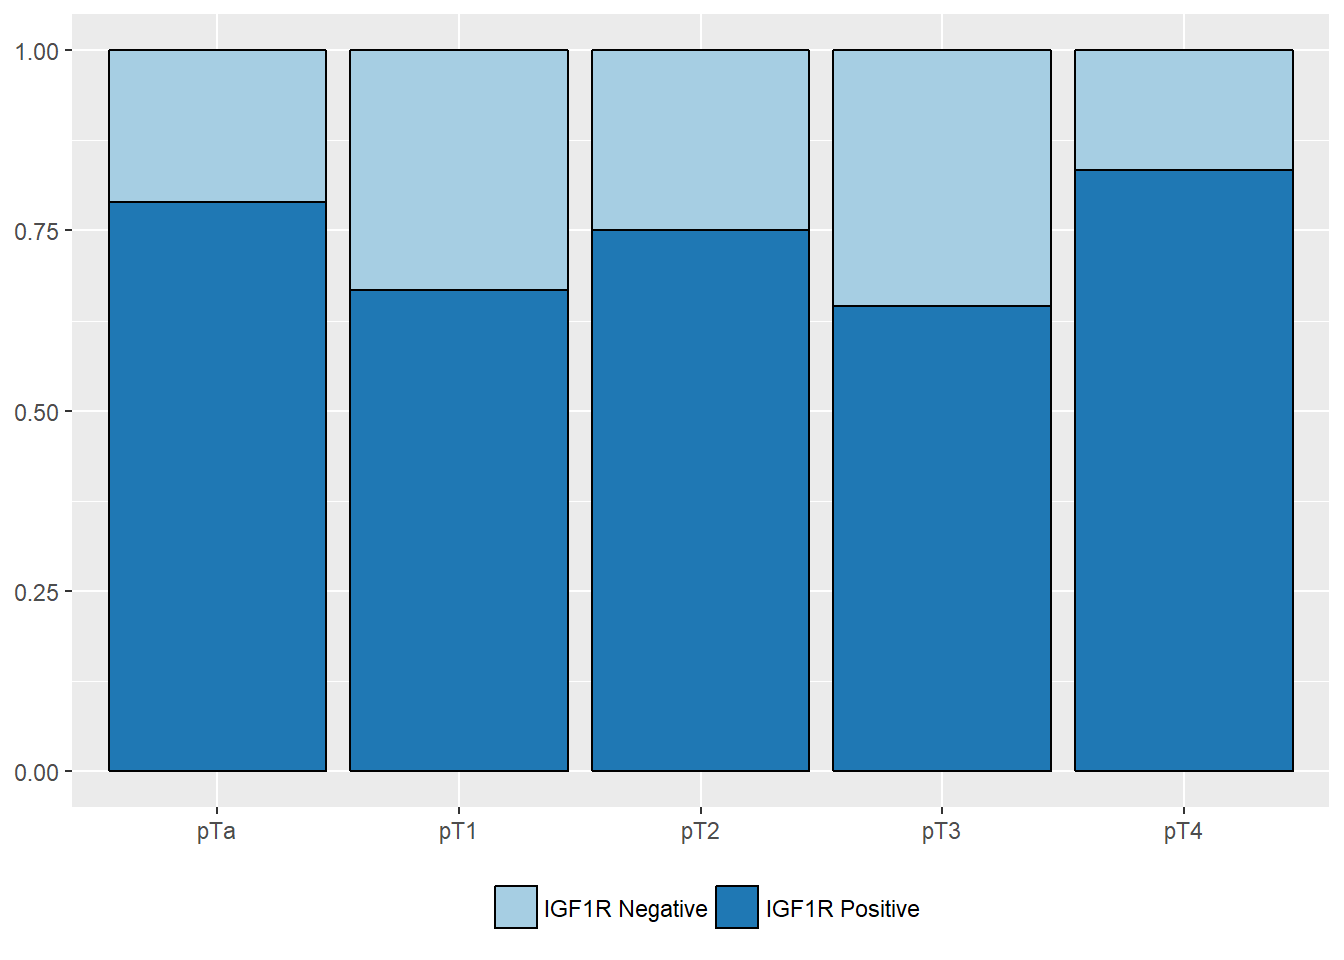
pT stage
| IGF1R Negative (%) | IGF1R Positive (%) | |
|---|---|---|
| pTa | 4 (13.3) | 15 (21.7) |
| pT1 | 6 (20) | 12 (17.4) |
| pT2 | 2 (6.7) | 6 (8.7) |
| pT3 | 17 (56.7) | 31 (44.9) |
| pT4 | 1 (3.3) | 5 (7.2) |
| Value | |
|---|---|
| Statistic | 2.077 |
| Parameter | 4 |
| P statistic | 0.72 |
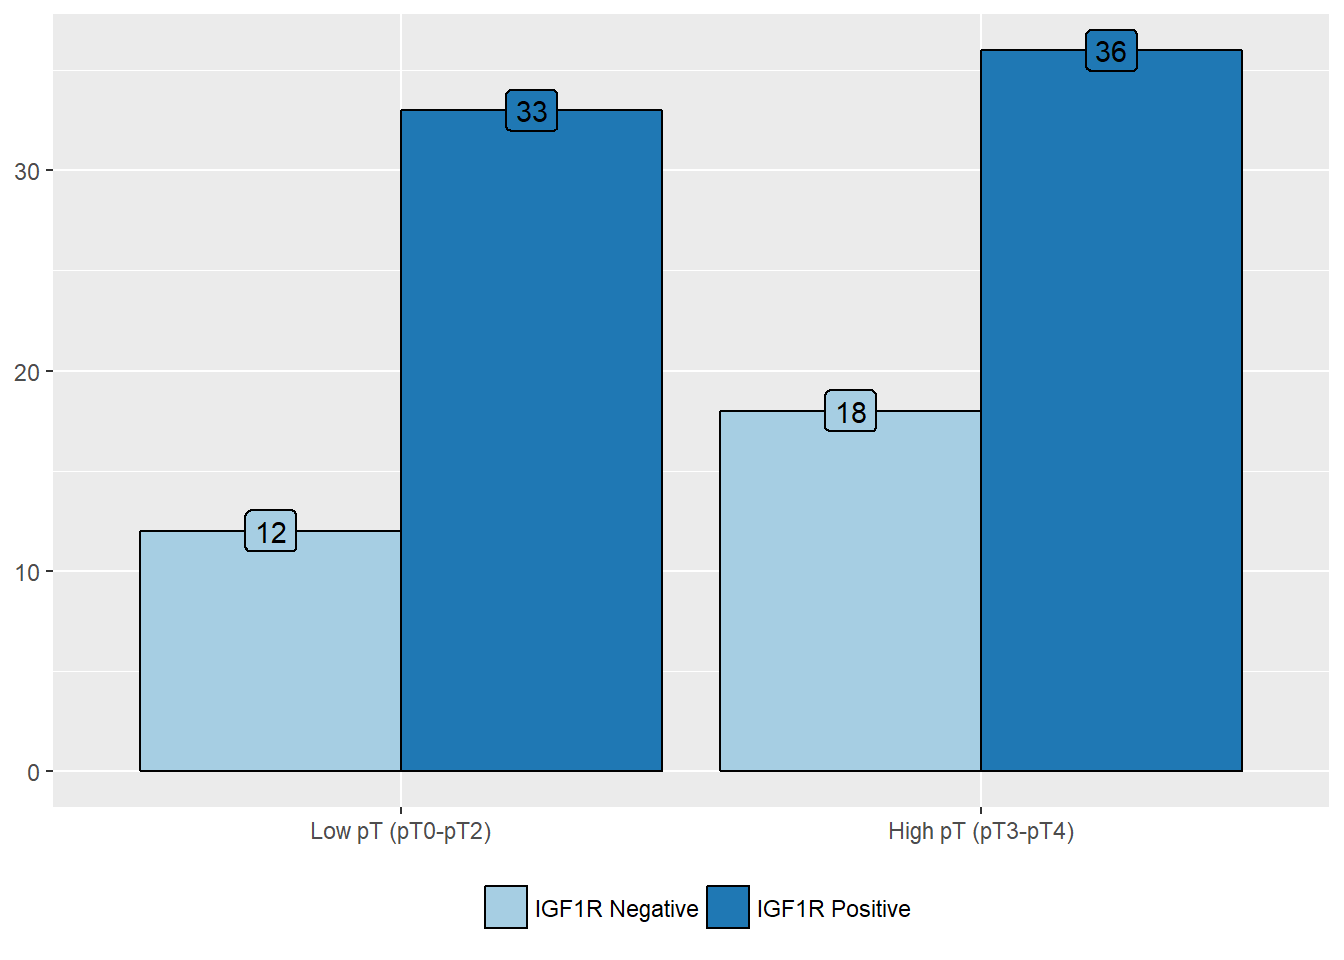
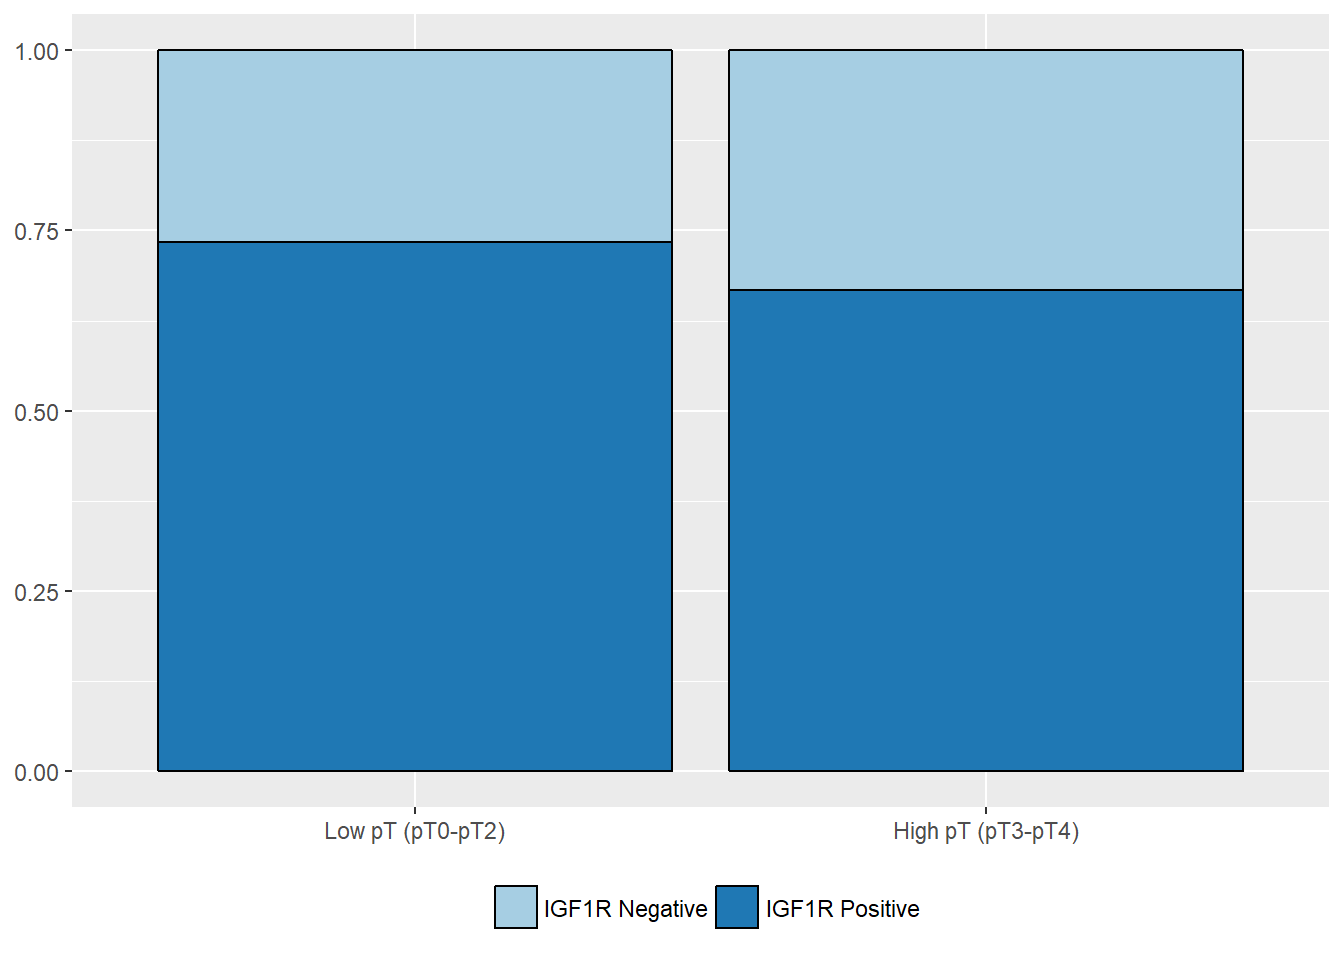
High pT stage
| IGF1R Negative (%) | IGF1R Positive (%) | |
|---|---|---|
| Low pT (pT0-pT2) | 12 (40) | 33 (47.8) |
| High pT (pT3-pT4) | 18 (60) | 36 (52.2) |
| Value | |
|---|---|
| Statistic | 0.2491 |
| Parameter | 1 |
| P statistic | 0.62 |
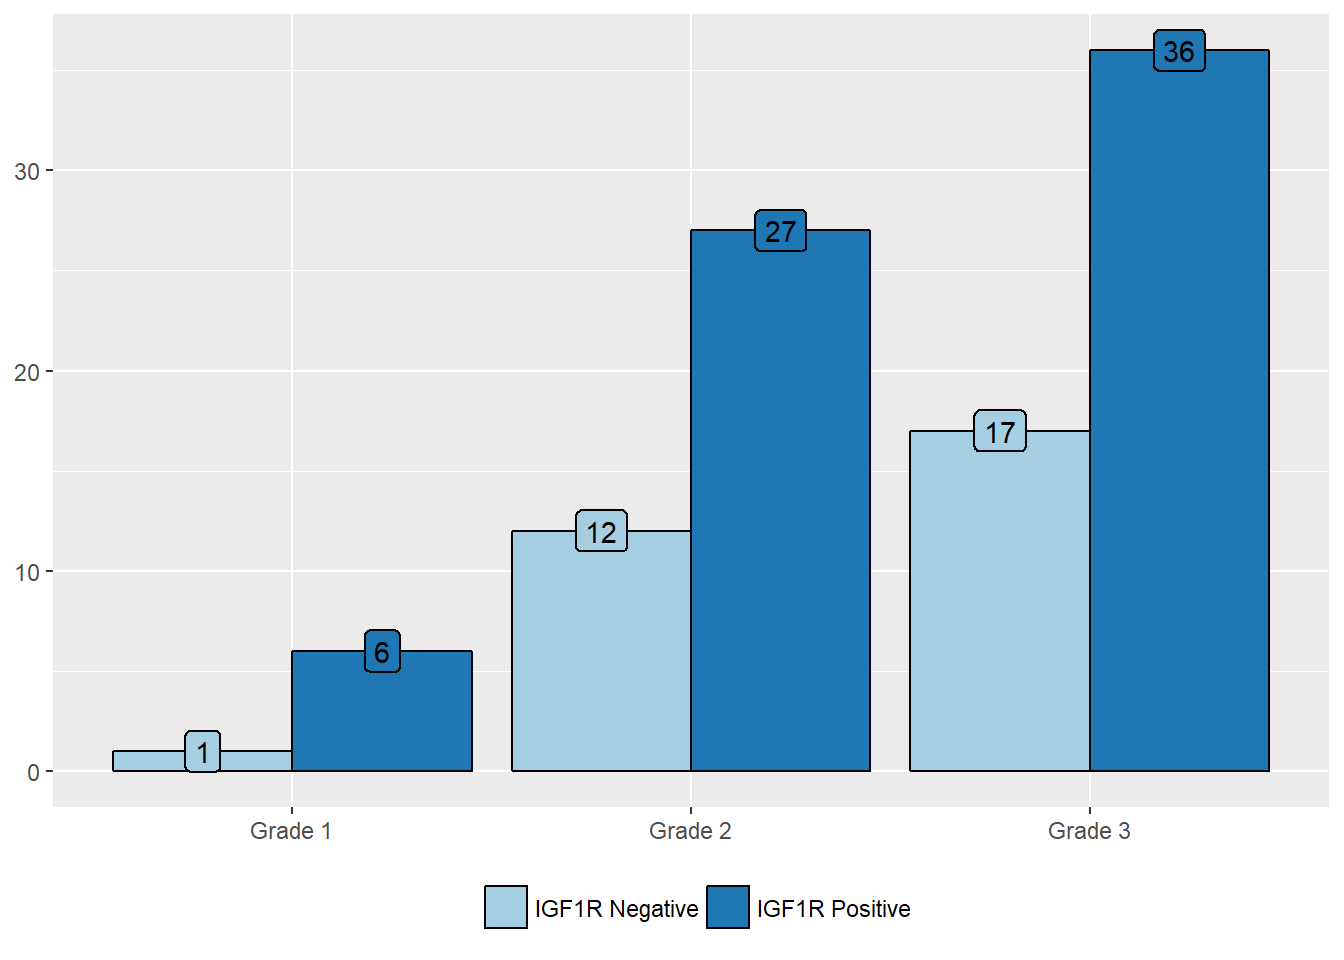
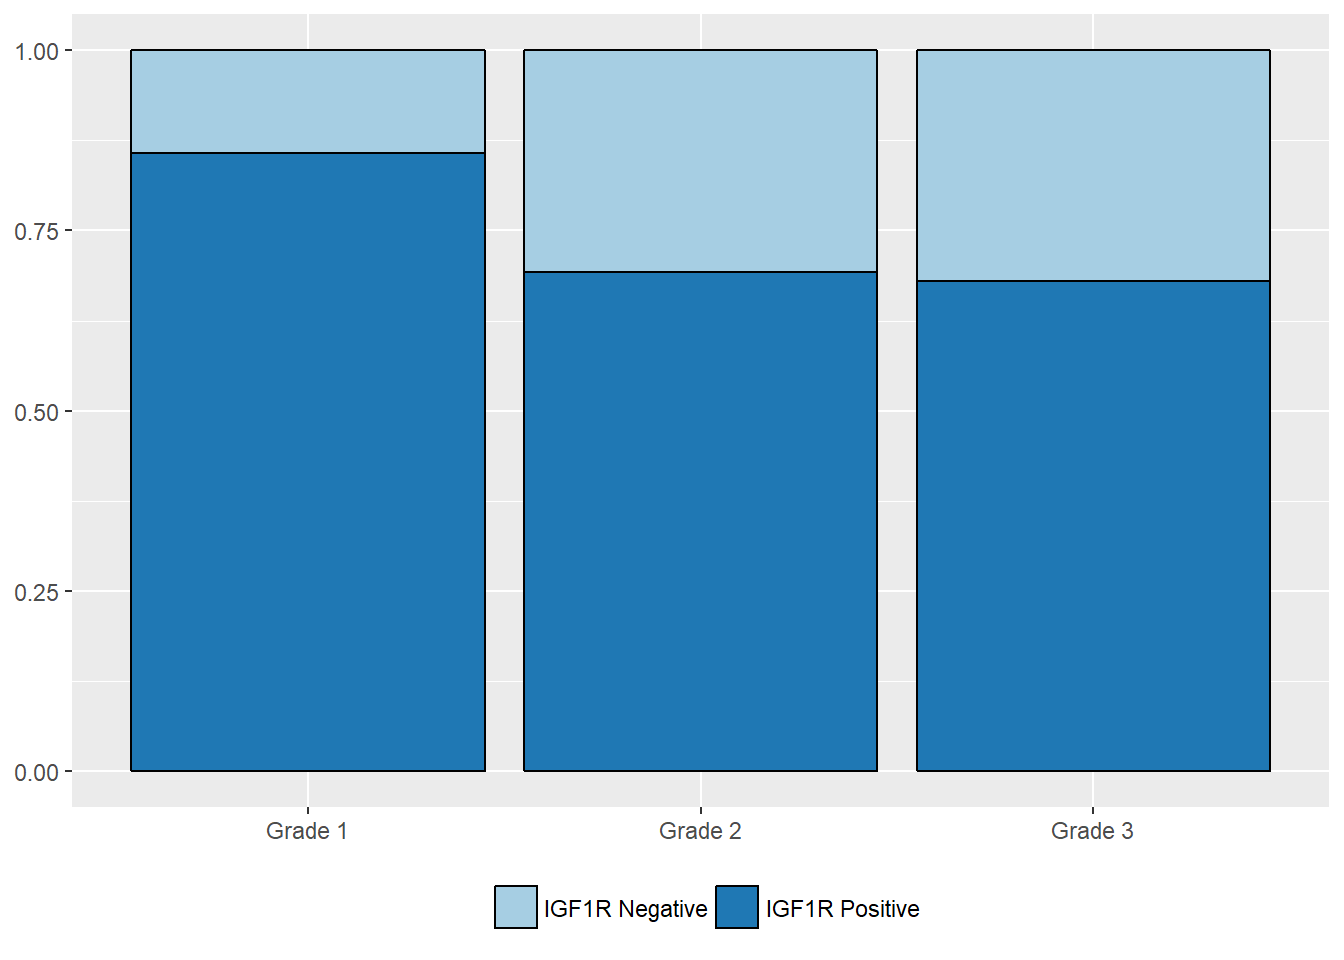
Histologic grade
| IGF1R Negative (%) | IGF1R Positive (%) | |
|---|---|---|
| Grade 1 | 1 (3.3) | 6 (8.7) |
| Grade 2 | 12 (40) | 27 (39.1) |
| Grade 3 | 17 (56.7) | 36 (52.2) |
| Value | |
|---|---|
| Statistic | 0.9332 |
| Parameter | 2 |
| P statistic | 0.63 |
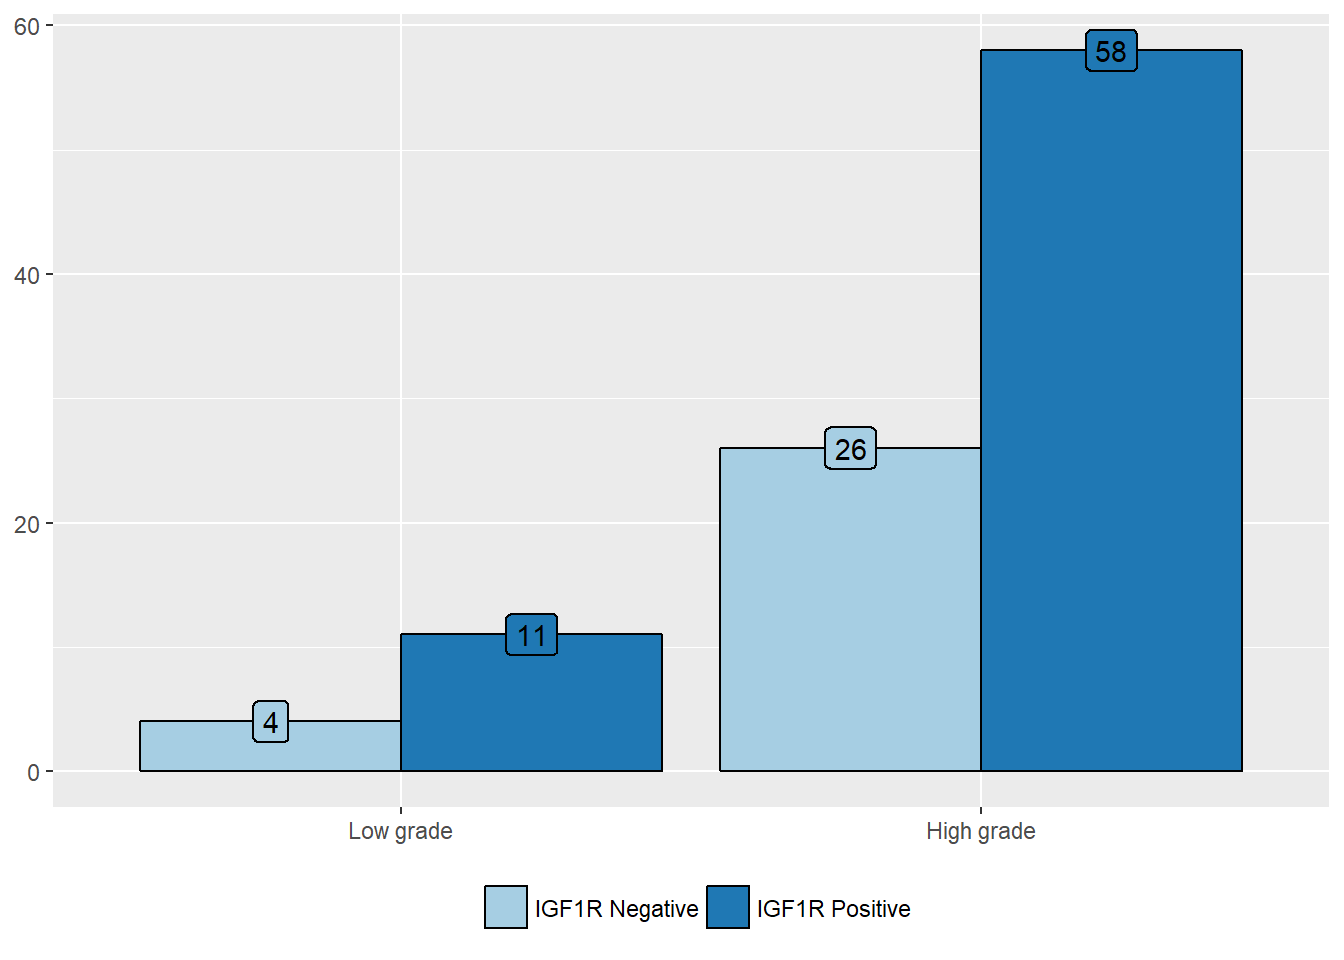
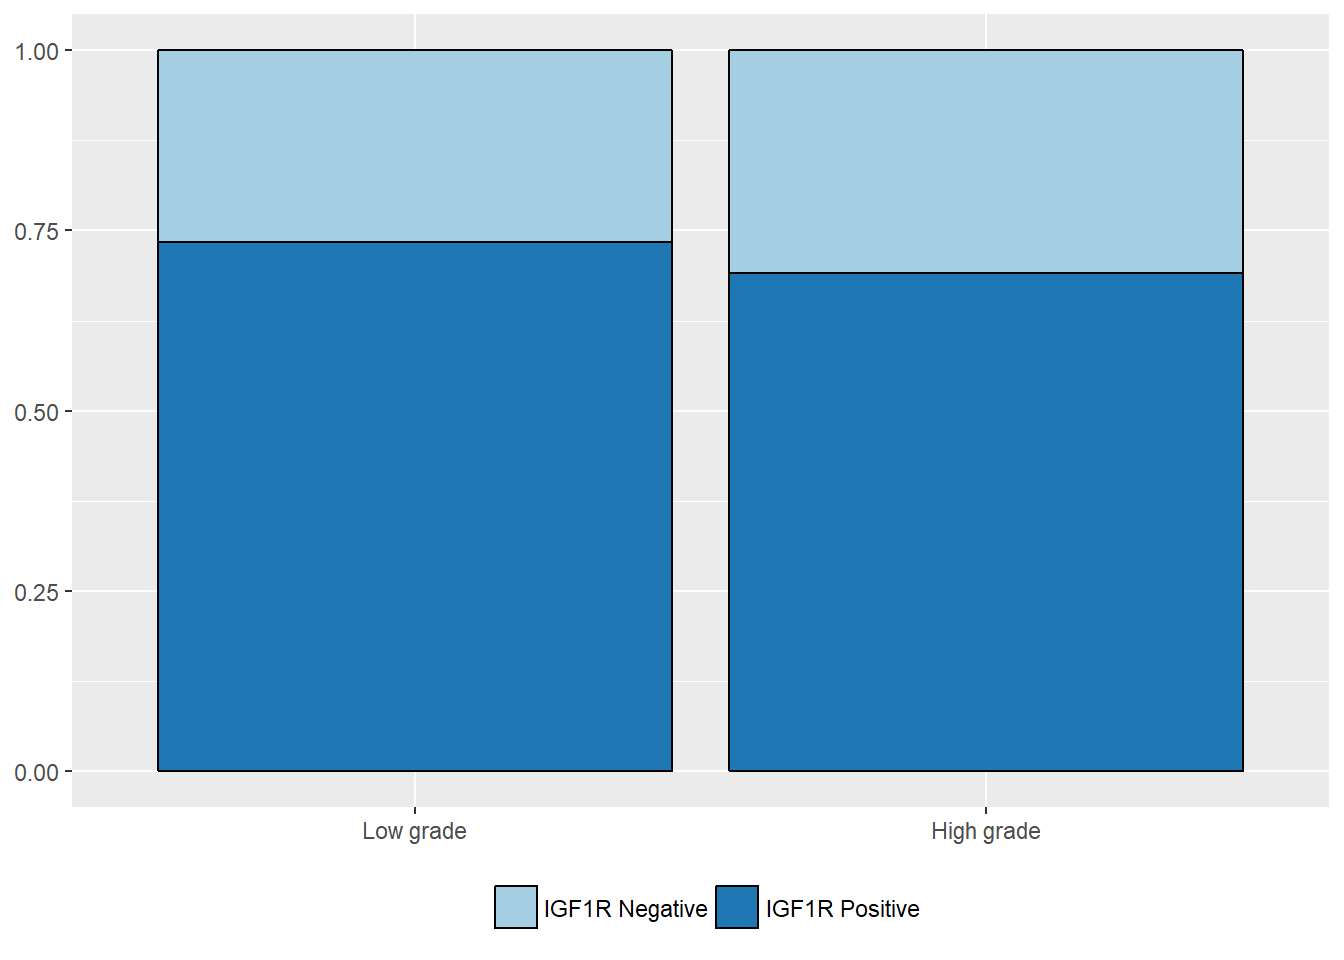
High histologic grade
| IGF1R Negative (%) | IGF1R Positive (%) | |
|---|---|---|
| Low grade | 4 (13.3) | 11 (15.9) |
| High grade | 26 (86.7) | 58 (84.1) |
| Value | |
|---|---|
| Statistic | 0.0007686 |
| Parameter | 1 |
| P statistic | 0.98 |
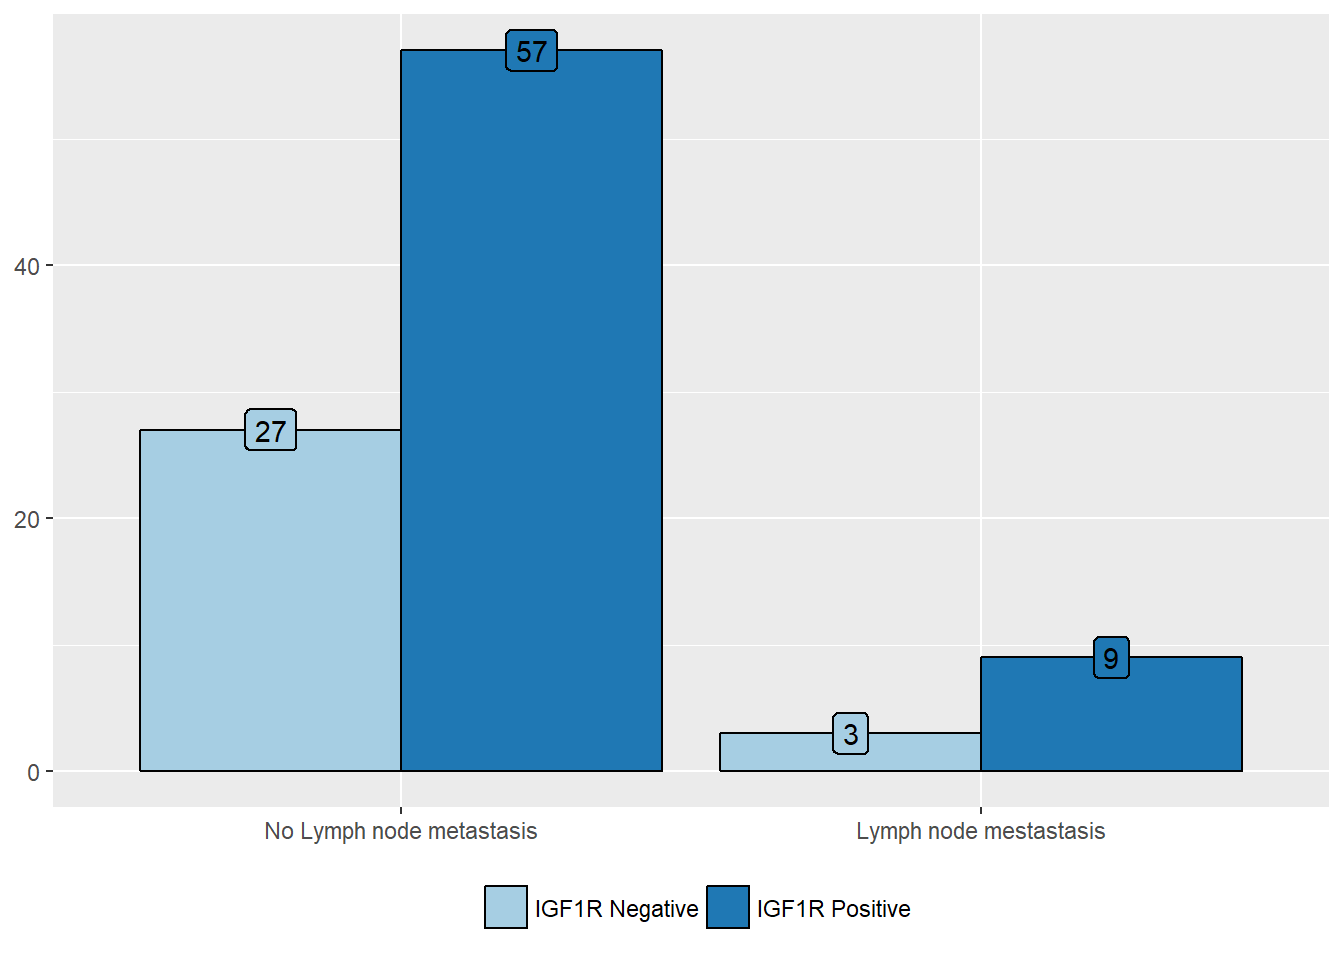
Lymph nodes metastasis
| IGF1R Negative (%) | IGF1R Positive (%) | |
|---|---|---|
| No Lymph node metastasis | 27 (90) | 57 (86.4) |
| Lymph node mestastasis | 3 (10) | 9 (13.6) |
| Value | |
|---|---|
| Statistic | 0.02771 |
| Parameter | 1 |
| P statistic | 0.87 |

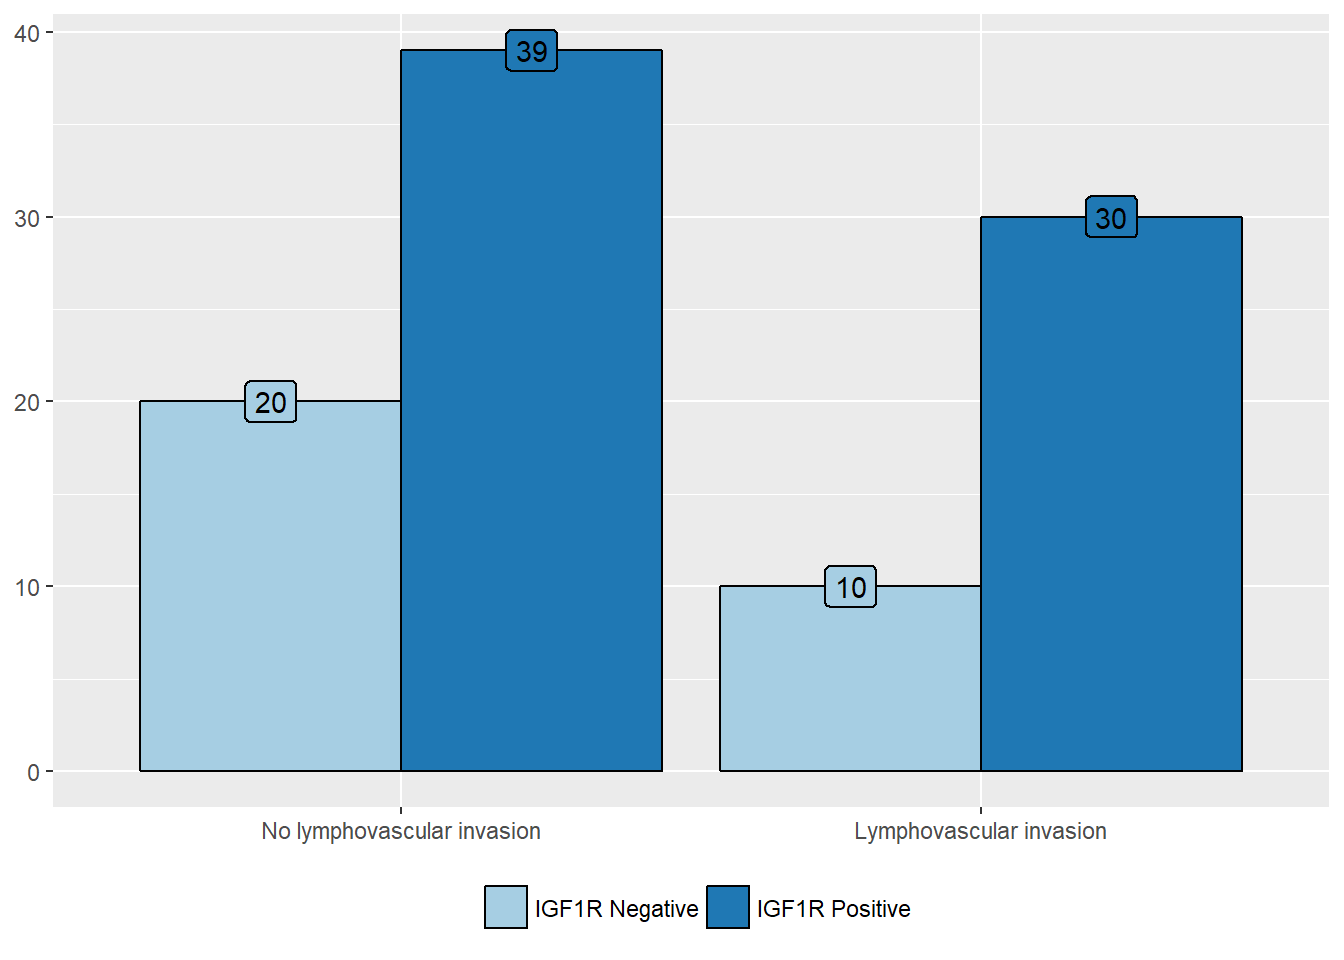
Lymphovascular invasion
| IGF1R Negative (%) | IGF1R Positive (%) | |
|---|---|---|
| No lymphovascular invasion | 20 (66.7) | 39 (56.5) |
| Lymphovascular invasion | 10 (33.3) | 30 (43.5) |
| Value | |
|---|---|
| Statistic | 0.522 |
| Parameter | 1 |
| P statistic | 0.47 |

Outcome features
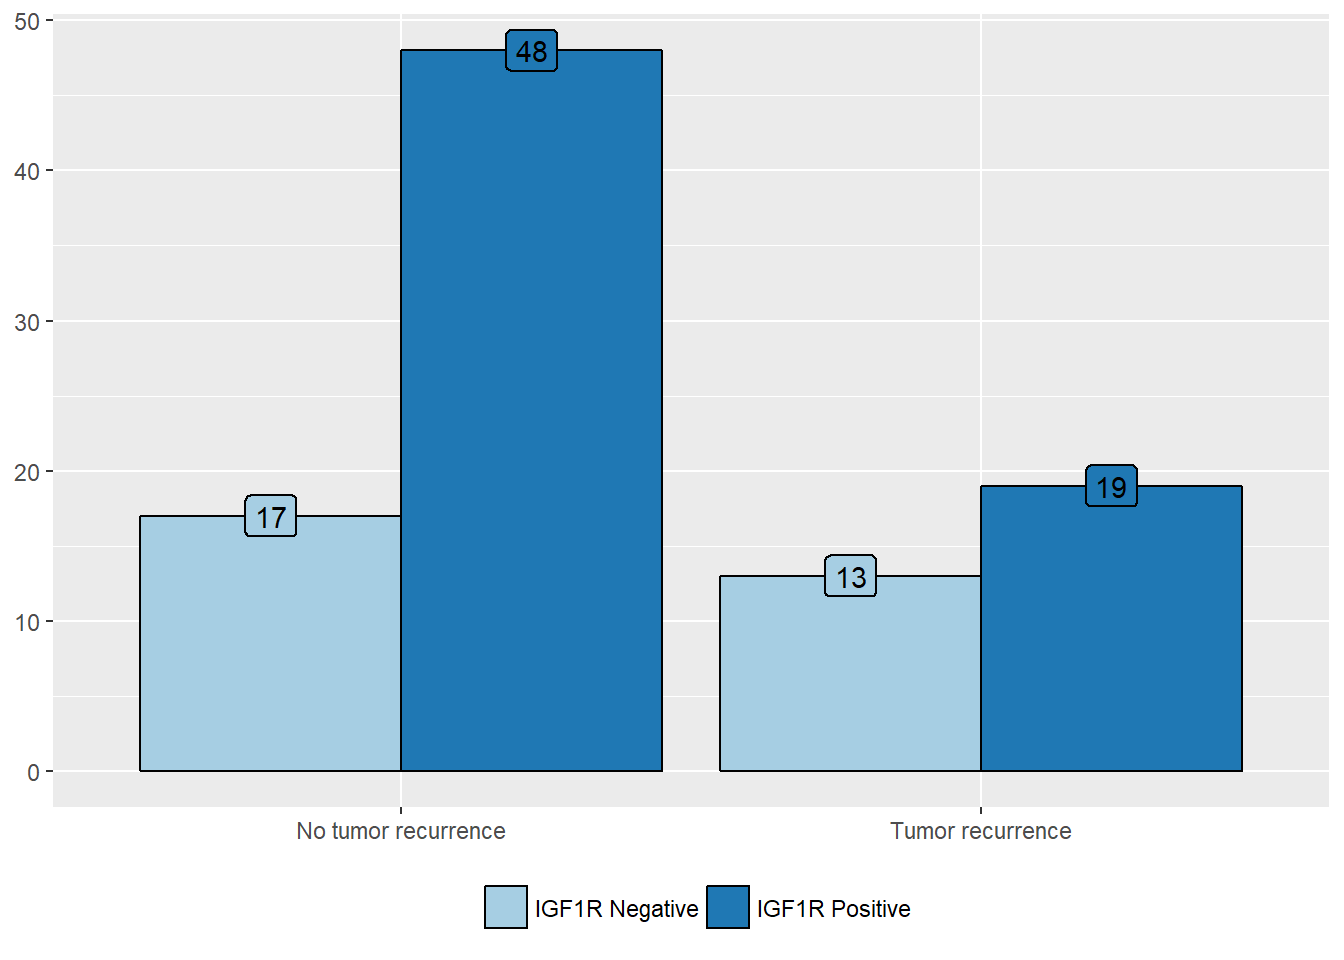
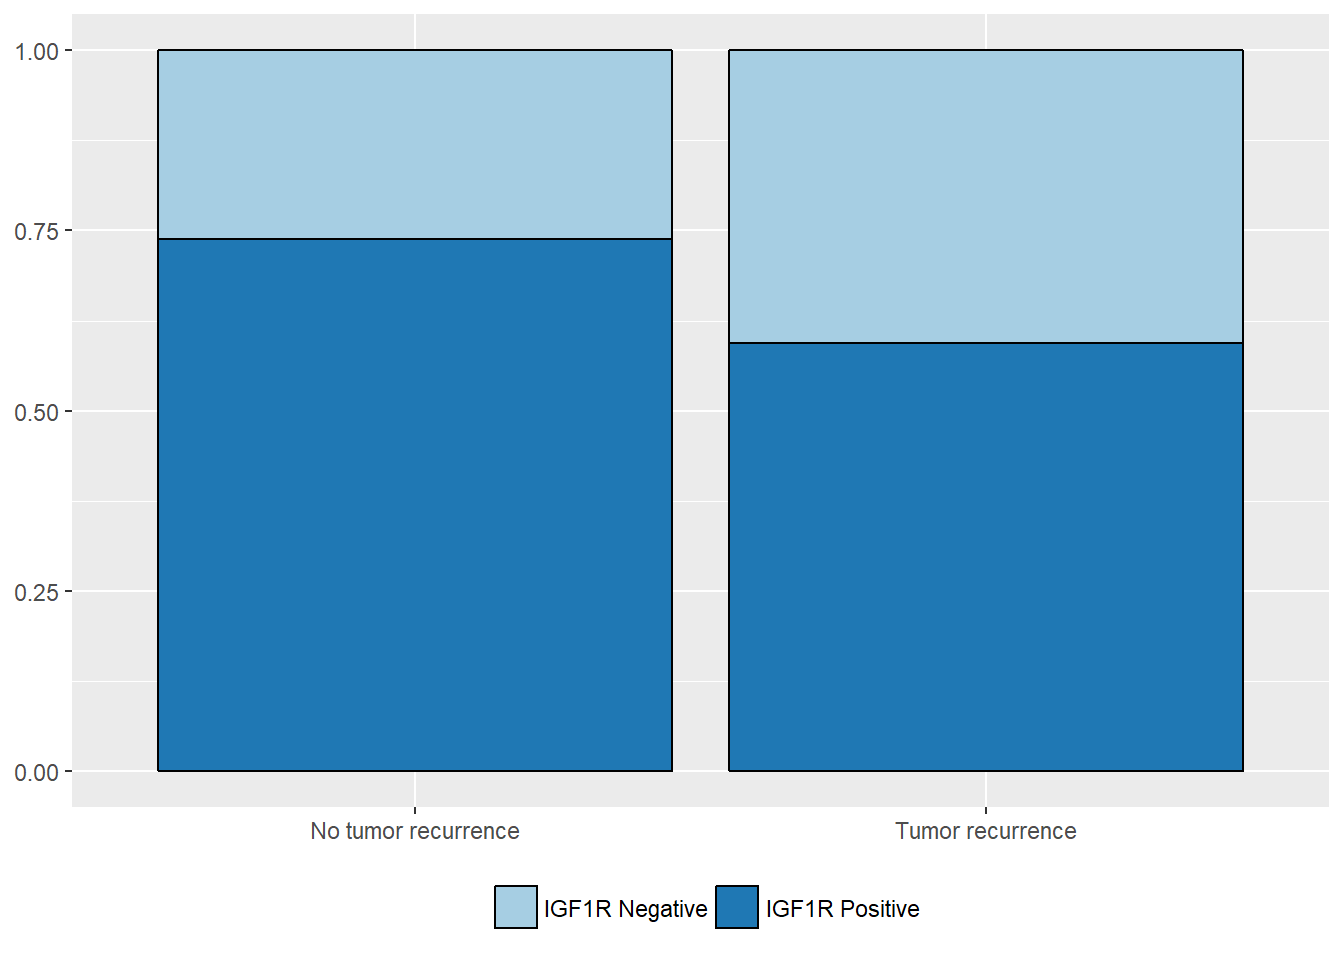
Tumor recurrence
| IGF1R Negative (%) | IGF1R Positive (%) | |
|---|---|---|
| No tumor recurrence | 17 (56.7) | 48 (71.6) |
| Tumor recurrence | 13 (43.3) | 19 (28.4) |
| Value | |
|---|---|
| Statistic | 1.479 |
| Parameter | 1 |
| P statistic | 0.22 |
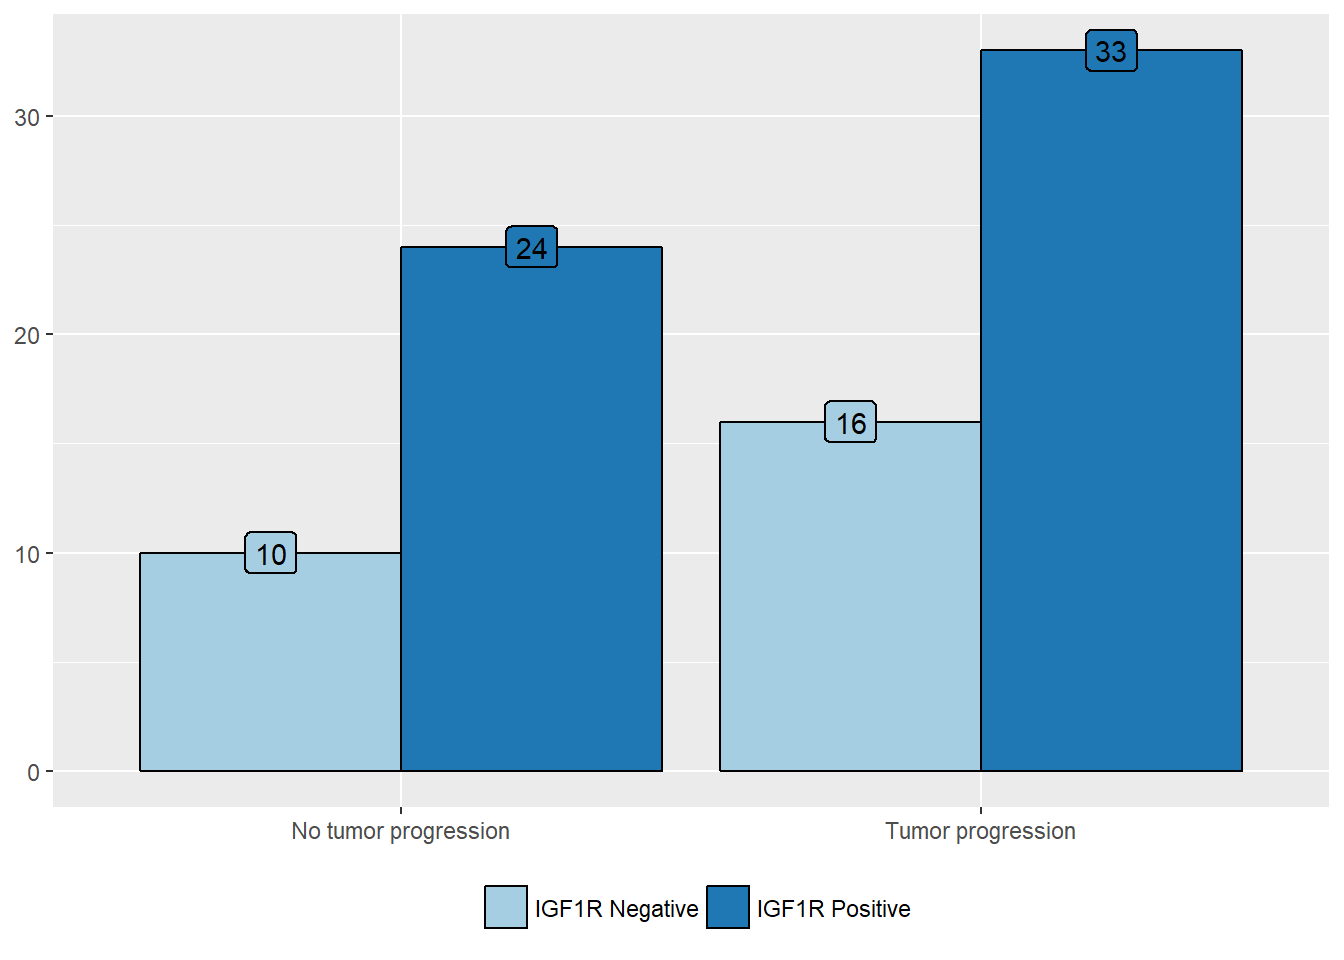
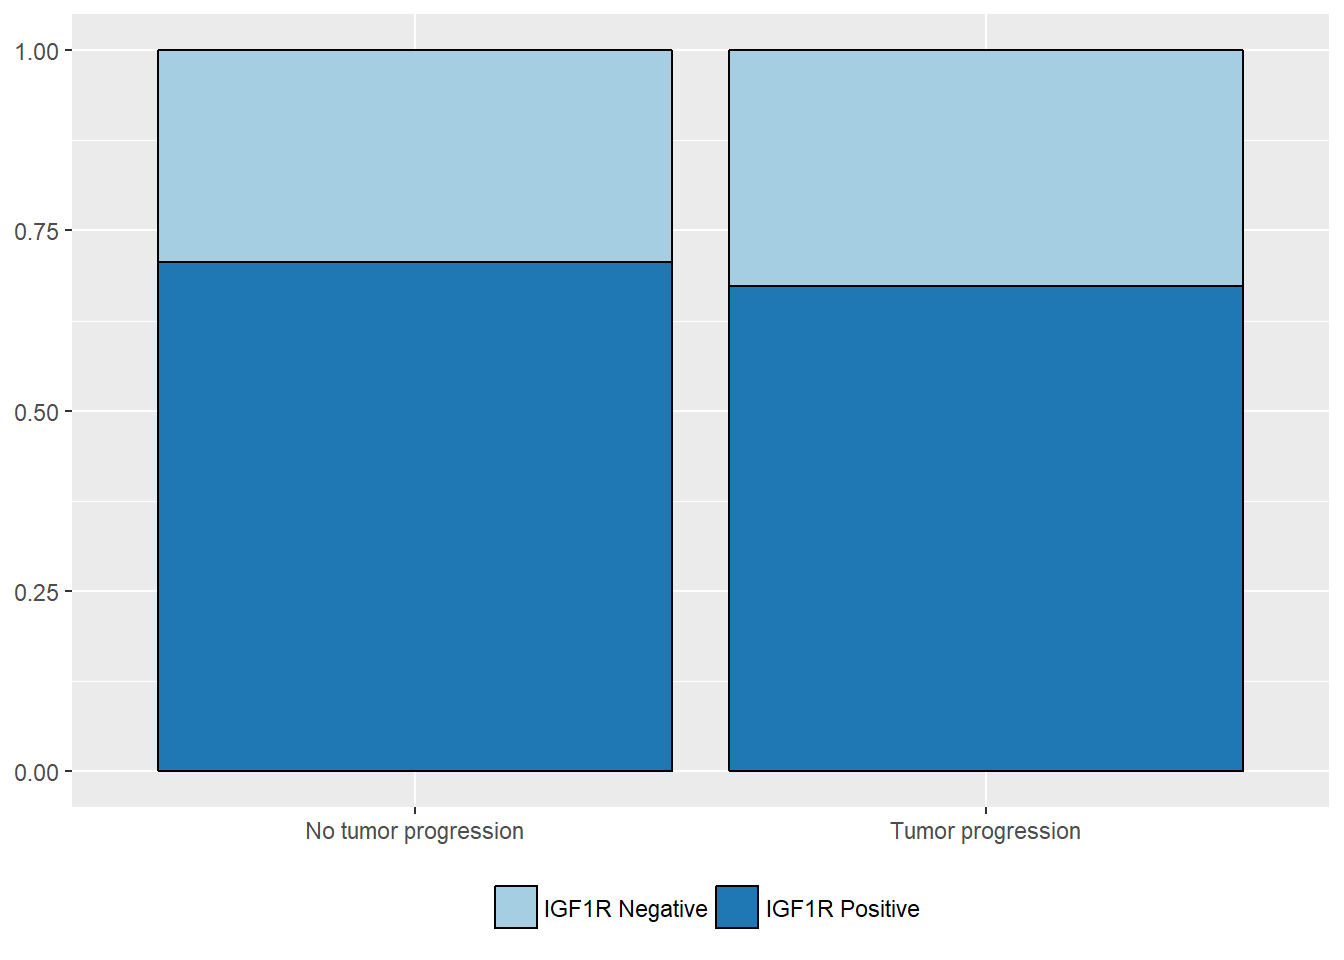
Tumor progression
| IGF1R Negative (%) | IGF1R Positive (%) | |
|---|---|---|
| No tumor progression | 10 (38.5) | 24 (42.1) |
| Tumor progression | 16 (61.5) | 33 (57.9) |
| Value | |
|---|---|
| Statistic | 0.005253 |
| Parameter | 1 |
| P statistic | 0.94 |
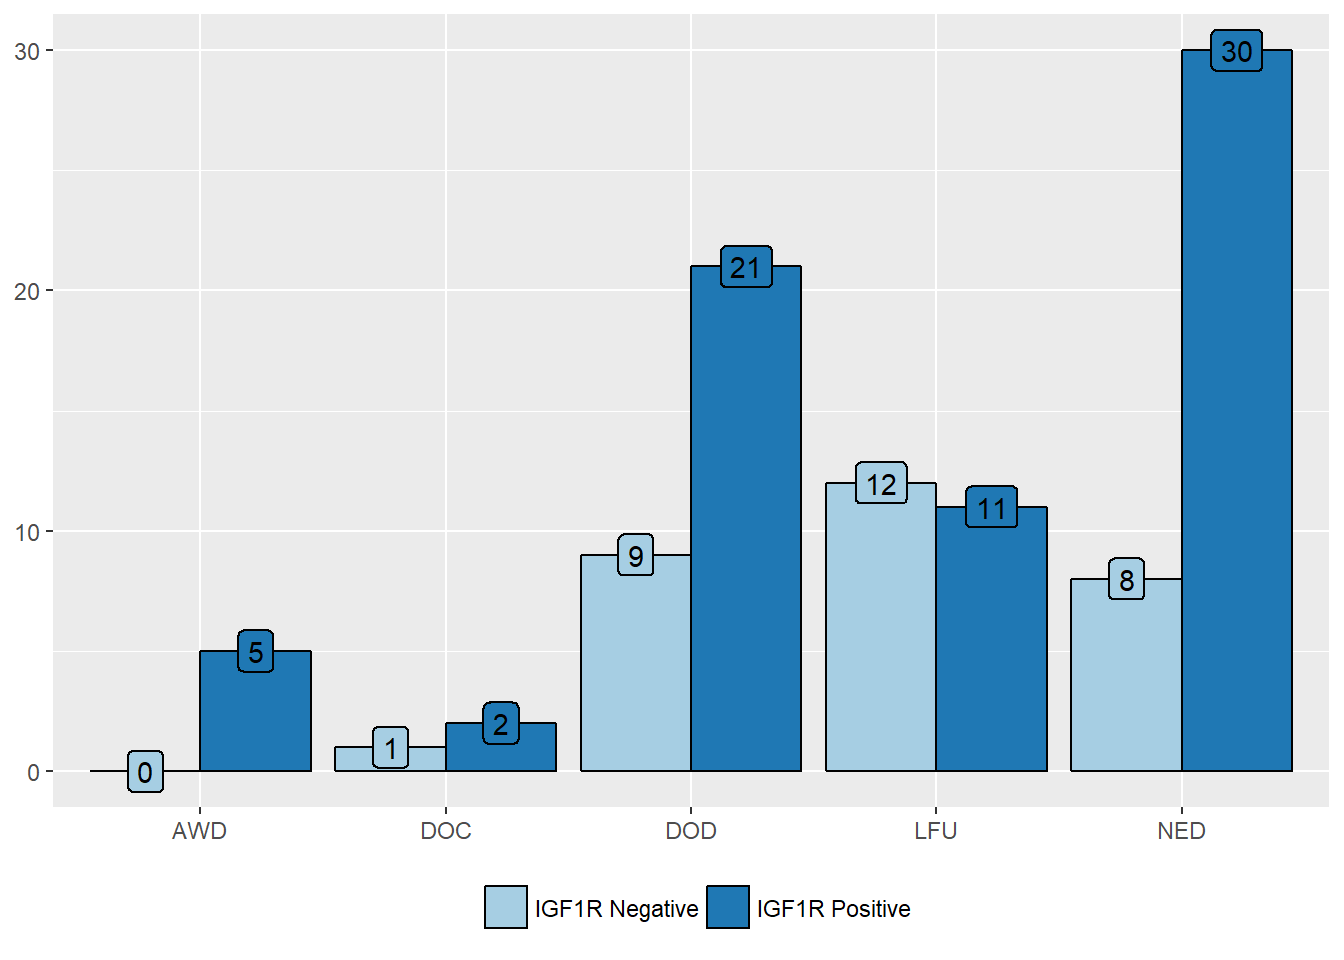
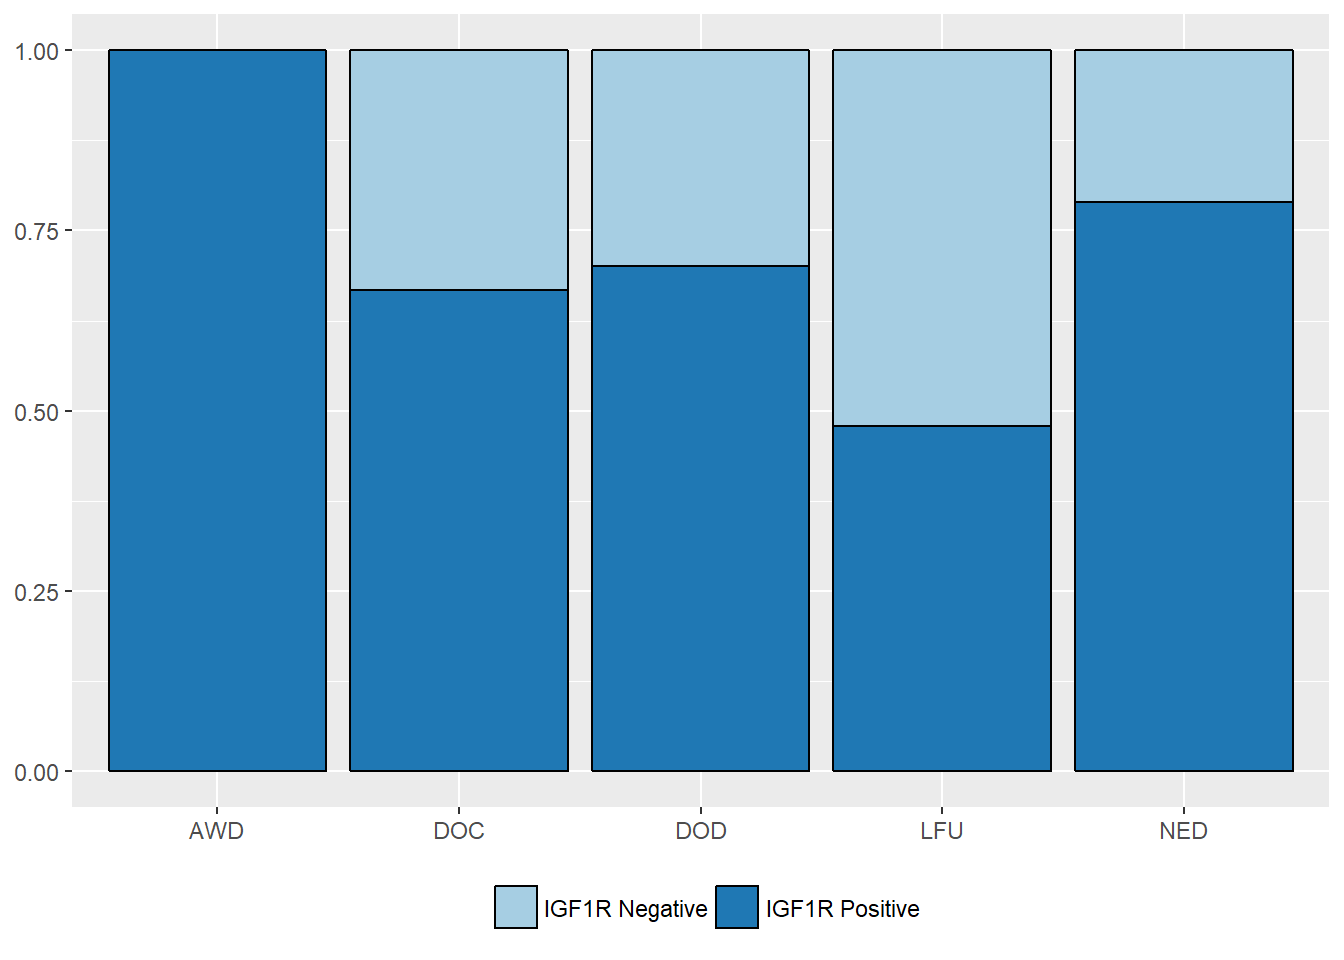
Patients’ outcome
| IGF1R Negative (%) | IGF1R Positive (%) | |
|---|---|---|
| AWD | 0 (0) | 5 (7.2) |
| DOC | 1 (3.3) | 2 (2.9) |
| DOD | 9 (30) | 21 (30.4) |
| LFU | 12 (40) | 11 (15.9) |
| NED | 8 (26.7) | 30 (43.5) |
| Value | |
|---|---|
| Statistic | 8.937 |
| Parameter | 4 |
| P statistic | 0.063 |
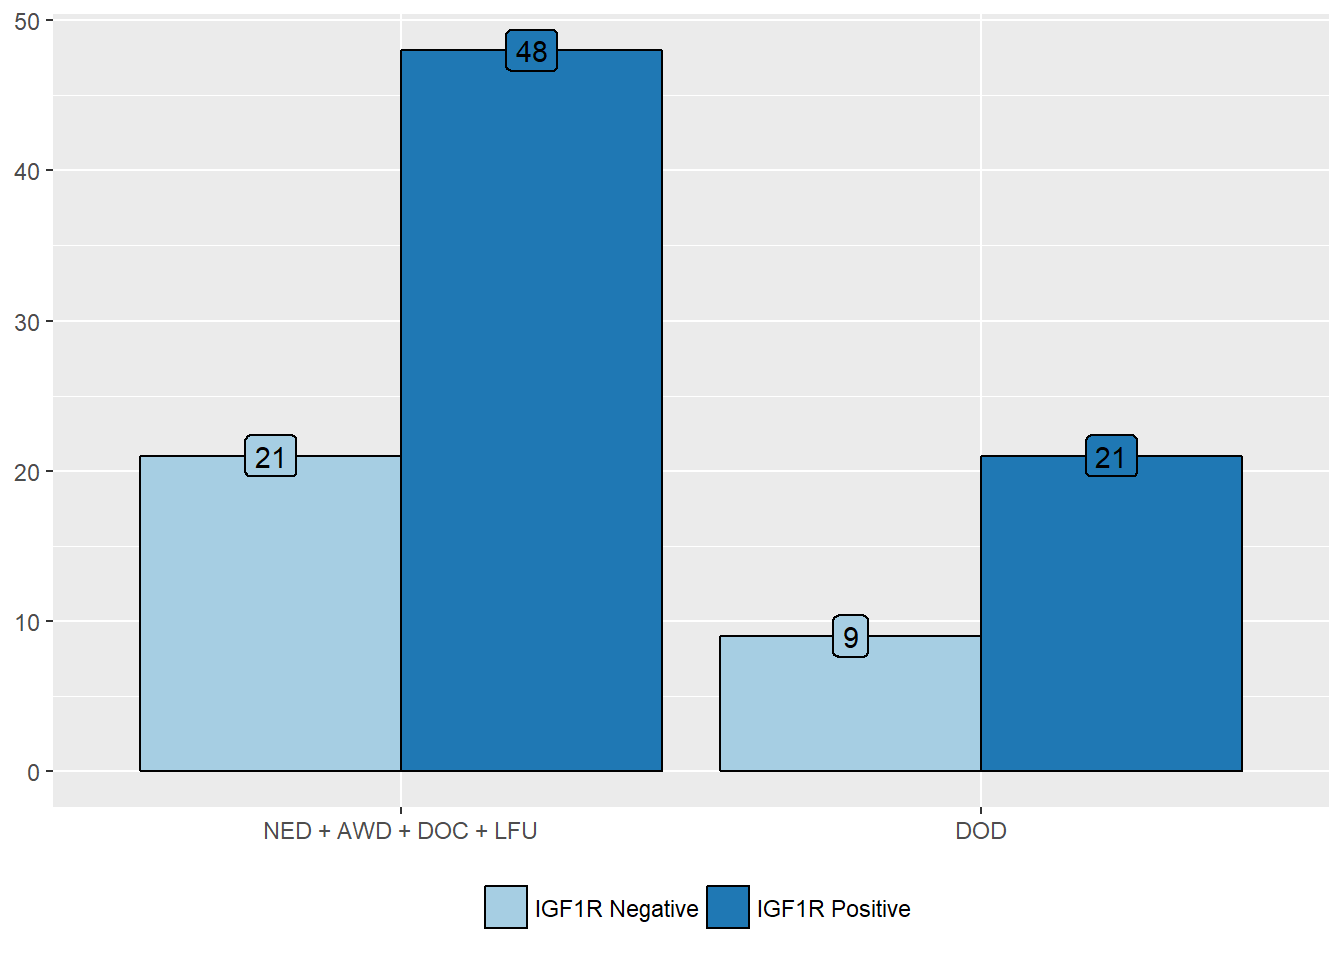
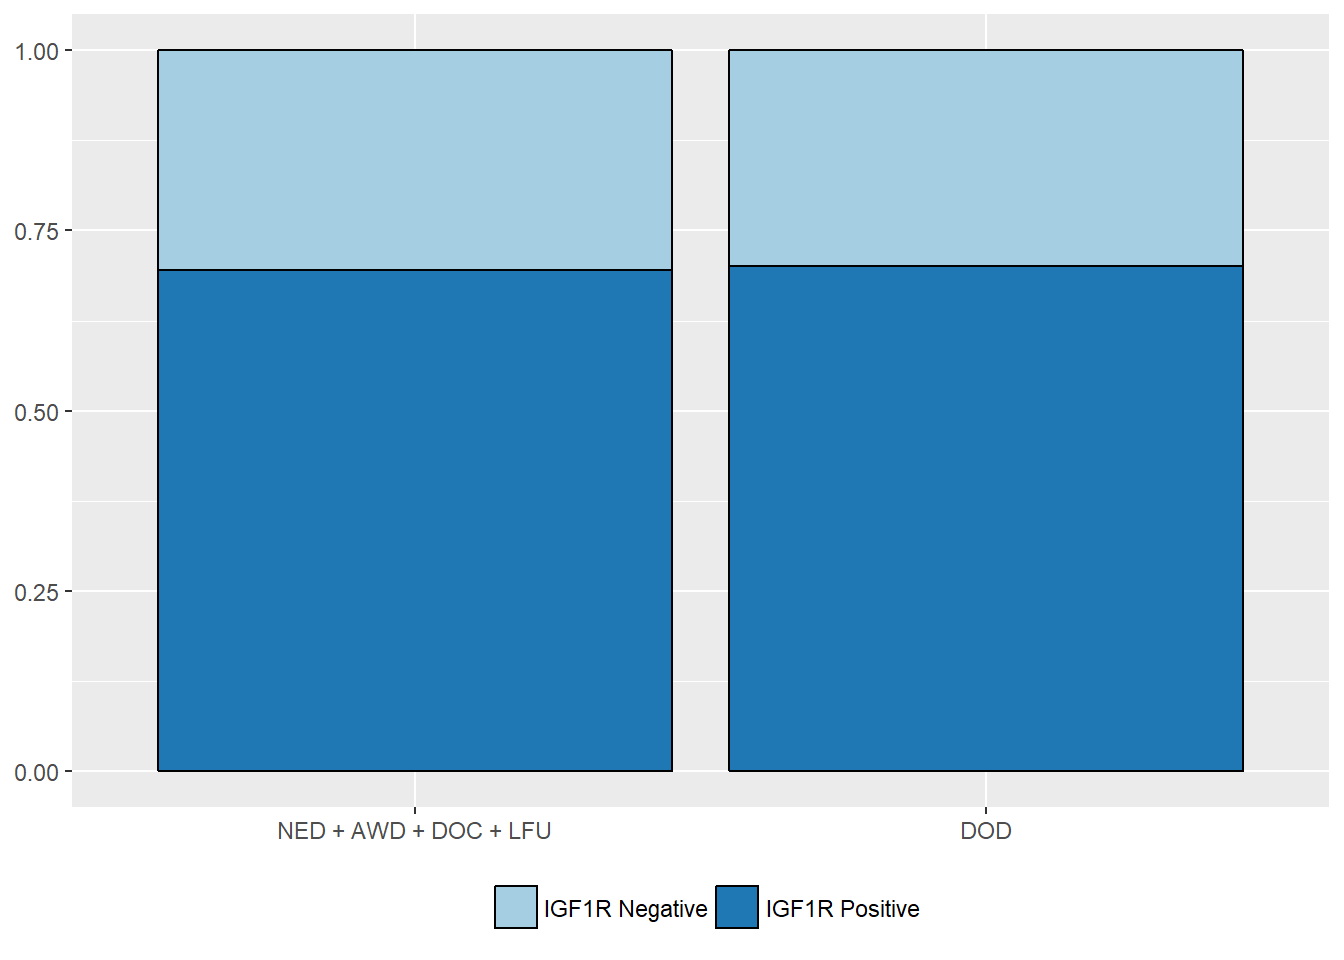
Cancer-specific mortality
| IGF1R Negative (%) | IGF1R Positive (%) | |
|---|---|---|
| NED + AWD + DOC + LFU | 21 (70) | 48 (69.6) |
| DOD | 9 (30) | 21 (30.4) |
| Value | |
|---|---|
| Statistic | 6.096e-31 |
| Parameter | 1 |
| P statistic | 1 |
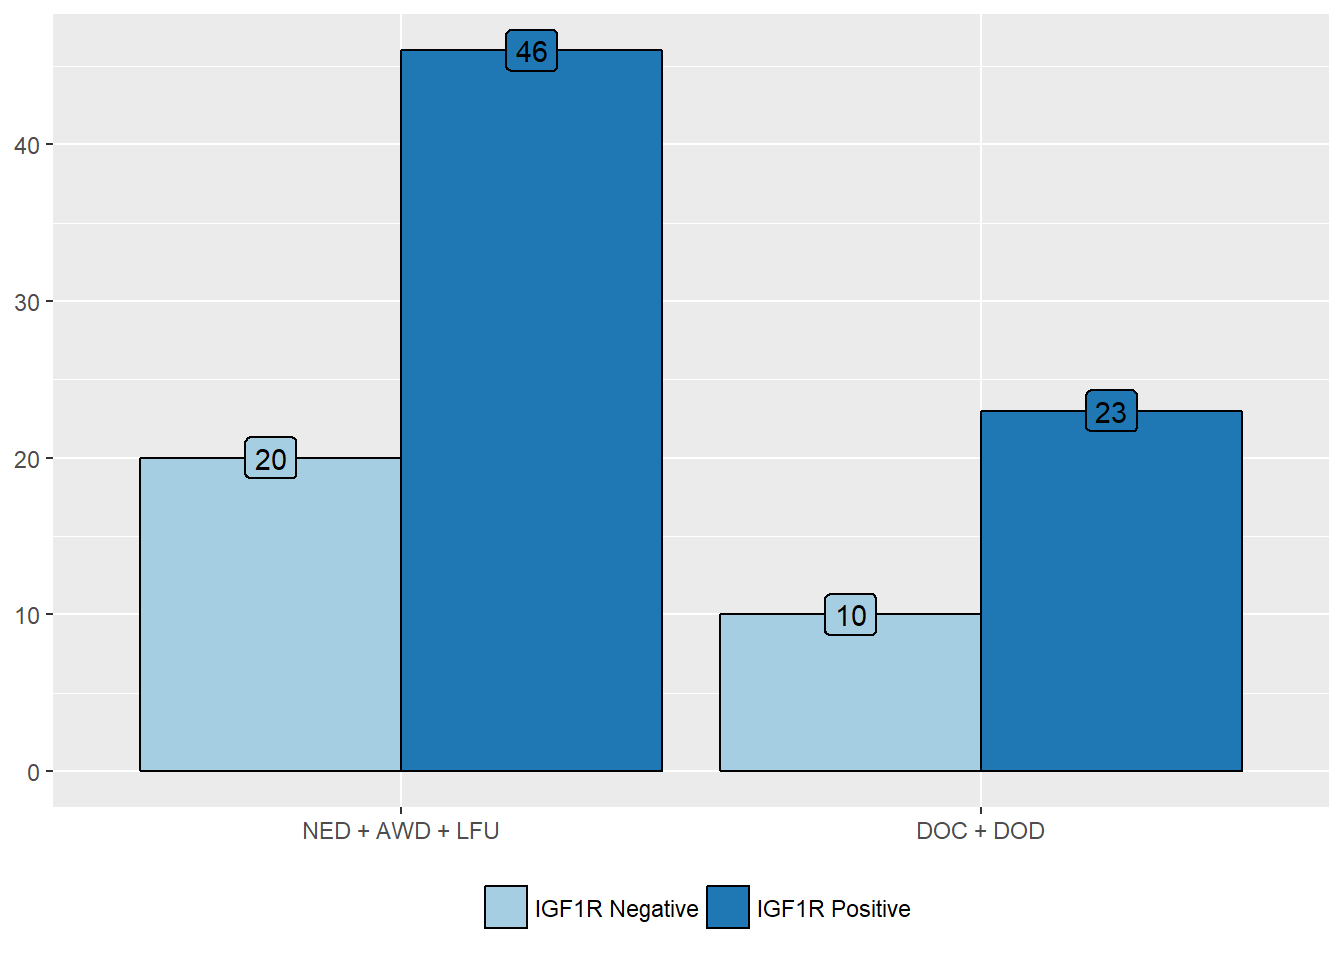
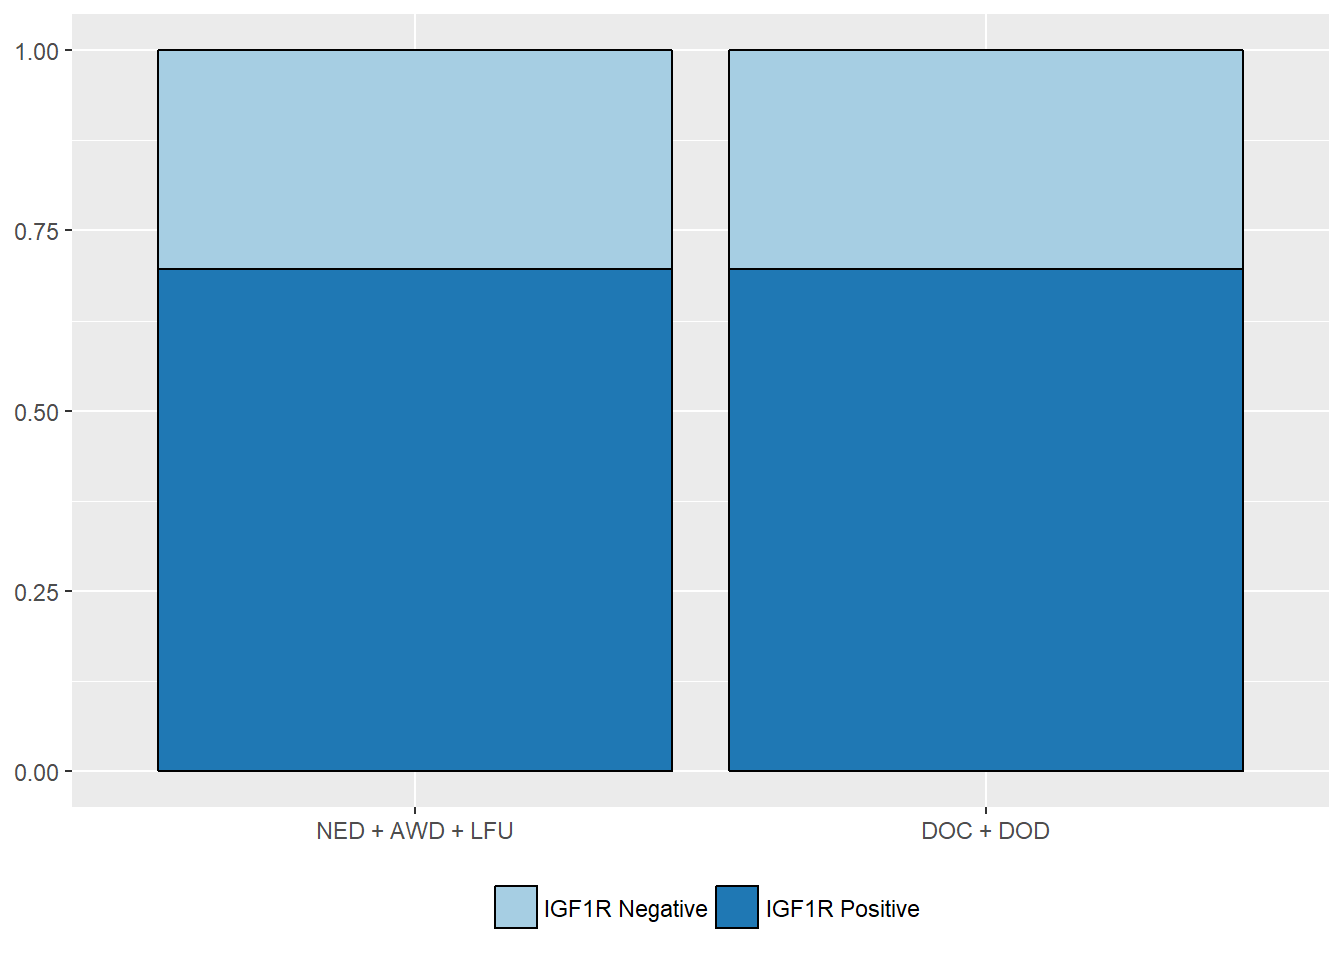
Overall mortality
| IGF1R Negative (%) | IGF1R Positive (%) | |
|---|---|---|
| NED + AWD + LFU | 20 (66.7) | 46 (66.7) |
| DOC + DOD | 10 (33.3) | 23 (33.3) |
| Value | |
|---|---|
| Statistic | 0 |
| Parameter | 1 |
| P statistic | 1 |